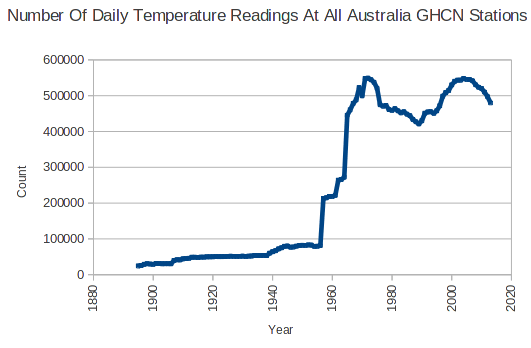
A few days ago I noted that the GHCN database for Australia has very little data prior to 1957, and wondered if the jump was due to Sputnik.
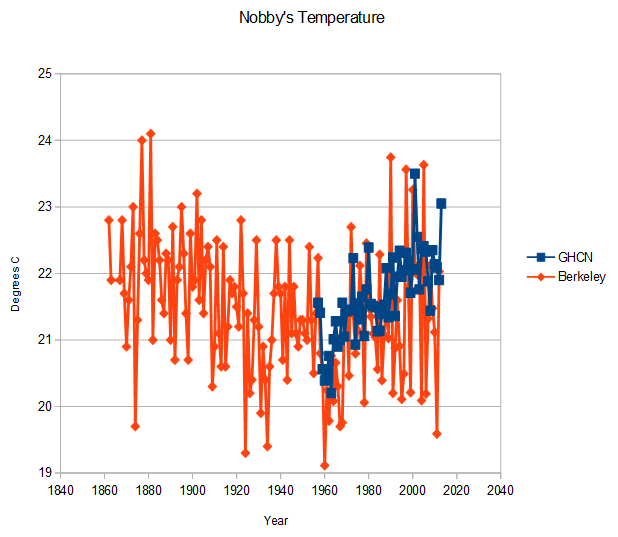
Well it turns out that lack of data prior to 1957 is due to GHCN simply not including it. Berkeley Earth has Nobbys data going back to the 1860’s, but the GHCN data is missing prior to 1957
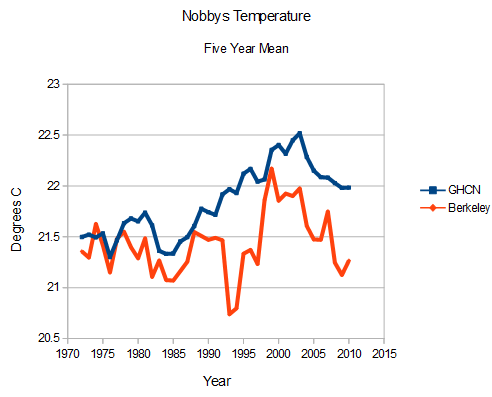
But it is worse than it seems. Note that the GHCN data is not the same, and averages about half a degree higher than the Berkeley Earth data.
But even that is worse than it seems. Yesterday I noted that the upwards slope at Nobbys was the same as the slope at Sydney since 1957. But according to Berkeley Earth, there has been no net warming at Nobby’s since 1970. Which means that Sydney is seeing major UHI effects.
Once again, this looks like major monkey business with the “every month hotter than normal” NOAA GHCN data.


excellent find!
thanks so much for all the work you put in:-)
AndyG posted this in a previous thread. Its from Norah Head (about half between Sydney and Newcastle)
http://berkeleyearth.lbl.gov/auto/Stations/TAVG/Figures/152027-TAVG-Raw.png
Again, I’m not sure when the Norah Heads station was opened.
But as you can see, not much warming a Norah. !
At that rate, the seas will boil in a million years!
Perhaps monthly pay of the employee recording the temperatures is why this looks like major monkey business with the “every month hotter than normal” NOAA GHCN data.
That is interesting to know.
Here are a couple other things you might like to know. The GHCN monthly database has 71 stations in 1900 and 68 in 2013. They peaked in 1975 with 499 stations. They also have no/none/zero Australian data for three consecutive months in 2011. September through November.
I guess since it is only one continent they feel they can ignore it whenever convenient.
For those not knowing where Nobbys is, it’s located at the entrance to Newcastle Harbour, NSW.
http://belledental.com.au/wp-content/uploads/2013/12/Aerial-view-of-Nobbys-lighthouse.jpg
In this second photo you can clearly see the Stevenson Screen sitting as proud as a pimple on your nose at the end of the headland.
http://www.lighthouses.org.au/lights/NSW/Nobbys%20Head/Nobbys%20Head%20wb%201.jpg
Nobbys is located approx. 12km’s to the north of my home.
Its a tough job, but someone has to do it.
Whilst everyone can see how beautiful Newcastle is, let’s just note that Nobbys beach is metres away from the worlds biggest coal exporting port.
We’re doomed….dooooomed I tell ya!
Bruce,
Thanks for the photos. Beautiful!
Here is another photo that shows the screen.
http://culturehunter.org/files/imagecache/original/images/dir/IMG_7490.JPG
One thing I have noticed regarding Nobbys and the BoM, up until around 18 months-2 years ago, Nobbys was part of the BoM’s ‘HQ’ network, now it’s not. The Newcastle ‘HQ’ station is now at Williamtown RAAF base.
Does anyone know where the site is at Williamstown ?
OK Griss, I think I found it.
Google Earth: Lat: 32°47’35.44″S; Long: 151°50’9.40″E
According to BoM’s ACORN-SAT Station Catalogue (page 107);
http://www.bom.gov.au/climate/change/acorn-sat/documents/ACORN-SAT-Station-Catalogue-2012-WEB.pdf
This site is an automatic weather station located at Williamtown airport, on the north eastern side of the runway (the RAAF base side). The instrument area surface is mown unwatered grass with longer grass surrounding.
History
There is little available documentation prior to the 1990s. A comparison site (061379) operated in the late 1990s in anticipation of a site move which never took place.
The automatic weather station was installed on 9 July 1999. There was a site move of about 250 m southwest on 15 February 2005. The old site continued as a comparison under the number 061407 but the comparison was terminated after a few months because development around the old site made it no longer representative of its former state, and the overlap data were not used to merge the sites.
First year of data – 1942
http://i255.photobucket.com/albums/hh154/crocko05/WilliamtownAWS_zpse4cebf53.jpg
Note to Steve: My first attempt to reply to Griss may be in your SPAM bucket, if so, please disregard it.
i can understand that, due to the accelerated rate of sea level rise it will be underwater in a matter of months from now,if not weeks 😉
I recently m9oved to NY State from the MN/WI area.
Back in MN, weather records occasionally cite record high and lows from “pioneer” dates (~1900 +- 30 yrs). Keeping tabs on weather records in NY State I noted that “official” record high and lows are exclusively from dates after 1950!). Given that records for NY state have go further back than MN, I find this questionable.
Do you have any thoughts on this or am I going to the wrong place for NY records?
When Jennifer Marohasy posted about Goddard’s initial findings on her blog, Steven Mosher commented in the thread in his trademark manner:
“nope. he did it wrong again.”
Since Berkeley Earth has the missing data I want to know:
What did Mosher know and when did he know it?
http://jennifermarohasy.com/2014/09/go-boldly-and-smash-all-preconceptions-steve-goddard/?cp=0#comment-564351
Ah, Mosher.
Hired as the paid mouthpiece for BEST.
Never as a scientist.
Yeah, I saw his comment as well. All class that Mosh…
Yet Another Mosher Drive By
He’s either too lazy to explain, or he’s too concerned about being called out when his explanation fails, or both. Since he’s still not using the shift key, there’s definitely laziness involved.
By James bull at WUWT one of the best quotes ever “Anyone want to go into the cat herding business, would be much easier than getting world agreement on climate policy.” hahahahaha
Both are easy.
For cats wave a smelly fish in front of their nose for Climastrologsts wave grant $$$$$$
It’s now ‘hide the incline’ (far into the past)!
They will just justify whatever it takes over at NOAA I guess ?!?
Thanks, Steve, for all your work.
Around the world these coastal lighthouses were often the earliest and most accurate data recorders because of the highly responsible tasks these govt employed keepers constantly performed and this long term data gives an accurate history of the true state of the climate [plus they are least affected by UHI].
A survey of all these w/w coastal stations, if it were possible, would be a fascinating look.
Yes, excellent suggestion. Also of course the coast location is very conducive to getting long term natural trends in those areas which often have brisk winds, meaning those thermometers record a far greater land area,
There’ll be no mention of the heat-wave of 1896 even if the headline said –
NEARLY 200 DEATHS FROM HEAT APOPLEXY.
ITS SEVERITY IN NEW SOUTH WALES.
BUSINESS SERIOUSLY INTERFERED WITH.
PEOPLE LEAVING BOURKE.
Report says it was 125°F in the shade.
But there are records http://trove.nla.gov.au/ndp/del/article/64889112
No standards back then, they just read the thermometer an believed it, no homogenization, no adjustments, no computer models, no BOM.
Geez, how primitive.
“Well, that’s the news from Lake Wobegon, where all the women are strong, all the men are good looking, and all the children are above average.” http://en.wikipedia.org/wiki/Lake_Wobegon
Lake Wobegon, where every month is hotter than the one before!