Disrupting the Borg is expensive and time consuming!
Google Search
-
Recent Posts
- “Why Do You Resist?”
- Climate Attribution Model
- Fact Checking NASA
- Fact Checking Grok
- Fact Checking The New York Times
- New Visitech Features
- Ice-Free Arctic By 2014
- Debt-Free US Treasury Forecast
- Analyzing Big City Crime (Part 2)
- Analyzing Big City Crime
- UK Migration Caused By Global Warming
- Climate Attribution In Greece
- “Brown: ’50 days to save world'”
- The Catastrophic Influence of Bovine Methane Emissions on Extraterrestrial Climate Patterns
- Posting On X
- Seventeen Years Of Fun
- The Importance Of Good Tools
- Temperature Shifts At Blue Hill, MA
- CO2²
- Time Of Observation Bias
- Climate Scamming For Profit
- Climate Scamming For Profit
- Back To The Future
- “records going back to 1961”
- Analyzing Rainfall At Asheville
Recent Comments
- Bob G on Climate Attribution Model
- Bob G on Fact Checking NASA
- arn on Climate Attribution Model
- Bob G on Climate Attribution Model
- Bob G on Climate Attribution Model
- Bob G on “Why Do You Resist?”
- Gerald Machnee on Fact Checking The New York Times
- Gerald Machnee on Climate Attribution Model
- Gerald Machnee on “Why Do You Resist?”
- arn on Climate Attribution Model
Hey Ho! Eight Inches Of Permanent Drought For Katherine
This entry was posted in Uncategorized. Bookmark the permalink.


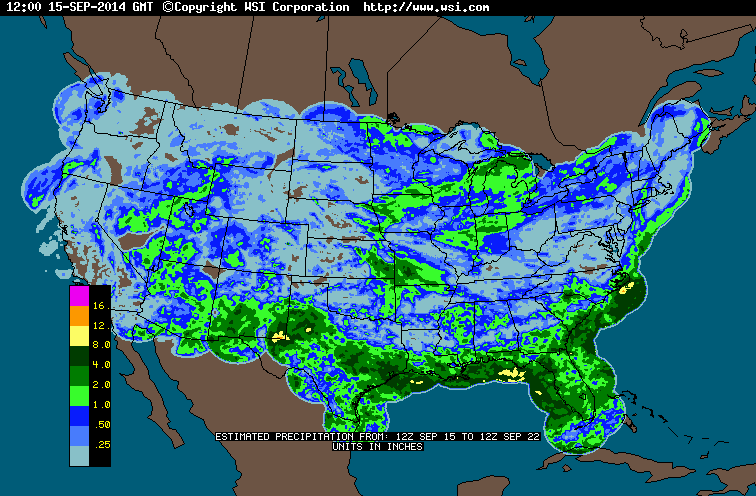
Lubbock is still categorized as being in a severe drought, despite receiving over 100% of its annual precipitation in 2014.
It must have been globally-weirded, CO2-induced dry rainfall.
Well yea… CO2 makes “dry” ice so all that extra Mann made CO2 in the atmosphere makes “dry” rain. Didn’t you learn that in school?
“dry rain”
Very good! Up there with extreme average, warm-cold, and drought-flood.
Permanent drought of reality.
14.5″ of rain between lubbock and midland in just under 3 hours. 100 miles west of there, lake j.b. thomas gained over 35′ – that’s FEET, folks – in O-N-E day. It went from 1% capacity to half-FULL. Near an oil lease I operate, the Pecos river will be flooding out of its banks for weeks. 250 miles from that lake, another has added many thousands of acre-feet of water. Pecos Texas is under water with homeland security & ICE picking up illegals and oilfield crews bobbing around in the water like cow pies. Nothing like this has happened out here in over 35 years and certainly not during ‘severe drought.’ Well, except for when that other hurricane’s week-long rains half-filled lake o.h. ivie, just after the dam was finished in the early 90’s, or when it happened as yet another hurricane flooded the lakes in the very late 70’s with week-long rains – big rains for a couple of years, iirc… or when that big hurricane hit the gulf coast just befire 1970 and traveled up into west texas flooding everything in sight for 2 weeks, or when the rio grande flooded big-time early in this century due to a hurricane as well, filling lake amistad. Hmm, every ten years or so. Almost like clockwork.
Must be a global warming ‘Texas rain clock.’ During severe, decades-long drought cycles? Or it could just be the per usual, el nino / la nina southwest weather cycle, Mann.
The humidity in midland is about 95-100% and has been for many days now. Starting to feel like vietnam around here – where john kerry rode around in a boat, and algore sat on his helmet back in the days before ketchup and coal, respectively, made them very wealthy. And climate ex-spurts.
Every ten years or so… Solar cycle?
The timing of El Nino in relation to the solar cycle and Clam fossils study reveals 10,000 year history of El Niño
(very controversial subject)
Hi Gail,
From my understanding of ENSO
El Nino – US experiences floods (hurricanes) and Australia experiences severe drought
La Nina – US experiences severe drought and Australia experiences floods (cyclones)
Reconciling your chart with the ENSO/solar cycle with the old Aussie newspapers
Year ENSO Australia USA
1890’s El Nino 7 yr drought floods
1910 La Nina floods drought
1915 El Nino drought floods
1930 La Nina floods drought (Grapes of Wrath)
1941 El Nino drought floods
1970’s La Nina floods drought
1980-90’s El Nino drought floods
2010/11 La Nina floods drought
In 1895, one of Australia’s first scientists, HC Russell, understood the periodicity of drought and floods, and explained it based on his knowledge at that time. I especially like the anecdotal evidence for Europe in the middle ages.
http://trove.nla.gov.au/ndp/del/article/20449575
I haven’t yet seen a chart for 20th century of Australian cyclones (frequency), but if I get one, I’ll post it. It will likely match ENSO, at least for Australia.
Hi Steve
This appeared in the UK Daily Mail yesterday
http://www.dailymail.co.uk/news/article-2764716/Dams-not-reached-water-boats-crowded-dried-reservoirs-rapidly-shrinking-lake-levels-Extraordinary-images-highlight-devastating-impact-drought-having-West-forecasters-say-going-continue.html
Not much support for AGW in the comments.
That’s what happens when you allocate 150% of the average water to uses.
But that is government. In times of plenty, they over allocate. In times of scarcity, they cry about poor management – their own.
Phil,
Californicate is doing its best to rectify the situation by driving out businesses by the droves. The workers are following. We had all the fruits and nuts contained but now the Progressive Disease is spreading to surrounding states like Texas…..
True. However not only the smart are leaving, the leeches are as well.