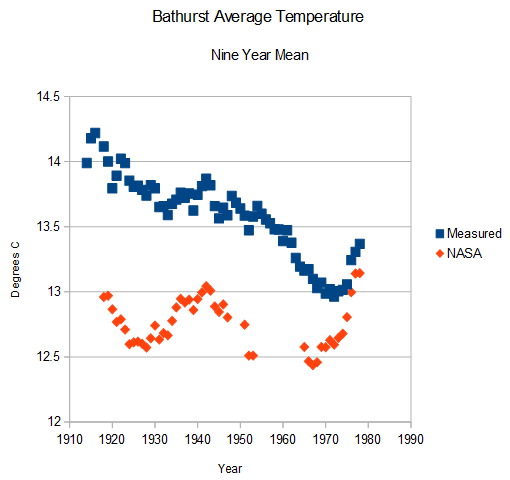
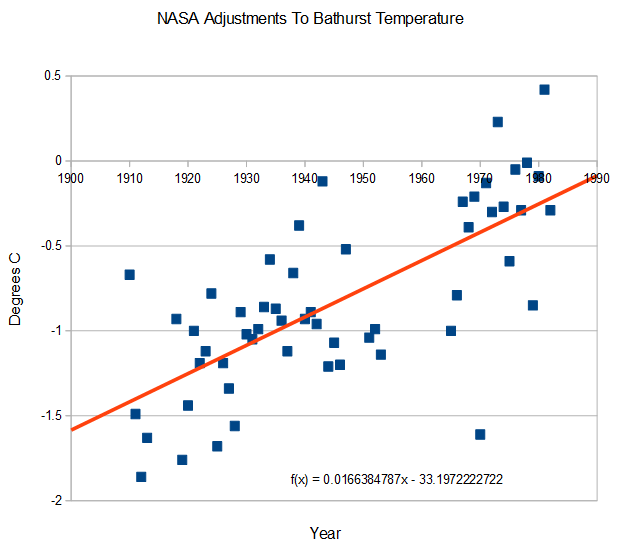
GHCN thermometer data shows Bathurst cooling 1.3C/century from 1910 to 1983, yet NASA shows Bathurst warming by 0.3C/century over that same period (using the same thermometer data.)
They accomplish this through an impressive hockey stick of data tampering.


A nice acknowledgement from Jennifer Marohasy
http://jennifermarohasy.com/2014/09/go-boldly-and-smash-all-preconceptions-steve-goddard/
Readers should note that this is the Bathurst in central New South Wales, not the other Bathurst (now known as Banjul) which is the Capital of Gambia in West Africa.
I read somewhere that the algorithm the (NASA/BOM et al) use for the adjustment is based on the atmospheric CO2 measurements. So the tail wagging the dog. Peer reviewed of course.
That would mean there would be a high correlation between temp adjustments and the CO2.
I think you may have charted that already Steve. If not, it might be interesting.