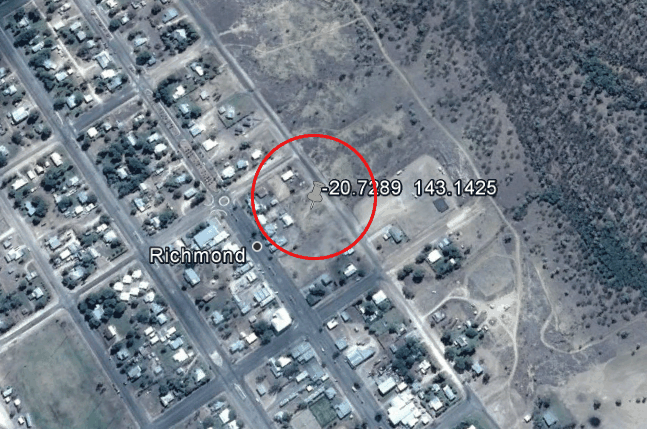
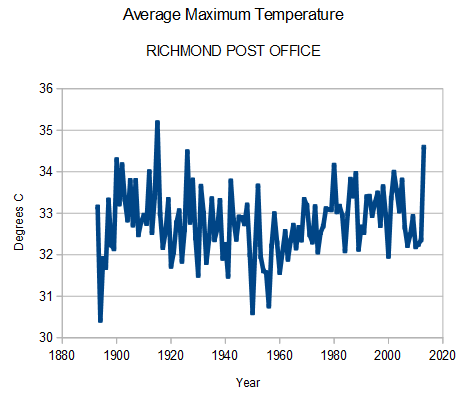
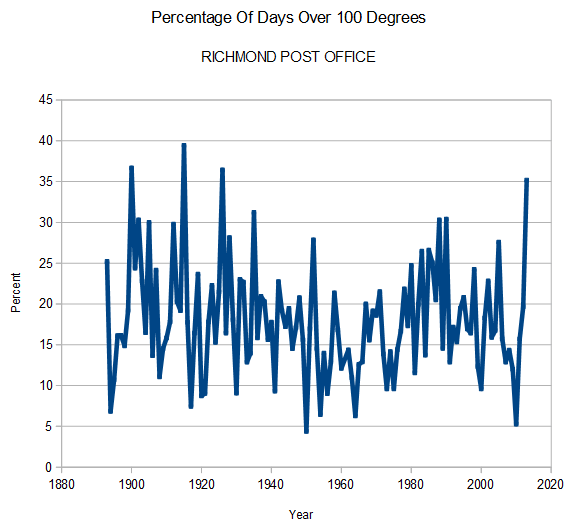
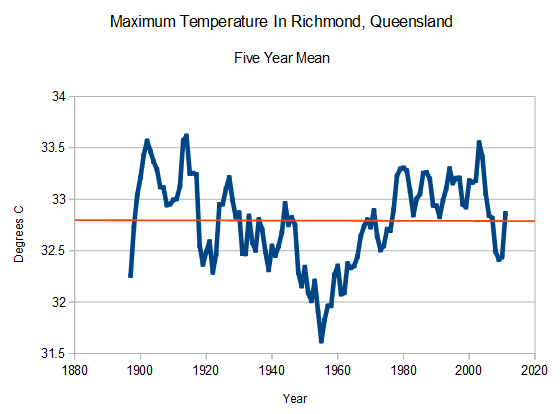
The Richmond Post Office thermometer is close to several roads, but better than most. It shows that afternoon temperatures peaked in the early part of the 20th century, and have generally been declining ever since.
ASN00030045 -20.7289 143.1425 211.1 RICHMOND POST OFFICE


Gees, good thing you found data before 1960 😉
Wonder if BOM “homogenises” the pre-1960 temps to match the slope of the post 1960.
Gaia hates people. That explains the difference between rural and urban UHI.
Lets see- the world was getting colder from the early 40’s to the mid 70’s, then warmer until about 1998 then the temp remains the same.
Over a 70 t0 75 year period about 25 years show warming, all while CO2 is increasing.
25 our of 75, good enough for me. I do not like cold winters 🙂
Interesting comment in BoM’s ACORN-SAT catalogue (page 87);
http://www.bom.gov.au/climate/change/acorn-sat/documents/ACORN-SAT-Station-Catalogue-2012-WEB.pdf
The only known station move was one of 30m in September 1965. New screens were known to have been supplied in December 1928 and September 1991; the screen in use in September 1944 was reported to have had an iron roof.
What matters is WHAT COLOR that roof was. I have an old civil war vintage house on my property with a tin roof. It is quite cool compared to outside. Also the ‘iron roof’ probably refers to what we call a tin roof or a galvanized roof.
A properly installed, tin (or iron…usually a galvanized steel and corrugated) roof, of a light color (natural…the light galvanized grey, white or the silvery aluminumized paint) can be quite cool. Besides being very durable.
Metal roofs are nice but more expensive than shingle and have to be done properly to channel the inevitable condensation that forms on the inside surface. If you live in hail country your asking for it if you don’t buy the heavy gauge.
There is absolutely no sign in the data that this affected the temperature recorded.
The one change point is around 1960, same as in many Australian site.
Somewhere, some leftist is thinking we need common-sense thermometer control.
Put them in a “lock box”.
Aussie statistician/mathematical modeller Dr David Stockwell has “run a ruler” over this temperature trend, in particular looking for discontinuities/breakpoints. He has found one in circa 1970, but even correcting for this, as ACORN-SAT appears to do, there is no long term warming trend. Good stuff, Steve Goddard.
I guess the BOM hasn’t gotten around to adjusting this station yet.
Hey Chuck, The BOM have remodelled the data for this station. Steve is showing you the ‘raw’. You can download the remodelled/homogenised from here… http://www.bom.gov.au/climate/change/acorn-sat/#tabs=Data-&-network.
They have dropped down the Max from about 1970 through to 2000, and the Min from about the beginning through to 1950. I don’t have a published chart to show you.
Cheers,
The raw minimum temperature trend would be interesting, much less influenced by changes in enclosures than the maximums.
Upside-down “40’s spike”, displaced a few years.