Most of the US is cooling dramatically, and has been for 80 years. That is why NCDC and NASA make their massive downwards adjustments of the past – to hide the decline in US temperatures.
Disrupting the Borg is expensive and time consuming!
Google Search
-
Recent Posts
- Analyzing The Western Water Crisis
- Gaslighting 1924
- “Why Do You Resist?”
- Climate Attribution Model
- Fact Checking NASA
- Fact Checking Grok
- Fact Checking The New York Times
- New Visitech Features
- Ice-Free Arctic By 2014
- Debt-Free US Treasury Forecast
- Analyzing Big City Crime (Part 2)
- Analyzing Big City Crime
- UK Migration Caused By Global Warming
- Climate Attribution In Greece
- “Brown: ’50 days to save world'”
- The Catastrophic Influence of Bovine Methane Emissions on Extraterrestrial Climate Patterns
- Posting On X
- Seventeen Years Of Fun
- The Importance Of Good Tools
- Temperature Shifts At Blue Hill, MA
- CO2²
- Time Of Observation Bias
- Climate Scamming For Profit
- Climate Scamming For Profit
- Back To The Future
Recent Comments
- Bob G on Analyzing The Western Water Crisis
- Bob G on Analyzing The Western Water Crisis
- Bob G on Analyzing The Western Water Crisis
- arn on Analyzing The Western Water Crisis
- Scott Allen on Analyzing The Western Water Crisis
- conrad ziefle on Analyzing The Western Water Crisis
- conrad ziefle on Analyzing The Western Water Crisis
- Bob G on Analyzing The Western Water Crisis
- Bob G on Analyzing The Western Water Crisis
- Bob G on Gaslighting 1924

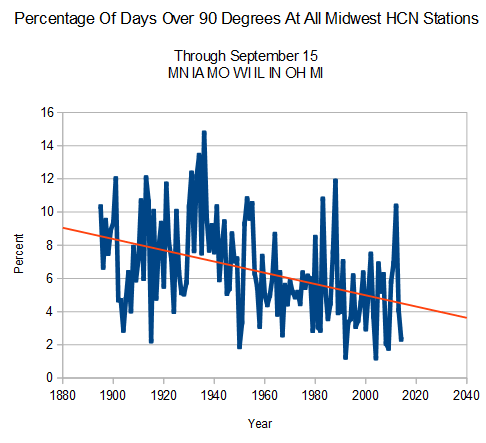
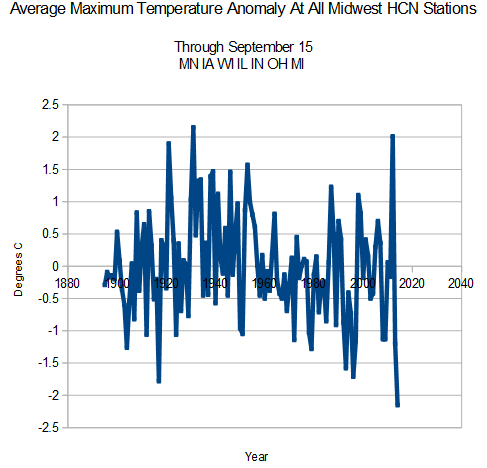
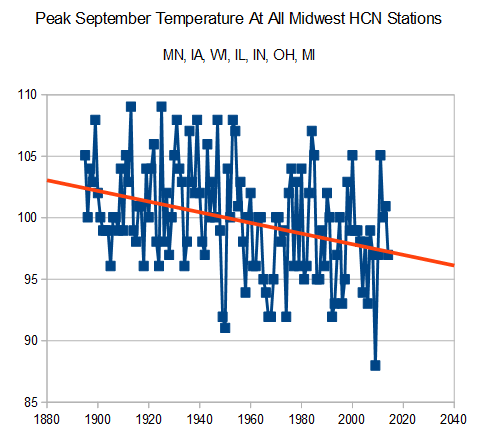
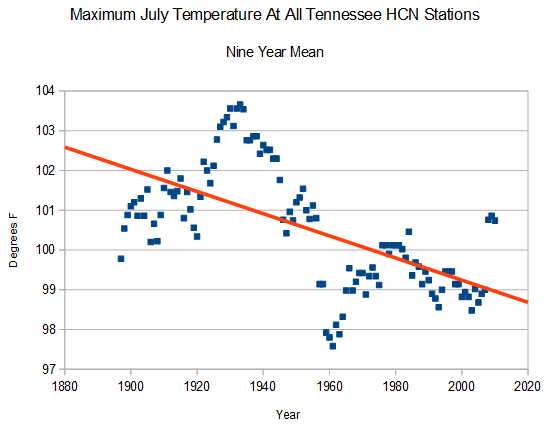
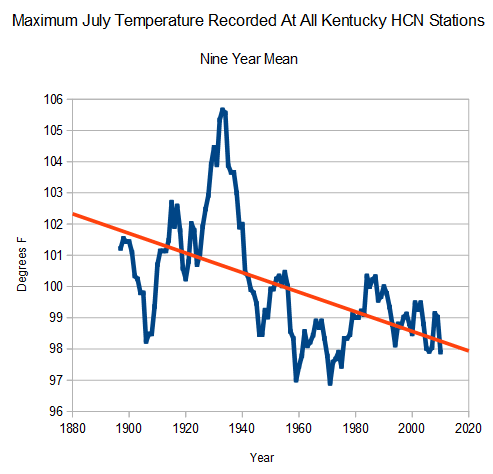
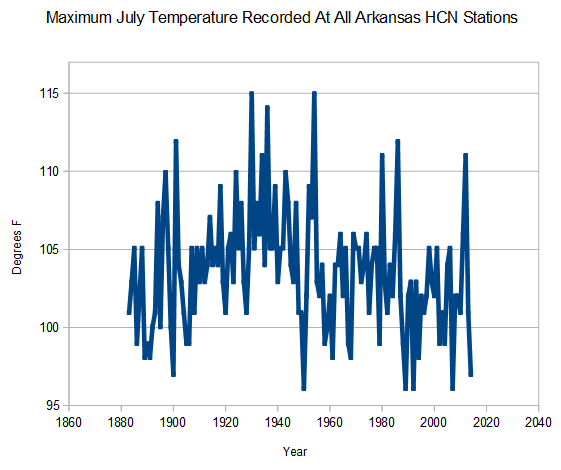
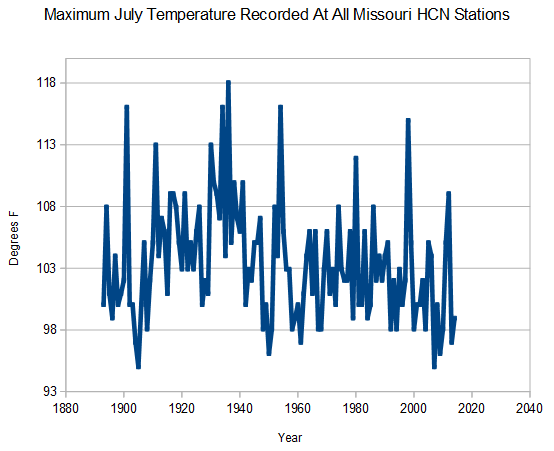
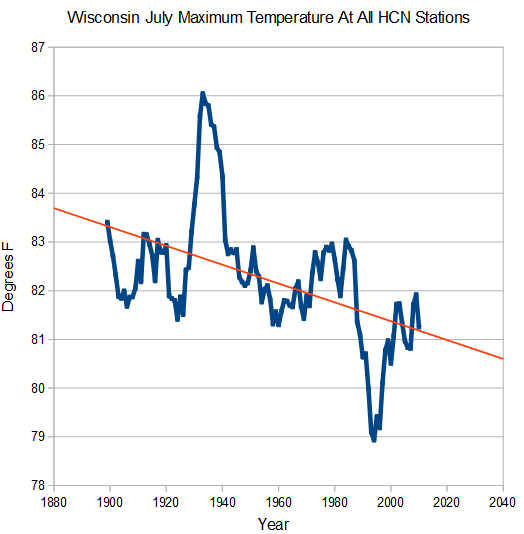

But they are rotten temperatures. Once they are “healed”, they will look much better. Just ask gavin.
What’s clear is you didn’t use the unadjusted adjusted data. You must adapt your data. 🙂
Raw data, like raw milk is evil…it must be Gavinized, homogenized and other wise ‘ized’.
Ummm….they were hoping that no one would notice…
If you plot the minimum temperatures vs the maximum temperatures for the same records do you see the UHI signal?
At about -1°F per 30 years or so over about 80 years.
This is great info Steve. Now, if temperature variation / standard deviation is stable, and normal, and the % of 90°F days was 8% in 1880, and now it is 4.6%, we could also say that the temperature has dropped by 0.28 standard deviations. So if you calculate the std dev of those midwest temps (only the deviation from the trend) and multiply by 0.28, this should give you the number of degrees that the upper end of the temperature has dropped, all else being the same… Now you could do this again with temperatures above 80, 70, and so on and describe the movement of the distribution in another way. I think it could be another way to show that the adjustments made are totally bogus.