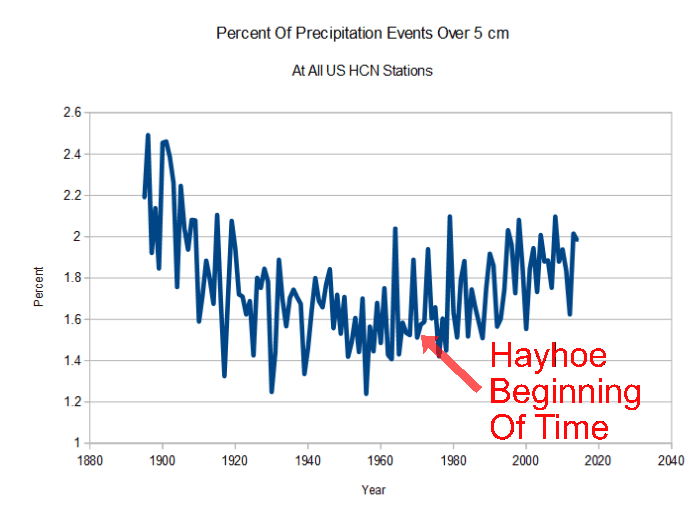
Katherine Hayhoe is not your ordinary young Earth creationist. Most of her graphs start around 1970. Here is why.
Disrupting the Borg is expensive and time consuming!
Google Search
-
Recent Posts
- “Why Do You Resist?”
- Climate Attribution Model
- Fact Checking NASA
- Fact Checking Grok
- Fact Checking The New York Times
- New Visitech Features
- Ice-Free Arctic By 2014
- Debt-Free US Treasury Forecast
- Analyzing Big City Crime (Part 2)
- Analyzing Big City Crime
- UK Migration Caused By Global Warming
- Climate Attribution In Greece
- “Brown: ’50 days to save world'”
- The Catastrophic Influence of Bovine Methane Emissions on Extraterrestrial Climate Patterns
- Posting On X
- Seventeen Years Of Fun
- The Importance Of Good Tools
- Temperature Shifts At Blue Hill, MA
- CO2²
- Time Of Observation Bias
- Climate Scamming For Profit
- Climate Scamming For Profit
- Back To The Future
- “records going back to 1961”
- Analyzing Rainfall At Asheville
Recent Comments
- Gordon Vigurs on Climate Attribution Model
- arn on Climate Attribution Model
- Bob G on Climate Attribution Model
- arn on Climate Attribution Model
- arn on “Why Do You Resist?”
- conrad ziefle on Climate Attribution Model
- arn on Climate Attribution Model
- arn on Climate Attribution Model
- Bob G on “Why Do You Resist?”
- conrad ziefle on “Why Do You Resist?”


She was born that year! See? 🙂
Born that year, stuck on stupid!
These claims of recent heavy precipitation events in the US must be very carefully evaluated in terms of “time of observation bias”. During this time frame, the measurements at many stations were moved from late afternoon to early morning.
Since a large percentage of heavy precipitation events are late afternoon thunderstorms, the old time tended to split many of them into two days of lesser precipitation. Now, that’s not so.
Because as the song at the beginning of the 1970s said –
5TH DIMENSION Age Of Aquarius Lyrics
Ya, man you’d gatta be there to dig the fab grooves goin’ down!
Well, there’s a deep pit in 1958 on your graph, and I am amazed that she didn’t fall into it with her attempts to harvest cherries.
Ah, she did:
Curiously, she uses “the risk” of events as the increase, not the events themselves.
The cherry picking includes the National Climate Assessment, of course.
===|==============/ Keith DeHavelle
Its not Hayhoe… its …. ho, hum !