“There is less than a 1-in-27 million chance that Earth’s record hot streak is natural”
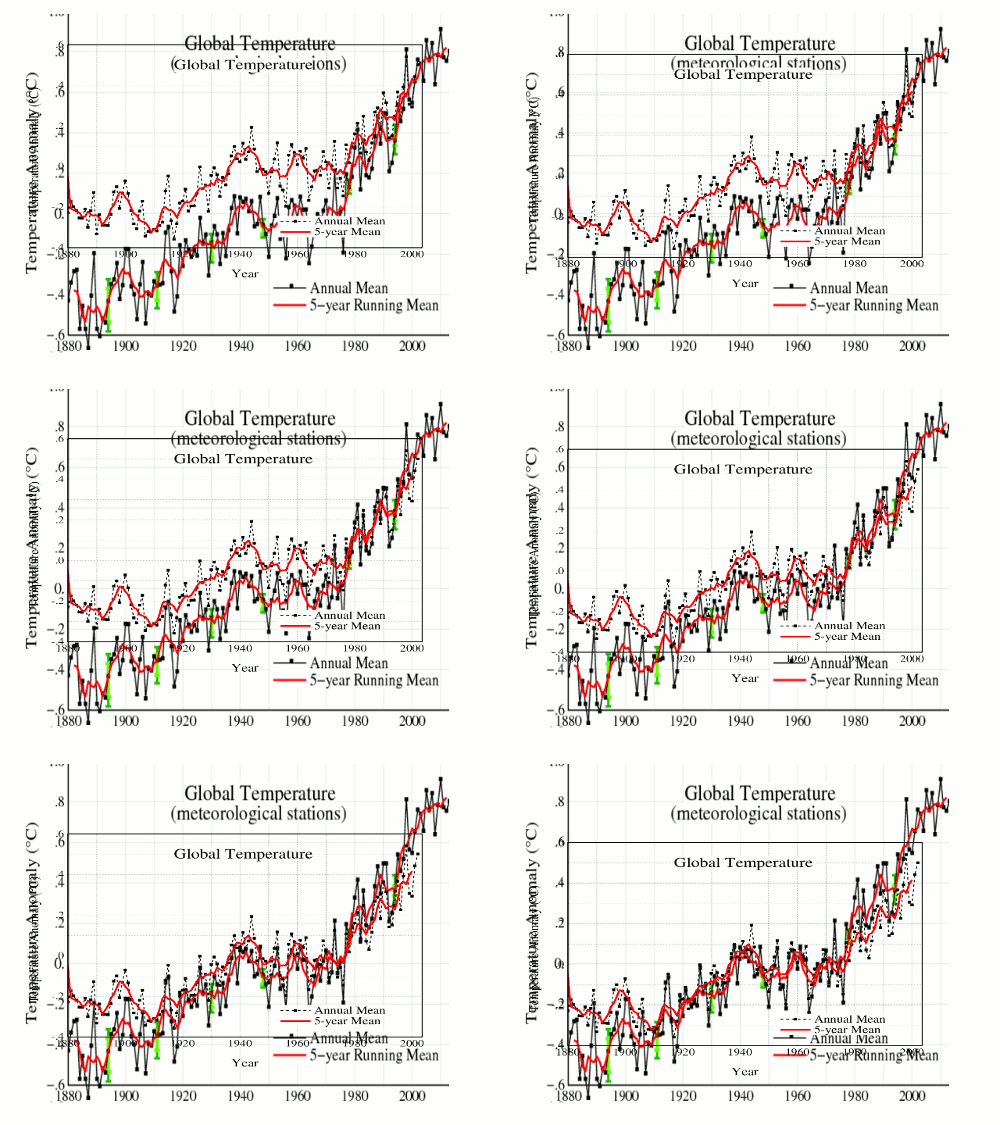
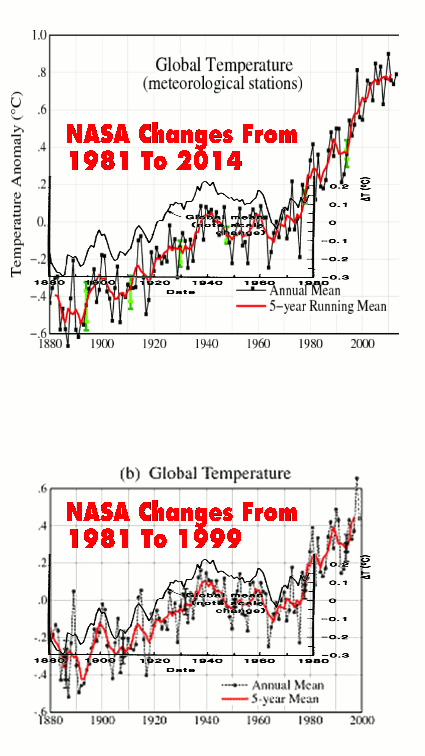
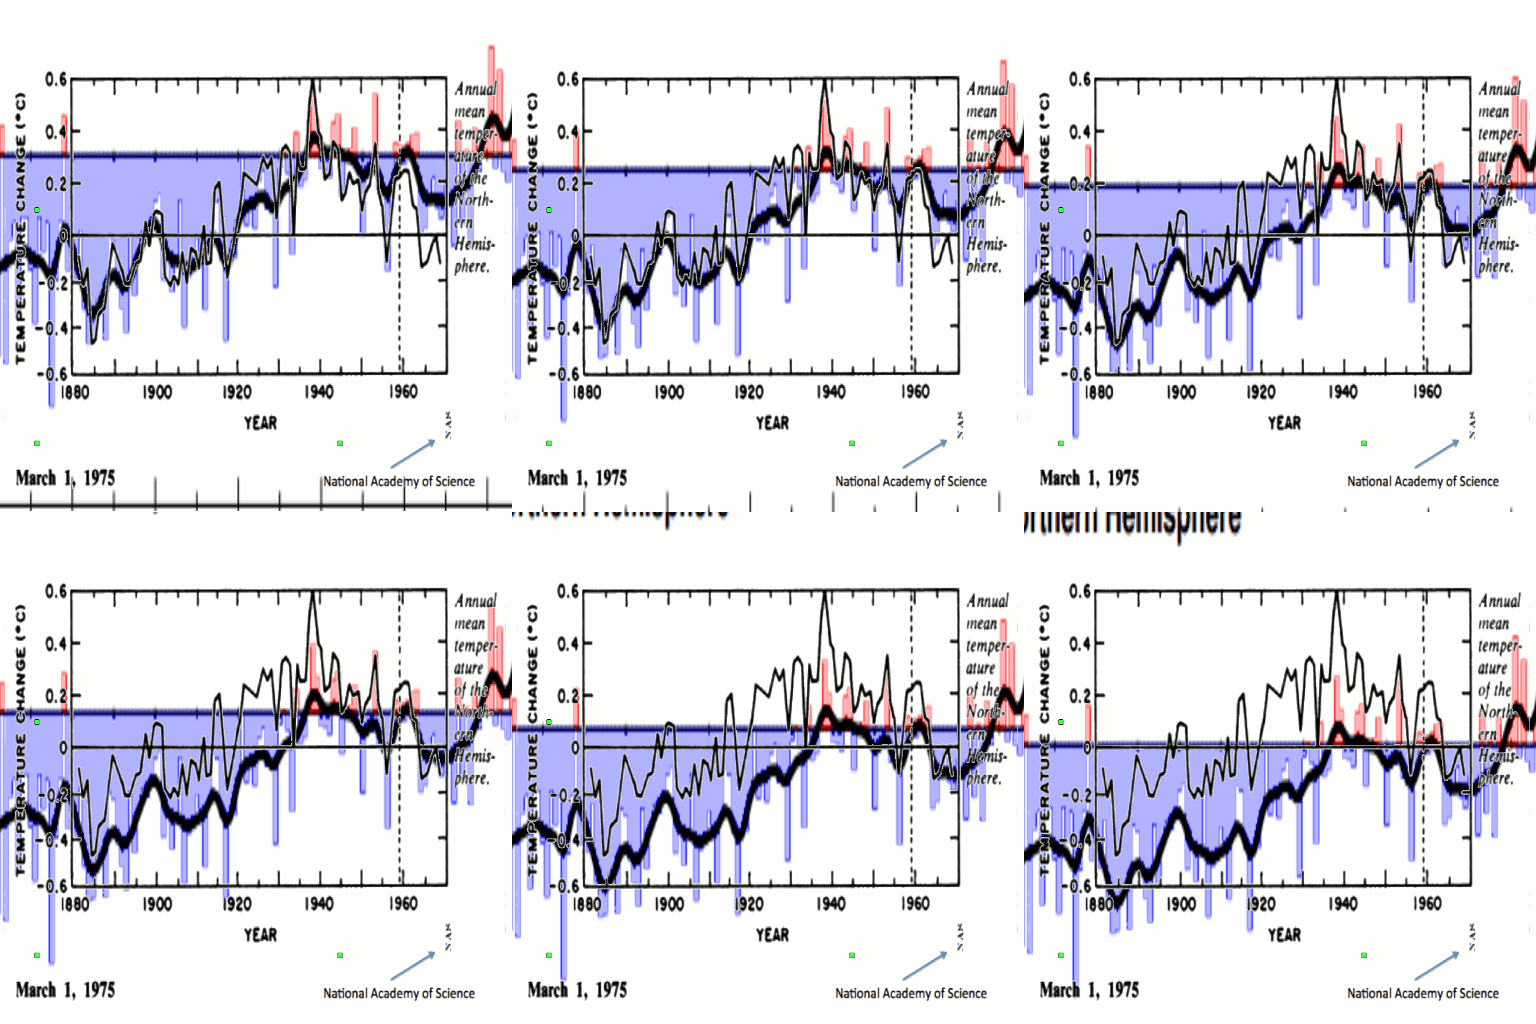
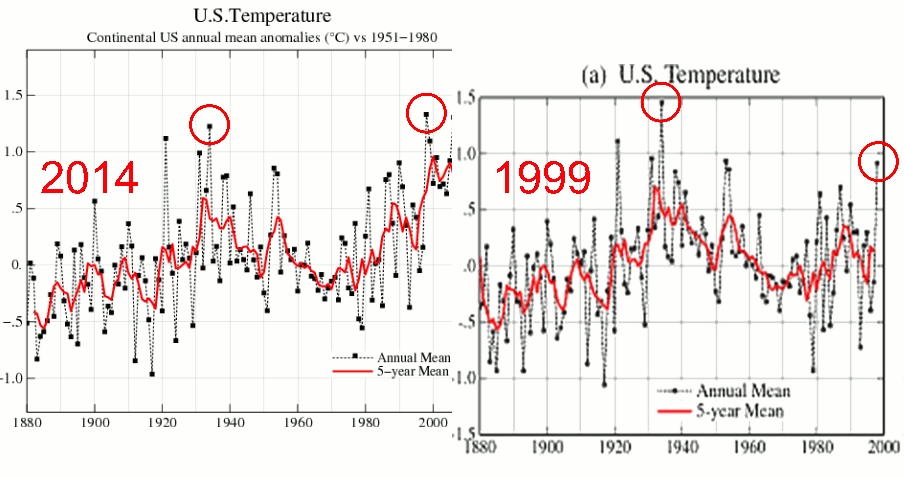
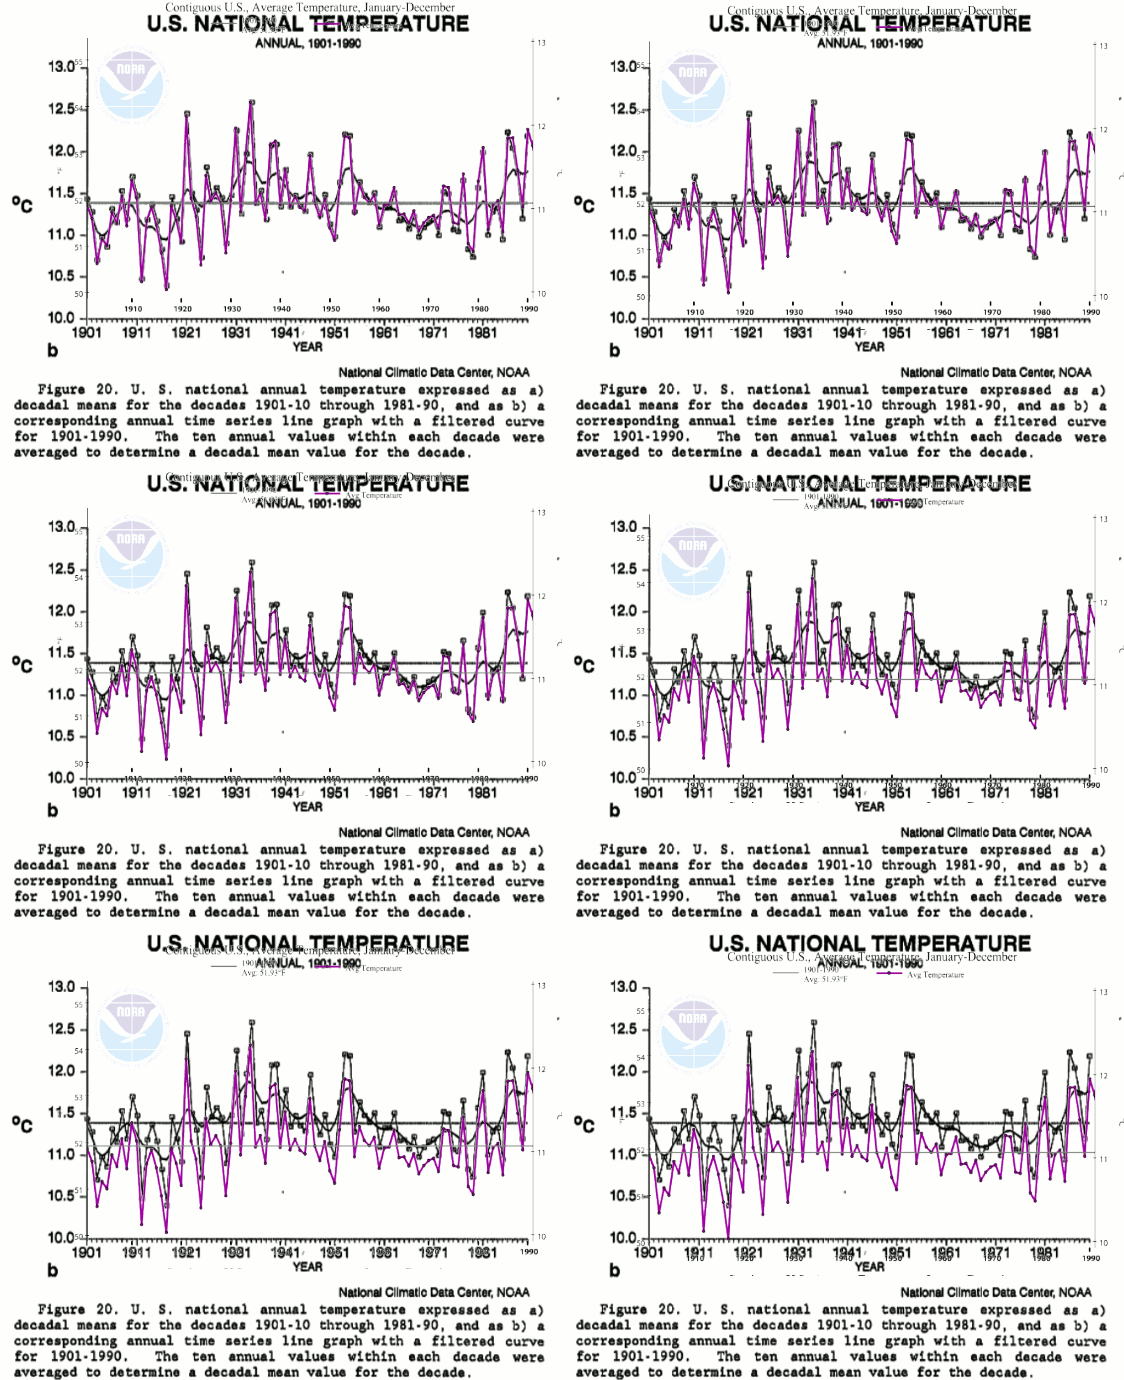
I am completely in agreement. The “record hot streak” is undoubtedly Mann-made – by the people who work at NCDC, CRU and GISS. Each of the animations below show how the past has been cooled and the present warmed in official government graphs, as time progresses.
Essentially all global warming since 1940 is due to data tampering by a small handful of Climategate personalities.
Changes to GISS surface temperature from 2003 to 2014
Changes to GISS surface temperature between 1981 and 1991, and between 1981 and 2014
Changes to Northern Hemisphere surface temperature between the 1975 National Academy of Sciences Report, and current CRUTEM
Changes to GISS US temperatures between 1999 and 2014
Changes to NCDC US temperatures from 1991 to 2014
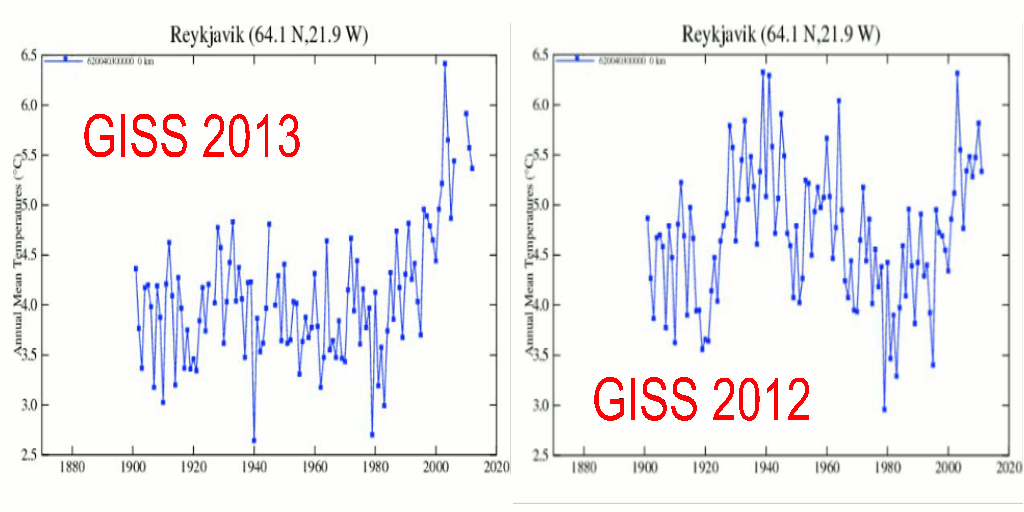
Changes to GISS Iceland temperatures between V2 and V3
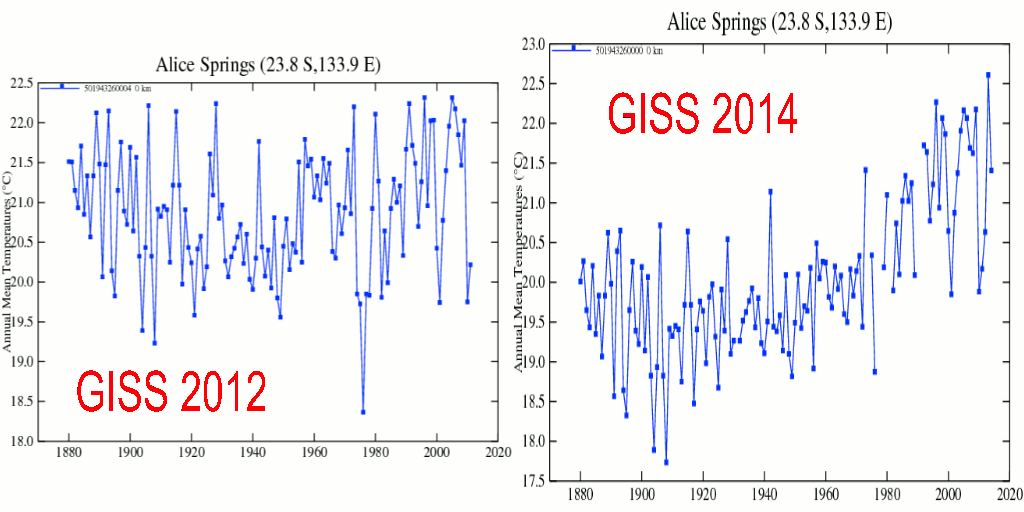
Changes to GISS Alice Springs temperature between V2 and V3



These Experts Are Propaganda Artists Working for FOOLS, ABSOLUTE FOOLS
The internet played a major role in exposing wannabe world tyrants as fools who tried to hide the source of energy that destroyed Hiroshima . . .
and ended up blinding themselves to the Alpha and Omega – the Creator, Destroyer & Sustainer of every atom, living cell and world in the entire Solar System – FOOLS, ABSOLUTE FOOLS !
Now the public has no choice but to replace these fools and their armies of “scientists” who used public funds to deceive the public:
See: “Solar energy,” Adv. Astronomy (submitted for on-line review, 6 Jan 2015)
https://dl.dropboxusercontent.com/u/10640850/Solar_Energy_For_Review.pdf
Senator Cruz may be seriously trying to salvage NASA:
http://www.cruz.senate.gov/?p=press_release&id=2077
It may be too late now that Russia again controls space.
If the assassination of President John F. Kennedy in 1963 was the key to restoration of Russian control of space
– as first happened with the USSR’s launching of Sputnik in 1957, and
as is obvious every time the USA now uses Russian rockets in 2015, –
then Senator Ted Cruz will face great difficulty in re-establishing NASA’s space program.
On a related note:
http://www.thedailybeast.com/articles/2014/06/22/why-does-the-usa-depend-on-russian-rockets-to-get-us-into-space.html
Thanks, Karl.
1. One conclusion of my research is beyond the scariest scenario I could have imagined: The UN’s Agenda 21 in action, worldwide.
2. Another conclusion is reassurance that world leaders and their puppet scientists have only Delusions of Grandeur !
The pulsar-centered Sun controls every atom and living cell in their bodies.
Here’s a link to UN Agenda 21
Politically correct thinking and the lock-step consensus “science” that now plagues society can be traced back to a 1972 document that the UN adopted almost immediately after Kissinger secretly flew to China and agreed to end the Apollo program in exchange for a new world-wide peace agreement:
United Nations Agenda 21
http://habitat.igc.org/agenda21/index.htm
Leaders of Russian, American, Asian, African and European nations have the opportunity to show they are NOT working behind-the-scenes to use science as a propaganda tool to control the public by asking leaders of their National Academies of Sciences to publicly address nine pages of precise experimental data that falsify the Standard Solar and Standard Nuclear Models they uniformily endorsed earlier:
“Solar energy,” Adv. Astronomy (submitted for on-line review, 6 Jan 2015)
https://dl.dropboxusercontent.com/u/10640850/Solar_Energy_For_Review.pdf
Nicely done Tony! Catching that Freudian Slip, and related data fraud, is a priceless
He who controls etc
Yes, “He who controls space controls planet Earth” http://en.wikipedia.org/wiki/International_Space_Station
It was ROARING HOT during the 1890!
This cooling down of the past is so irritating. But then I had this discussion last night with a Vermont woman liberal where I told her, it is getting colder and colder up here and we are in trouble thanks to global cooling.
“it is hot in CALIFORNIA!’ she cried. ‘And Australia!’ ‘But not HERE,’ I pointed out to her. ‘Or 80% of the entire North American continent’.
She made a sneering face, probably thinking I was a stupid ‘denialist’ and thus, ‘insane’. And then stepped out into the severe cold barely above zero.
It is not even hot in California, they just quit using the thermometers in the mountains and do ‘Kriging’ from the beaches and deserts!
5 March 2010 It’s Cold, Just Ask The Tomatoes
The Tomato Knows
E.M. makes the comment:
” It happened a few decades back too. I have foggy memories of “ask for a tomato” on your Burger King and “no tomato salad bars”.
I want to clarify what actually happened. It had nothing to do with temperature and everything to do with politics. (so what’s new)
The actual problem was e-coli infected tomatoes and other veggies coming up from Mexico had their labels switched. (Source: Truck Driver who saw it happening and was threatened with having his license yanked when he tried to report it to DOT.)
The Mexican veggies were grown where a cave was used both for sewage disposal and for drinking water. This lead to a e-coli food poisoning outbreak. Since the US government had been trying to get a version of the Food Safety Modernization Act passed since 1996, the Florida tomatoes growers were blamed and had to destroy their entire crop. They later did the same to Texas and California over salmonella. US farmers got the blame in MSM Headlines while Mexico got nailed in fine print in some USDA/FDA/CDC documents months later after the US crops were destroyed. Sound familiar?
Most of the links are long gone but here are a couple.
https://www.stormfront.org/forum/t497125/
http://www.freerepublic.com/focus/f-news/2048945/posts
But then, why is it called GLOBAL warming if its only regional? Its only regional that matters. That really frustrates them.
We’ve had couple of hot days this summer after a very nice Spring.
The BOM keep saying Australia is doomed but no Aussies have yet died from Climate Change. That may happen this winter when poor people are forced to turn off the heat because idiots have made energy so expensive here with their carbon regulations.
At this rate, the 1880s will be a devastating ice age.
I do hope the original data has not been destroyed, else those who want to apply genuine science to this study (a long, long time in the future, I suspect) will be well-snookered.
Some attempts are being made to salvage the data:
http://wattsupwiththat.com/2014/01/06/the-original-temperatures-project/#comment-1526859
http://hidethedecline.eu/pages/posts/the-atmospheres-ability-to-accumulate-co2-declined-since-1978-241.php
Anything to do with SRM and geoengineering?
Temperatures should be adjusted downwards due to larger cities, less trees. But instead they are adjusted upwards, and even with adjusting it upwards it hasn’t even warmed for 18 years with the “Adjusted temperature of earth” with no error bars
But according to the Temperature of Earth line, this should have been a devastating Ice Age http://www.bom.gov.au/lam/climate/levelthree/c20thc/drought1.htm
The earth is certainly not going to warm catastrophically for another 65 kyr.
The Holocene interglacial is now 11,717 years old. That’s two centuries or so beyond half the present precession cycle (or 23,000/2=11,500). So the little Ice Age was about the right time for glaciatial inception. However we had the Modern Grand Solar Minimum – A History of Solar Activity over Millennia
Will the earth descend into glaciation or be a ‘‘double precession cycle’’ interglacial? That is still being argued although the above paper carries a lot of weight. A newer paper from the fall of 2012 a href=”http://www.clim-past.net/8/1473/2012/cp-8-1473-2012.pdf”>Can we predict the duration of an interglacial? agrees and gives the calculated solar insolation values @ 65N on June 22 for several glacial inceptions:
Current value – insolation = 479W m?2 (from that paper)
MIS 7e – insolation = 463 W m?2,
MIS 11c – insolation = 466 W m?2,
MIS 13a – insolation = 500 W m?2,
MIS 15a – insolation = 480 W m?2,
MIS 17 – insolation = 477 W m?2
(Changes near the north polar area, about 65 degrees North, are considered important due to the great amount of land. Land masses respond to temperature change more quickly than oceans.)
You can see why there is an argument. Solar insolation isn’t a cut and dried measure for glacial inception. Steve BTW thinks the Holocene will go long. Autumn and winter are occur at the closest approach of the earth to the sun for the northern hemisphere, the earth is moving at its maximum velocity and autumn and winter are shorter than spring and summer. This is the reason for the debate.
Of interest is a possible link between Solar Minimums and greater volcanic action.
Volcanic eruptions and solar activity
(wwwDOT)researchgate.net/publication/23818479_Volcanic_eruptions_and_solar_activity
Sun/dust correlations and volcanic interference
(wwwDOT)mendeley.com/research/sundust-correlations-volcanic-interference/
The Role of Explosive Volcanism During the Cool Maunder Minimum
adsabs(dot)harvard.edu/abs/2002AGUFMPP61A0298A
Study of Dust in Ice Cores Shows Volcanic Eruptions Interfere with the Effect of Sunspots on Global Climate
(wwwDOT)buffalo.edu/news/releases/2002/06/5735.html
Sun’s Activity Linked to Largest Earthquakes and Volcanoes by John Casey
cafe368(dot)daum.net/_c21_/bbs_search_read?grpid=1FBty&fldid=N0WJ&datanum=1898&contentval=&docid=1FBtyN0WJ189820100616141523
A little more about the point of debate:
Autumn and winter are occur at the closest approach of the earth to the sun for the northern hemisphere, the earth is moving at its maximum velocity and autumn and winter are shorter than spring and summer.
This is ih the SWAG catagory.
One of my long ago geology courses brought up the point that it wasn’t the COLD that cased glaciation but the amount of snow in the winter that did not melt in the summer.
Since it is the Norther Hemisphere that develops the great ice sheets that is what we want to look at.
Colder usually means drier. It just can’t snow much when the air is very very cold. That is why Antarctica is the driest place on earth.
You need sunlight/warmth to cause the air to suck up moisture and then you need cold air to form snow. If you look at this winter and last winter you have the ‘Polar Vortex’ bringing very cold air down from the arctic. However you also have the ‘loop’ in the jet stream bringing warm moist air up from the equator. When the two meet you get a major dump of snow causing the Greek islands to be buried under 6½ ft (2 m) of snow Another example is last winter when Scotland’s mountains got up to 50 feet of snow and almost 300 “snow patches” remaining in Highland mountains forming compacted, dense, ice hard snow called neve, which is considered the first stage in the formation of glaciers.
Or in 2012, Endless Winter for Alaska’s Mountains
(wwwDOT)accuweather.com/en/weather-news/endless-winter-for-alaskas-mou/68876
Next you need cool summers. At this stage the earth is farthest from the sun during the Northern Hemisphere summer. However the summers are longer.
There is another factor everyone ignores and that is the sea ice in the Antarctica.
The Humboldt Current that goes up the coast of South America turns West before it reaches the equator this is part of the dynamics of ENSO and whether an El Nino will form. The Humbolt current “is a cold, low-salinity ocean current that flows north along the west coast of South America from the southern tip of Chile to northern Peru.” (WIKI)
“The Benguela Current is also augmented somewhat by the West Wind Drift, a current which flows easterly around Antarctica. As the West Wind Drift flows past Cape Horn, that part in the immediate vicinity of the cape is called the Cape Horn Current. This current rounds the cape and flows in a northerly and northeasterly direction along the coast of South America as the Falkland or Malvinas Current“
CHAPTER 31 OCEAN CURRENTS: TYPES AND CAUSES OF CURRENTS (Maritime Safety Information good map of currents)
msi(DOT)nga.mil/MSISiteContent/StaticFiles/NAV_PUBS/APN/Chapt-32.pdf
The Antarctic Circumpolar Current ( West Wind Drift), by far the world’s strongest, is a wind driven current and it is the only one that connects all ocean basins. Sea ice narrowing both Drake Passage and the passage at the tip of Africa could have major effects on how the winds interact with the ocean and therefore the cold water currents running up the coast of South America and Africa. This in turn could effect ENSO (El Nino) and the gulf stream in the Atlantic.
These papers shows why we need to pay attention to what is happening with Antarctic sea ice and not the Arctic.
Research on Drakes Passage today:
Drake Passage and palaeoclimate
Research on Drakes Passage today: http://climate.gmu.edu/research/drake.php
Earths orbital eccentricity is close to it’s minimum. Currently the earths axial tilt is at about 23.45 deg down from 24.5 degrees just 1,000 years ago. So earths tilt is still near it’s maximum. Precession is thought to be the most important influence on Earth’s climate and currently Earth is closest to the Sun during the Northern Hemisphere winter (IOW right now) and furthest away during the Northern Hemisphere summer.
Currently only one of the three conditions which are though to have led to the onset of glaciation during recent geologic time exists. That is Perihelion during Northern Hemisphere winter.
Recent Ice Core data indicates that the interglacial period 400,000 years ago closely matches the conditions of our own interglacial period and that warm spell lasted 28,000 years ago. So it may just be that we still have about 16,000 years of relatively warm climate to come. But who the hell really knows?
As I said there is a lot of debate by the Quaternary Scientists over the subject.
Chronis Tzedakis, in an exhaustive look at the MIS-1/MIS-11/MIS-19 conundrum (Tzedakis, 2010, The MIS 11 – MIS 1 analogy, southern European vegetation, atmospheric methane and the “early anthropogenic hypothesis”, Climate of the Past, vol. 6, pp 131-144, European Geosciences Union) said this about the:
Do you have links to the data that make these graphs? I am interested in those because without it the warmists will deny the graphs.
I think that climate is a very complex phenomenon and that many of those who are writing about this subject should first understand it. I also believe that climate change was influenced by humans and by their actions on sea/ocean. Finally, I’m sure that there will be no catastrophy in the future, the present problems come from those who publish altered datas. Finally, I recommend them a very concise article about the 20th century climatic changes: http://www.1ocean-1climate.com/climate-changes-today.php
As terrible and vast as some wars have been it will take a heck of a lot to convince me that any war anywhere has had much of anything to do with changing even a regional climate in any but the most temporary and transient ways. WW II was greatest Naval war in the history of Mankind and I have studied it pretty extensively. It seems to me that Climate and weather had a great impact on the conduct of that war but the war had virtually no demonstrable impact on the climate or weather. This given the facts that The Battle of the Atlantic was the longest battle of WW II and never before or since have such fleets as plied the waters of the Pacific near the end ever existed. Not just the warships, auxiliaries, and port and coastal units but the huge and long Naval logistical tails required to sustain those fleets and the islands that were invaded, occupied, and turned into bases. In fact I would suspect that the massive deforestation along the fronts of WW I would have impacted climate more than the Naval war of WW II.
Here are more facts that try to support my idea: http://www.2030climate.com/a2005/04_11-Dateien/04_11.html. “The war at sea may have, ‘by force’, imposed many changes to the ocean waters. Thereupon the oceans will generate a ‘blueprint’ for the atmosphere. The atmosphere will fall in line within a short period of time. Subsequent ‘oceanic conditions’ are the decisive factor of climate.Quite different from the interaction between ocean and atmosphere is presumably the reaction time between the in-put and out-put a war at sea has on ocean composition and property. Every sea water change inevitable will influence the status of the atmosphere. It might happen within a couple of hours, within a few months, years, or generations.”
Reblogged this on Globalcooler's Weblog.