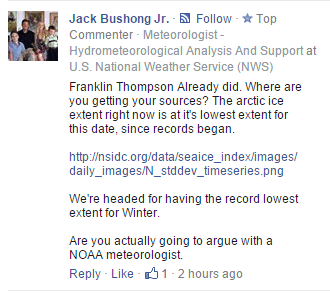
Yes, I am actually going to “argue with an NOAA meteorologist” Scary ooooooohhhhh…..
Until a few days ago, Arctic sea ice extent was at a 10 year high. Then southerly winds in the Bering Sea pushed the ice edge back. The winds are about to reverse, and the ice will be expanding very rapidly. This guy’s forecast of a record low maximum is going to come back to bite him on the ass very soon. Neither he nor anyone else has any idea what the winter maximum will be in two months.
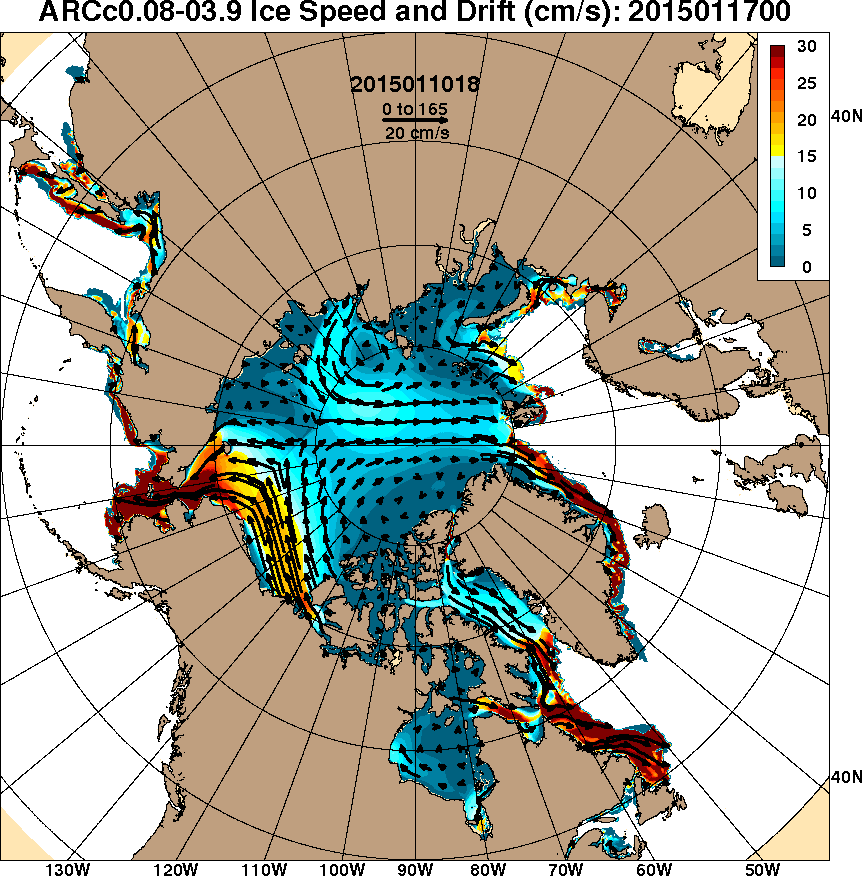
icespddrf2015011018_2015011800_039_arcticicespddrf.001.gif (862×876)


Thank you, Steven, for having the courage to call a spade a shovel.
Arrogant government “scientists” have no idea of the damage lies cause our whole society, including even their own family and friends.
This seems to put the arctic ice trends into context:
http://nsidc.org/arcticseaicenews/
I would be interested in comments.
Seems to be largely factual except for the BS in the last, lengthy sentence about the ‘long-term downward trajectory’. They don’t tell you how the long term downward trend has changed since they have messed about with the average. It was possibly higher in the past (-3.5%/decade in 2013 vs -3.4%/decade in 2015 for the month of December). See:
https://web.archive.org/web/20130113015446/http://nsidc.org/arcticseaicenews
The winds blowing to the north in the Bering reduced the area and extent on the Pacific side. At the same time, winds blowing to the north in the Barents reduced the area and extent on the Atlantic side. That smashed the existing ice in the basin, making lots of very thick ridges. No long term blow toward the Fram Strait, so volume didn’t suffer. A lot of high wind streams directing the main mass toward the Arch. for thickening.
The winds have changed. Bering, Barents and the Canadian east coast are all poised to make big steps up in ice area and extent over the next week. Local air temperatures over all these regions have remained well below freezing.
Funny how the key factor is the direction of the wind; nothing to do with the composition of the air.
I’m gobsmacked at the arrogance of this pretend Meteorologist. Every prediction based on CAGW has failed. Apparently he didn’t get the message that Arctic Ice was suppose to disappear this past summer. And the summer before…..and all the other times. Maybe he has his own prediction on when Arctic Sea ice is going to disappear. We’ll see how good a Meteorologist he is based on his prediction.
Around here they can not get the weather forecast correct a day ahead!
My friend used to joke that they couldn’t get yesterday’s weather right 😉
Tell me about it.
Wunderground had ~ 4 inches of snow and cold enough to put two inches of ice in my stock tanks over night as above freezing and rain when I checked to see what the ‘official’ snowfall total was!
Just wait a bit. They’re making those errors now so their future “adjustments” aren’t quite as steep. That’s certainly true for my area. The closest “weather” station (at an airport) seems to be in a different climate zone that the rest of the area.
I’m expecting reports of severe drought any day now as I actually saw dry earth peeking out from under some cress growing in one of my paddocks. Yes, it has been so wet here that I have some kind of water cress growing in a couple of places that should have grass… a couple of hundred feet from the closest creek or ditch.
Well, they certainly have the wrong postdiction for the 1930’s.
The wind blows some ice back and the cockroaches all scramble out with dire warnings. Once ice returns, as it probably will, cockroaches will scuttle back to the dark cracks from which they came. Pathetically comical.
No, they’ll ignore it and continue to report the old wind packed numbers and keep using that lie until the next windblown notch shows up in the pack. No shame.
“A closed mouth gathers no foot”
-Proverb
When everyone knows you are an idiot why open your mouth to confirm it.
As usual the meteorologists forgot the Sun.
The average LSC (Layman’s SSN, from “landscheidt.info”) was 52.45 for Dec 2014, and has an average of 54 this month,
http://www.landscheidt.info/?q=node/50
This is similar to 2013, when it ended December with 54.16 and had an average of 61 one year ago.
I have noted a good inverse correlation of the Arctic ice with the LSC and, assuming that it’s valid, this should translate in an extent of the Arctic ice now similar to 1 year ago. In fact, the Arctic ice for the end of 2014 and 2013, and beginning of 2014 and now, are almost identical,
http://ocean.dmi.dk/arctic/plots/icecover/icecover_current_new.png
Then, I’d agree with the following comment
“This guy’s forecast of a record low maximum is going to come back to bite him on the ass very soon.”
*IF* the LSC goes down for a few (2-3) weeks.
This is, in fact, reasonable to expect, having in sight that the solar max of the present cycle is giving signs, I believe, of starting to go down.
However, this is “pure speculation” to a good extent, as nobody really knows how the cycle will behave, for example, in the next few months and this could have a very important effect on the Arctic (and the Antarctic) ice extents.
The relatively low minimum of Antarctic ice in 2014 was, I think, importantly influenced by the spike of solar radiations of January and, especially, February of 2014.
Therefore, I agree 100% with the following comment,
“Neither he nor anyone else has any idea what the winter maximum will be in two months.”
because (IMO) it’s strongly dependent on solar radiations, and nobody knows exactly where the latter will go.
And, since it’s not extent but volume that’s important (or so we’ve been led to believe by the arctic death spiral), The last time there was this much ice volume for the first of the year was 2006. We are now almost 2 full standard deviations above the trendline.
http://psc.apl.uw.edu/wordpress/wp-content/uploads/schweiger/ice_volume/BPIOMASIceVolumeAnomalyCurrentV2.1.png
Very interesting, thanks. The trend after 2010 is obviously upward.
Look at the albedo during the same time period
http://wattsupwiththat.files.wordpress.com/2007/10/earth_albedo_bbso.png
Impressive, Gail. There you have another fast change happening around the time of the big ENSO of the turn of the century, as it happened with world’s temperatures,
https://i0.wp.com/i1282.photobucket.com/albums/a532/dhm4444/wood4trees-Interactive-step-change-1979-1997-2001-2015-trend_zpse26f9b04.png
The entire system (Earth’s climate) seems to be varying synchronously with the decline of solar radiations, and the great 1998-2001 ENSO is the most evident signature of the change.
It’d be interesting to have more recent data to see the effects on the albedo of the present relatively low cycle.