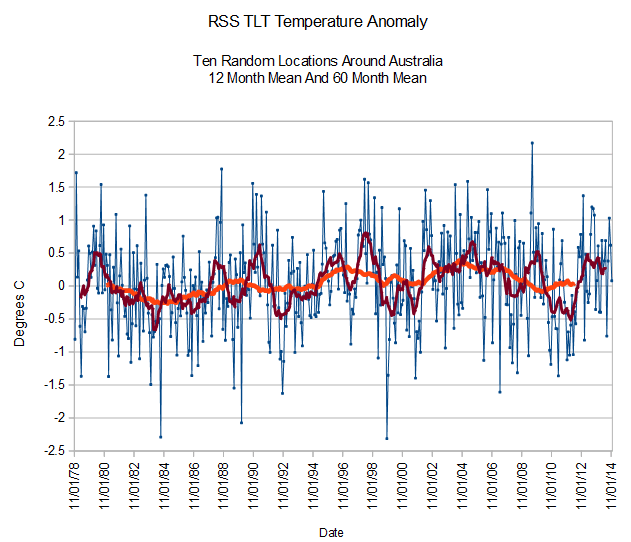
Contrary to the BS from BOM, Australia is not warming, and their hottest recent year was 1998
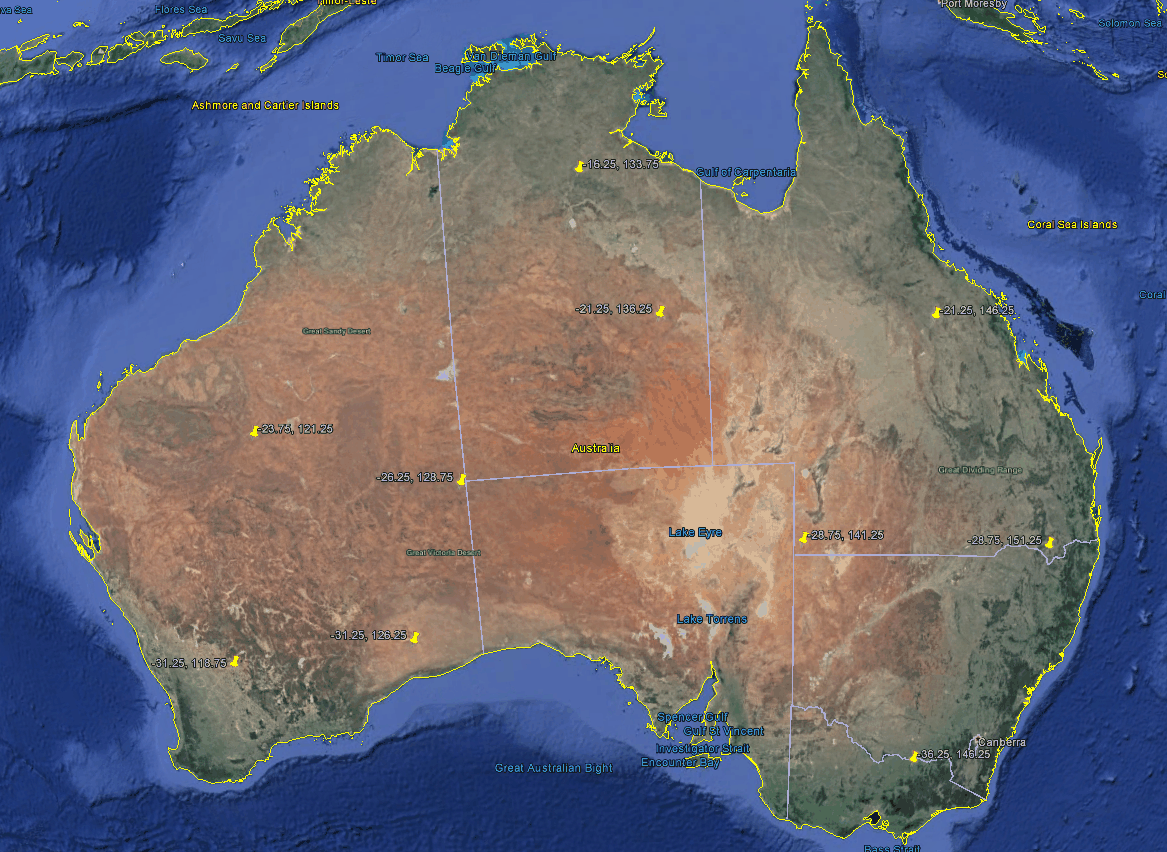
I picked ten random locations around Australia, and averaged the RSS TLT monthly anomalies for those locations. There has been no net warming for 35 years, and the last two years were not their hottest.
Click on the map below to see the latitude/longitude of the ten locations.


Silly Steven. You forgot to do the double-secret peer reviewed global best practice homogenization and station data selection. We can’t tell you what that is, but horribly maintained and highly mobile stations like Rutherglen must have them ’cause it’s sciency. You should also know that it’s complicated and BoM’s published a meandering yet accurately vague paper on what they might be doing to the data and have put out a transparent press release that says so. I mean Australia’s so hot you can probably boil water* at Ayers Rock for gosh sakes.
*in some areas a stove might be required
Fake but accurate!
http://www.realclearpolitics.com/articles/2012/02/29/fake_but_accurate_science_113294.html
I was gonna say that you didn’t choose the (GISS tampered) stations BOM cherry-picked Steve, which is why you’re wrong..
/sarc
Exactly. Not one capital city was chosen. I guess you cant get a predetermined result if you choose random inputs. But since there are only 8 capital cities on the whole continent the odds are a random choice would miss all of them
From handjive at Jo Nova’s
January 4, 2015 at 10:40 pm
A data molester strikes again!
Just how arrogant is that? I was going to call it unbelievable, but of course it’s anything but.
Can we have Mr Crane look into Obama’s Nobel Prize?
Neither is Wyoming (warming). Only wish the wind would quit. On the western slope a joke about Wyoming was frequently repeated,”If summer falls on a weekend, let’s have picnic.” The western slope is warmer than the eastern (some if not most of the winter anyway).
The eastern slope (Montana) is expecting 4 feet of snow. Chicago gets five inches (too bad it isn’t five feet like Buffalo NY got) and high’s of 0°F. Mid NC is looking at lows of 14°F that is 17°F below normal. The record was 9 °F in 2014….. Looks like a replay of last year.
The good news is we haven’t seen a mosquito all day 😉
Tonight
Clear. Patchy fog after midnight. Lows 20 below to 35 below except 5 below to 25 below through the passes. Light winds.
Tuesday
Sunny. Patchy morning fog. Highs 10 below to 25 below except zero to 10 below through the passes. Light winds.
Tuesday Night
Clear. Lows 25 below to 40 below except 5 below to 25 below through the passes. Light winds.
Wednesday
Mostly sunny. Highs 5 below to 20 below except 5 below to 5 above through the passes. Light winds.
How do you get RSS TLT data for individual locations?
yes, I’d like to work with that data.
You can pull down any of the 11 channels and download the data as well:
http://images.remss.com/msu/msu_time_series.html
The download feature doesn’t provide this level of precision.
Are there any tools? It would be great to be able to select and graph any regional satellite data.
I haven’t looked at the netcdf or binary files:
http://www.remss.com/measurements/upper-air-temperature
Thanks. I’ll kick around with it and see what I can get out of it.
There is no money to be made from a flat temperature trend, therefore a flat temperature trend can never pass the scrutiny of peer review amongst climate scientists that feed from the Government trough.
Nice work, but can you add a random point in South Australia somewhere.
I know that Sa is basically unimportant, but still 😉
Maybe boost it to 20 random points to get better coverage.
I love how BOM started from 1910 and left out the Federation drought 😛
http://www.bom.gov.au/climate/current/annual/aus/
Wheat is Australia’s main agricultural crop. Although it only grows for 3 months out of the year (and therefore is not a good proxy for weather) i would like to point out that Aus has, in the past, had frequent devastating, crop-wrecking droughts. In the business we measure ‘trendline yields’, the yields have an inherant annual increase due to advances in genetics, farming techniques etc.
While we only have yield data going back to 1974, we are currently in the longest stretch (7 years) that Aus has not missed trend by 20% or more since 1974. Wheat does not like heat, If this is the result of AWG the Australian farmer, and his banker, should be thankful. (I have a chart but this newbee does not know how to post it).
PS. If i wanted to post a garbage headline that ignored the trendline yield, i would post “3 biggest Australian wheat crops occur in last 7 years thanks to AWG”. That would be true on one hand but complete misleading BS on the other. That argument style sounds familiar?
Reblogged this on Climatism.
These days Sydney (pop. 5 million) is generally 1 to 2 degrees C hotter than Newcastle (pop, 5,000,000) ,100 miles to the north, because of UHI effects. The BOM loves this as it allows them to claim a rising temperature caused by CO2.