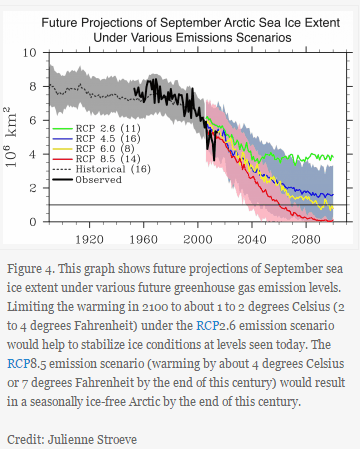
The Y-axis is known as the dependent axis. It assumes that there is a dependency with the X-axis.
The amount of sea ice in the Arctic is primarily controlled by the direction of the wind, and how much old/thick ice is blown out or retained during the winter. No one has proposed any relationship between CO2 and wind direction, so making a graph like this absurd.
Disclaimer : The Arctic may be cold, but Julienne looks hot.


Even hotter than Marohasy
Which satellite did they use for 1934 “whole ice of arctic” point?
Yes, it is a good thing Julienne is pretty. 😉
She is not ugly that’s for sure. The TV companies use her a lot for the weird weather, dangerous weather programs.
She reminds me a bit of Anne Archer… who’s also an actress performing fictional works.
Funny that she should be ‘slicing and dicing’ temperatures, as her name implies:
“Julienning” (From Wikipedia, the free encyclopedia
Julienne (or allumette) is a culinary knife cut in which the food item is cut into long thin strips, similar to matchsticks. Sometimes called ‘shoe string’, e.g. shoestring fries. Common items to be julienned are carrots for carrots julienne, celery for céléris remoulade or potatoes for Julienne Fries.
http://en.wikipedia.org/wiki/Julienning