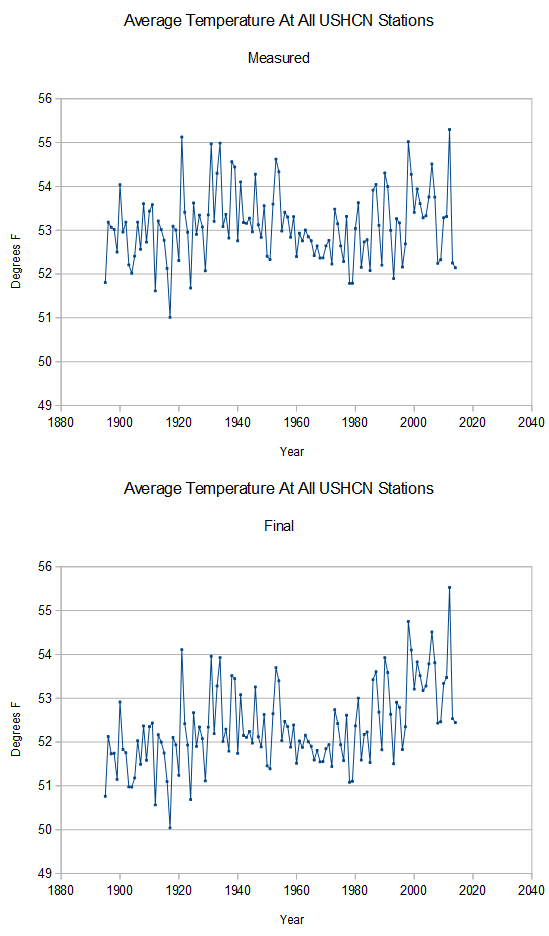
The National Climatic Data Center has broken last year’s record for misleading the public about US temperatures. The thermometer data they use shows no warming over the past 90 years, and that 2013/2014 were two of the coldest years on record in the US. But after data tampering, they report a sharp US warming trend. The animation below flashes between the average measured and final temperature at all stations.
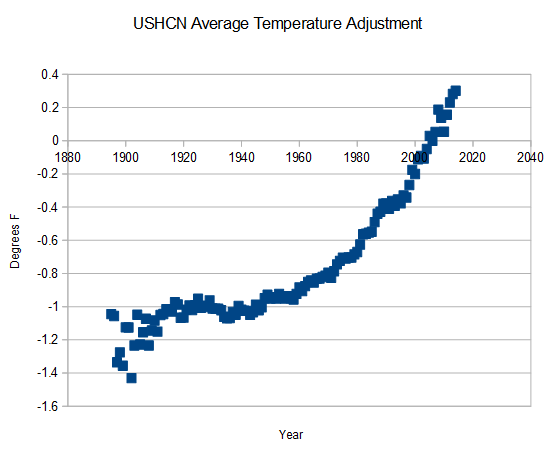
The total amount of tampering reached record levels in 2014, at almost 1.8 degrees F. They create the appearance of warming by cooling all years prior to 2003, and warming all years since that date.
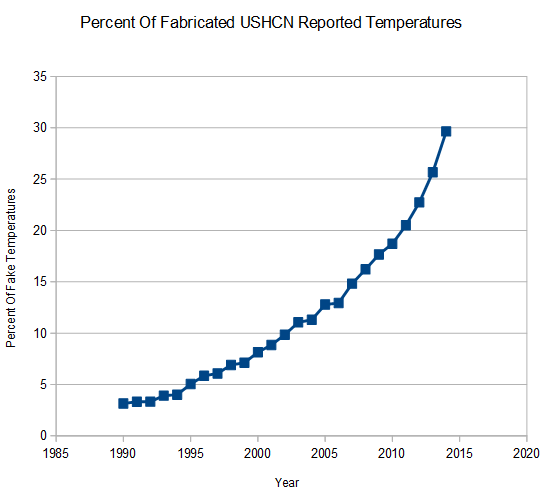
Another spectacular milestone is that the now fabricate 30% of their monthly data. Almost one third of their reported monthly station data has no actual thermometer data from that station. This allows them to contaminate missing rural data, with UHI affected thermometers tens or hundreds of miles away.
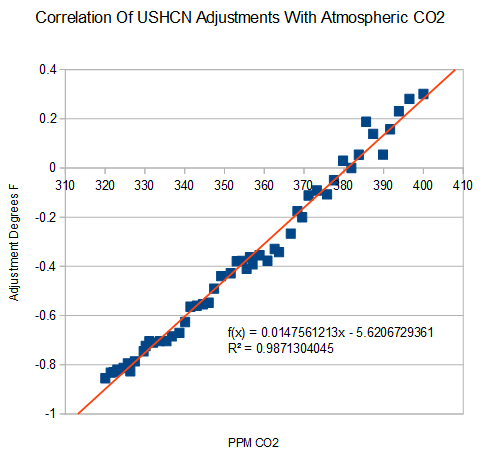
The physical basis of their tampering appears to be the amount of CO2 in the atmosphere. The correlation between tampering and atmospheric CO2 is almost perfect.
It appears that they have a tampering algorithm designed to force reported temperatures to match hopelessly broken global warming theory. NCDC says that the algorithm is “working as designed.”


Steven, a lot more is at stake than you may realize, including the reputations of winners of Noble Prizes & Crafford Prizes in the field of nuclear and solar geophysics.
The reputations of world leaders who United Nations in 1945 are also now at stake.
Here is one last desperate attempt to save the Standard Solar Model and the reputions of those who deceived the public for the last seventy years:
https://share.sandia.gov/news/resources/news_releases/iron_sun/#.VKxPJdm9Kc0
What is the point that you are making here?
I have a suggestion. The USCRN data is unassailable in terms of quality. The USCRN average is a full 1.5 F lower than the data NCDC puts out.
http://www.ncdc.noaa.gov/temp-and-precip/national-temperature-index/faq
They say this is due to differences between networks in location, composition, siting, etc. But why not go through the extensive list of USHCN stations to pluck out “sister stations” that track that of individual USCRN stations over the past decade? Ones where the raw temperature record goes back 100 years instead of 10, and preferably took early temperature readings throughout the time period?
This raw temperatures from this curated list should match the USCRN average over the recent past. It would then be very interesting to see if the past temp anomalies of this curated set of stations strongly diverge from the NCDC anomalies going back, and might perhaps solidify the argument that all these adjustments are unjustified.
When you are practicing prestidigitation, the last thing you want to do is have the audience focus on where the slight of hand is actually happening.
Yes, .M. Smith covered some of the sleight of hand in The Bolivia Effect.
The data was there but instead of using it they used much warmer temperature data from sea level areas. Blatant corruption thinly covered by excuses.
Russia had a similar complain about cold data stations dropped in favor of stations contaminated by the Urban Heat Island effect.
(Original link now gives a 404)
From WUWT a copy of the report. Russian IEA claims CRU tampered with climate data – cherrypicked warmest stations
Thanks for that. “The Bolivia Effect”: very easy to see and explain.
True. Even the sociable Vikings during their friendly visits on foreign coasts became adversarial towards audience members wanting to examine their slœgð.
E.M. Has done a great job.
These are good too:
http://chiefio.wordpress.com/2009/08/05/agw-is-a-thermometer-count-artifact/
https://chiefio.wordpress.com/2010/02/15/thermometer-zombie-walk/
http://wattsupwiththat.com/2010/03/08/on-the-march-of-the-thermometers/
If there was the rule of law in this country and around the world we would have a lot of politicians and ‘scientists’ in jail for fraud. However when the fraud is big enough it is we who are punished.
Yes, E.M. Smith, has done a excellent job too.
I hope we avoid calling for punishment for scientific and political fraud. The best institutions in this country have actively deceived the public since the end of WWII – “to save the world.”
We don’t need to punish them. That would put us in their position as God and further hurt society.
If a fraud is big enough that the perpetrators are not held to the Rule of Law then there is no Rule of Law only the Rule of Man The Rule of Man allows those in power to pick and chose which enemies they wishes to punish and to choose to let all ‘friends’ go free.
The other word for that is TYRANNY!
Gail, even now the tyrants seek to save the Standard Solar Model and the reputations of those who took government funds to deceive the public about the creator, destroyer and sustainer of every atom, life and world in the solar system:
https://share.sandia.gov/news/resources/news_releases/iron_sun/#.VKxPJdm9Kc0
Can you please identify the exact data source and the exact data series for measured and final temperatures that you base your comparison on? I think it will strengthen your argument if you make it easier to verify by others. I would like to replicate your test, but I don´t know which data series to use. Due to all the adjustments I don´t even know if the data you use are available to me in the form you used them.
ftp://ftp.ncdc.noaa.gov/pub/data/ushcn/v2.5/ushcn.tavg.latest.raw.tar.gz
ftp://ftp.ncdc.noaa.gov/pub/data/ushcn/v2.5/ushcn.tavg.latest.FLs.52i.tar.gz
Thank you.
I must admit that I currently lack the knowledge and tools to replicate your brilliant test.
But I hope others, with better capabilities than me, will confirm your work.
I have great respect for your work. Hope you get credit for it.
The correlation between adjustments and atmospheric CO2 is a real eye opener for me.
Is it really met with silence?
“Is it really met with silence?”
It’s usually met with “Steven/Tony is wrong”, or “the adjustments are valid”, with no explanation/proof as to why, for either.
It is very simple analysis. If there was anything wrong with what I was doing, it would be easy to explain.
Then it seems that there are no one at National Climatic Data Center with the scientific integrity to respond properly and the pair of cojones it takes rectify the course of actions if so required.
PS: There’s a discussion about adjustments, here:
http://judithcurry.com/2014/07/07/understanding-adjustments-to-temperature-data/
I’m of the principle that if you need to make adjustments to measurements for scientific purposes, you’re better off leaving out the original readings (those that ended up being adjusted) entirely.
Are there graphs of temps where the “final” readings match the “raw”? (i.e. include only those that are identical). I could possibly do one myself later, if I have the time and inclination.
Thanks.
Agree with your principle to leave out data you can document to be erroneous for some reason. Unless you can document and quantify each individual error and correct the error in an indisputable way. I would then expect that each measured value, each correction and each corrected value is documented together with the correction method for each measurement.
Interesting test your propose to Identify temps where the “final” readings match the “raw”. They
can´t all be adjusted? (Though I wouldn´t be surprised if they are.)
Dave N.
Ernest Beck showed the proper way to handle the older data. The gray is the error range and as I showed the 1918 book even gives the error.
http://www.biomind.de/realCO2/bilder/CO2back1826-1960eorevk.jpg
This is NOT rocket science. It is the proper way to handle the data and that is why so many of use are calling foul with the ‘adjustments’
Steven aka Tony, thanks for your effort in revealing all the climate hoax.
Has NCDC issued any justification for the data tampering?
If so, can you provide a link?
Here is a link to a description of their adjustments:
http://www.ncdc.noaa.gov/oa/climate/research/ushcn/ushcn.html
What doesn’t make any sense to me is why they adjust for UHI only at 0.1 degrees when the graph clearly shows that urban locations are about 0.05 degrees warmer:
“Adjustments to account for warming due to the effects of urbanization (purple line) cooled the time series an average of 0.1F throughout the period of record.”
http://www.ncdc.noaa.gov/img/climate/research/ushcn/rawurban3.5_pg.gif
Sorry, graph shows urban areas 0.5 degrees warmer, not 0.05 (typo).
The actual adjustments are much larger than they document
Actually, this is one of the rare times that NCDC is being truthful when they say “that the algorithm is “working as designed.’”
Exactly. Working to deceive.
Steven, looking at this page
http://www.ncdc.noaa.gov/temp-and-precip/national-temperature-index/time-series?datasets%5B%5D=uscrn&datasets%5B%5D=cmbushcn¶meter=anom-tavg&time_scale=p12&begyear=2005&endyear=2014&month=12
We see that either USHCN or USCRN has been “adjusted” so they match. (iirc, they measure in totally different networks so the chance of the sort of match we see here is vanishingly small)
Do you know if the USHCN data shown here is what gets passed on to other people or do NCDC do further “adjustments” like they have to the pre 2005 record?
Reblogged this on The Road to Revelation and commented:
-“Another spectacular milestone is that the now fabricate 30% of their monthly data.”
I follow Piers Corbyn’s site but I need some simple uncomplicated data to pass on to folk. I know the figures are being manipulated but much of the data published is complex and difficult to get people to even read never mind understand! Is there a site that lays it out in an honest and simple way?