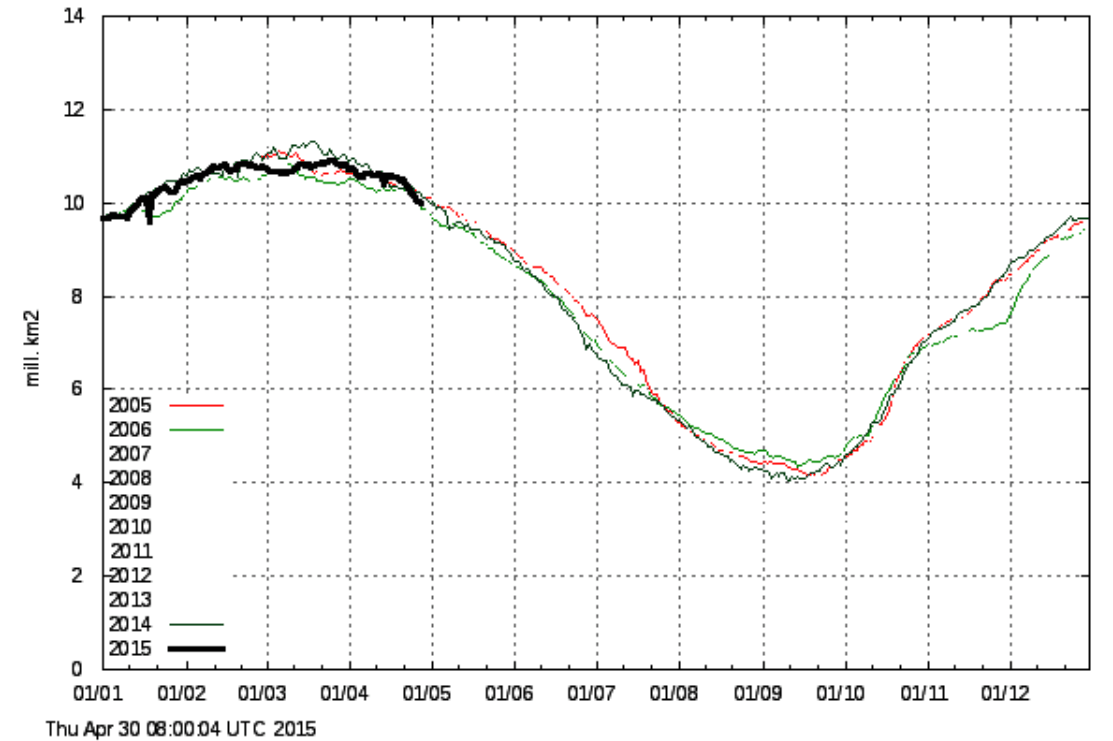
For the past two years, Arctic sea ice extent has been tracking 2005/2006 – which had the two highest summer minimums of the past decade.
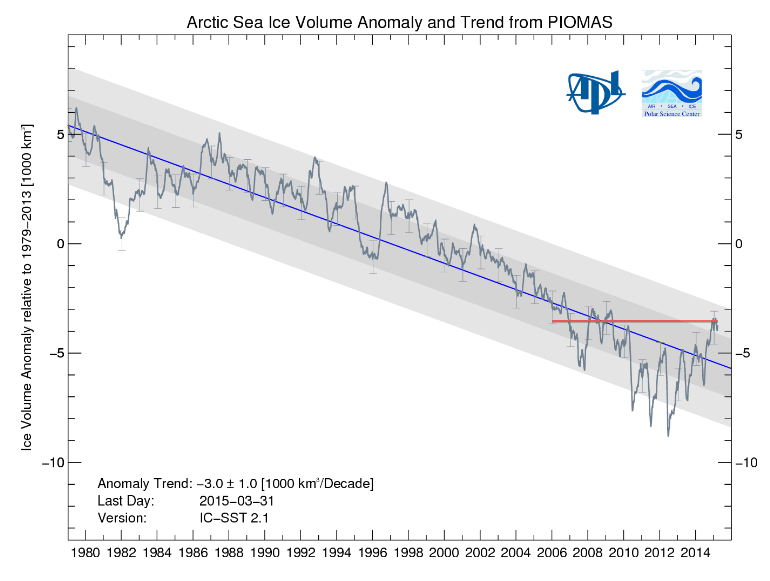
Arctic sea ice volume is just below 2006
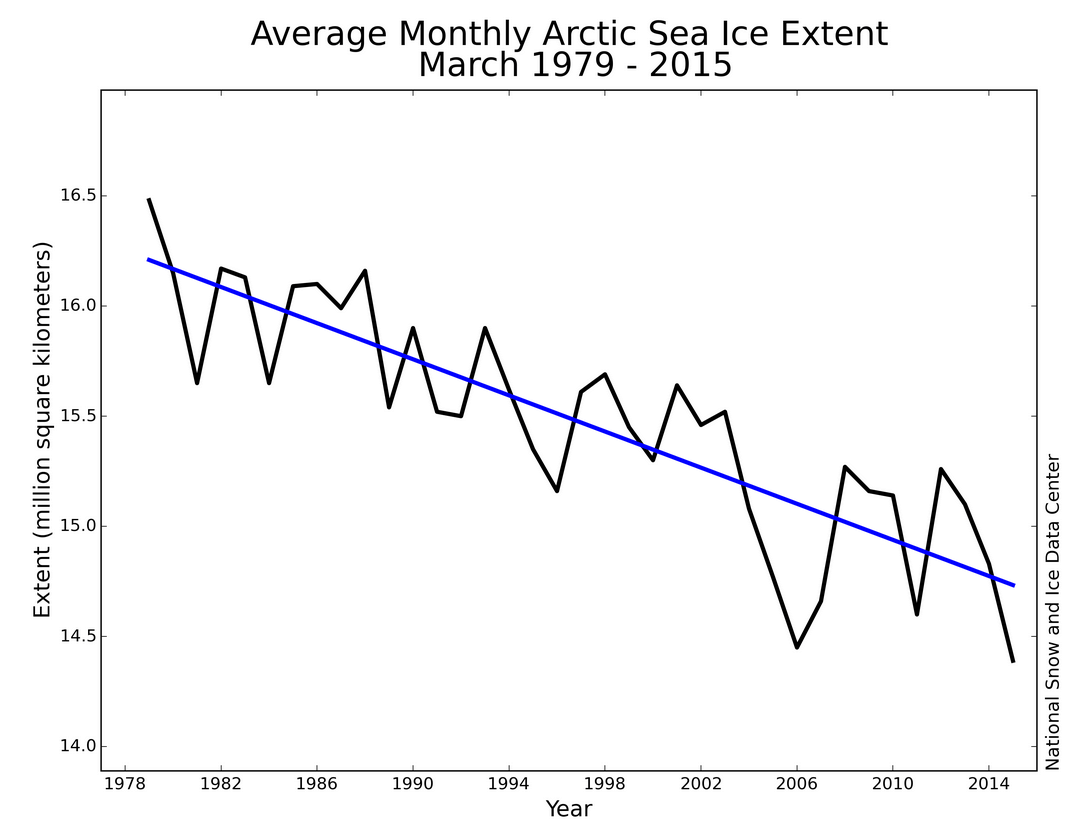
Climate experts will protest by saying “but the long term trend is down two million km sq.” – based on NSIDC graphs, which not so cleverly start in 1979
NSIDC performs this optical illusion by truncating the years prior to 1979, when Arctic sea ice extent grew by two million km sq.
In other words, Arctic sea ice extent is about the same as it was 40 years ago.
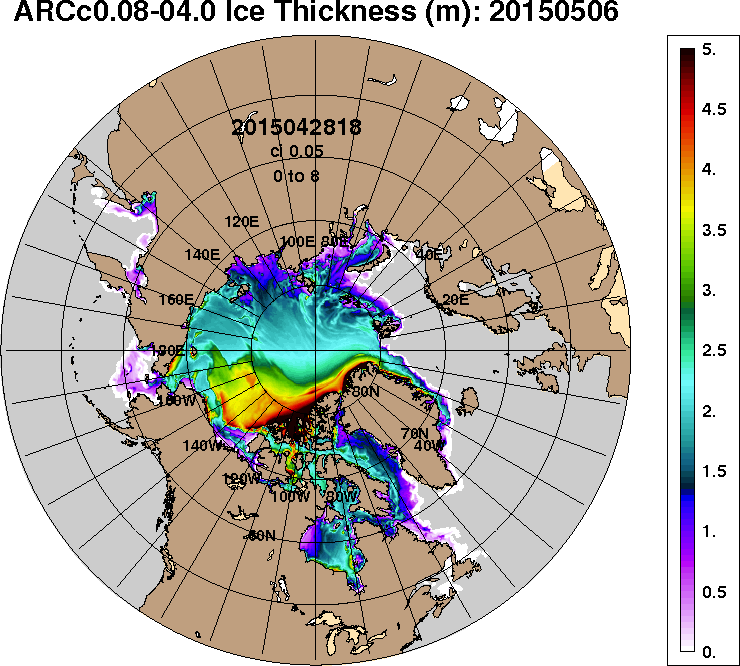
The Northwest Passage is blocked by three meter thick ice in the Beaufort Sea
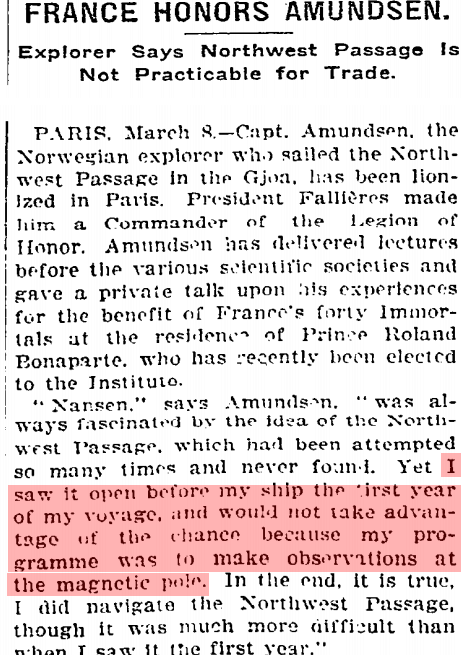
But the Northwest Passage was open in 1904
In other words, there is probably more ice now in the Beaufort Sea than there was in 1904.
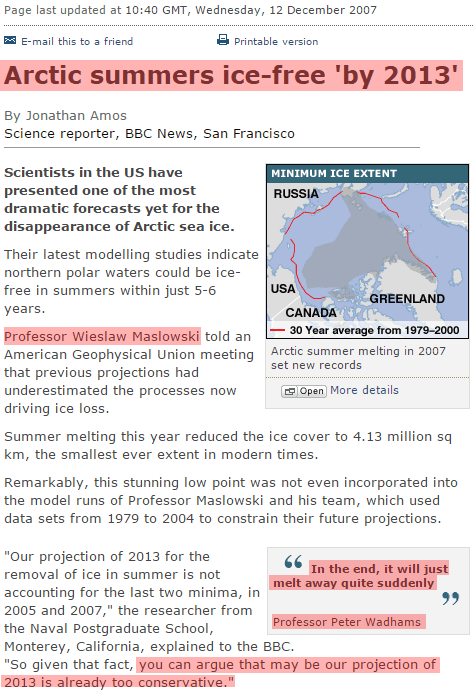
Experts told us that the Arctic would be ice-free in 2013.
BBC NEWS | Science/Nature | Arctic summers ice-free ‘by 2013’
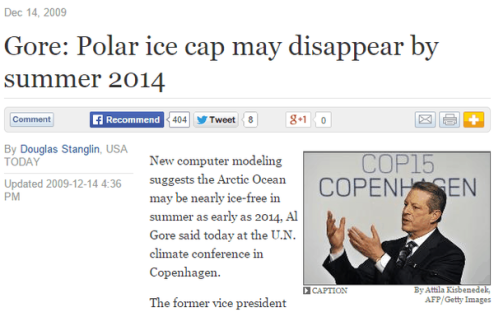
Nobel Prize winners told us the Arctic would be ice-free by 2014.
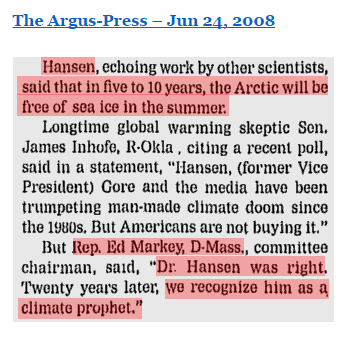
NASA’s top scientist/prophet told us that the Arctic would be ice-free in 2013
These scientists are incompetent political hacks, who are paid to spread propaganda for the government. They have no idea what drives climate cycles, and have no idea what they are talking about.

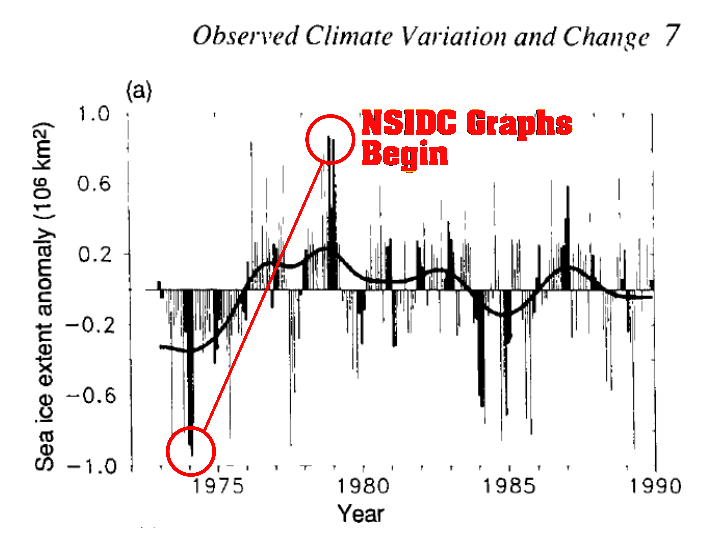



Oh it was educative to look at https://www.ipcc.ch/ipccreports/far/wg_I/ipcc_far_wg_I_chapter_07.pdf
I am interested to see the response from Warmist’s, once the Arctic Ice “exceeds” the average; I wait with baited breath…lol.
I don’t trust the NOAA model forecasts, but it actually shows the ice-extent briefly above normal in July (during the time the extent graph always shows a steep down-slope). At this point they are showing a minimum in September of 6 million km2. Not exactly “ice-free”, I’d say.
https://sunriseswansong.wordpress.com/2015/04/29/arctic-sea-ice-thickening/
http://earthobservatory.nasa.gov/Features/ArcticIce/arctic_ice3.php
The arctic was warmest in 1934
I just hope it doesn’t take 40 years for our economy to recover.
http://3-ps.googleusercontent.com/hk/9dO3E1tyAM9FEJoQjUgzLfLy1j/www.thegatewaypundit.com/wp-content/uploads/575x444xobama-reagan-job-growth-575×444.png.pagespeed.ic.ACsiKkSPDqcRRY8eJlKY.png
All we need to get this economy going is a huge carbon tax! So maybe, just maybe it might be 1 degree or so colder 100 years or so from now. And that maybe sea levels will be a silly millimeter or two lower 100 years from now.
I was thinking more along the lines of a huge carbon footprint. 🙂
Test…
I was thinking more along the lines of a huge carbon Footprint!
https://media2.stickersmalin.com/produit/100/stickers-devil-smile-R1-143760-2.png
Cheap abundant Energy ===> greater economic activity.
“I wish I believed in global warming…” http://wp.me/p3KQlH-GD
So Hansen made his prediction of the Arctic meltdown in 2008, and I assume there are other similar quotes from around that time. Hansen must have some scientific ability, but this has the look of a panicked reaction to the extreme low point hit in 2007. Shouldn’t he have some kind of internal editor telling him not to extrapolate from outliers?
I love the way you encapsulate everything in a nutshell, and keep the overview short. However I really liked the PIOMAS graph that you included last week, that showed the average thickness of the ice increasing. After all, thicker ice would seem to be harder to melt, and lead to slower and less melting in the summer.
https://sunriseswansong.wordpress.com/2015/04/29/arctic-sea-ice-thickening/
Hansen and then Schmidt—same old, same old
and who can get any post which might have skeptical undertones posted at
Real Climate?
Good review of the lies.
I was reading papers by Dr. Jaworowski and Dr. Segalstad this moring and thought this passage was approoriate to bring up here:
If you have never read that paper do so. It is no wonder the Con artists hated him.
WIKI says
There are so many things wrong with this. First off, NSIDC is not trying to pull one over on everyone by starting the trend in 1979. Satellite observations began in late 1978, and therefore to create a homogeneous graph of the best data available, it begins in 1978! Secondly, the declining trend refers to moving averages (the darker averaged line in the plots). Anyone can pick out a high and a low week/month to compare and exaggerate the data. The stretch that arctic sea ice is the same as 40 years ago is unfounded. There are plenty of paleoclimate reconstructions, as well as in situ observations (while sparse and not spatially complete) that support that the trend seen since 1979 is, indeed, alarming.
NSIDC knows that there were satellite records going back to the 1960s
Ice extent/thickness means absolutely nothing re human presence on earth. We are looking at glaciations occurring every ~11,000 years like clockwork. At that time man/women were basically two legged monkeys. Cool down! Pun intended LOL BTW same goes for climate change (ie You wont see it in your lifetime). Unless you clone yourself.
What pun?
After a slightly slower than usual start to the melting season, 2015 has just dipped below all other contenders and now has the lowest extent in the satellite record for the date. And so, as happens every year around this time, I thought to myself, “I bet good old Tony H had posted a ‘Tracking 2006!!!1!!!1!’ post” – 2006 being the previous record low extent throughout May.
And sure enough, here it is. I can almost set my cherry blossom by him. Bless.
And we can be very sure the most Warmist Alarming measure of sea ice will be reported. EXTENT is based on wind and how far apart the ice pack is blown. The amount of five, four, three and two year ice is more important as is the ice thickness. Those peramaters are increasing.
But that is alright the earth is getting ready to enter the next ice age, Big or Little is the only question since we are past due for glaciation by about two centuries. The one thing we can be very very sure of is the earth will not be warming except for brief periods for the next 65,000 years.
The fall 2012 paper Can we predict the duration of an interglacial? agrees with Lisieck and Raymo …
An older paper from 2007 also agrees Lesson from the past: present insolation minimum holds potential for glacial inception
Given the age of the Holocene and the low level of solar insolation resulting, the witch hunt against CO2 is really rather humorous.
You can look up the Solar insolation values for 60 degrees North in June (2nd column ) at NOAA and see how close the earth is to the lowest sun energy value (insolation).
http://www1.ncdc.noaa.gov/pub/data/paleo/climate_forcing/orbital_variations/berger_insolation/insol91.jun
Holocene peak insolation: 523 Wm-2
………………………………………….decreased = 47 Wm-2
NOW (modern Warm Period) 476 Wm-2
…………………………………………. decreased = 12 Wm-2
Depth of the last ice age – around 464 Wm?2
The two questions I have is
1. If we pump out enough CO2 into the atmosphere will it be enough to keep the earth from massive cooling? Even during the time between the two precession cycle peaks in MIS11 the temperature was darn cold and nasty. (Think Little Ice Age or worse.)
2. Do the Elite actually believe we are headed into either Little Ice Age conditions or worse. Are we being Grubered so they and their descendants can survive while we die? Is that why there is so much emphasis on population control started in the 1970s at the same time Hays and Shackleton proved the Milancovitch theory with hard data from sea bed cores?
However the really interesting document is the 1974 CIA report:
“A Study of Climatological Research as it Pertains to Intelligence Problems”</b.
http://www.climatemonitor.it/wp-content/uploads/2009/12/1974.pdf
followed by a 1976 news article:
“1976 CIA warned of global cooling bring drought famine social unrest.”
https://stevengoddard.wordpress.com/2013/07/13/1976-cia-warned-that-global-cooling-will-bring-drought-famine-social-unrest-and-political-upheavel/#comment-518932
OR
http://trove.nla.gov.au/ndp/del/article/110818238
“Calling Professor Maslowski…”
“Calling Doctor Hansen…”
“Calling Veep Al Gore…”
“Please call us.”
http://www.dutchnews.nl/news/archives/2015/04/dutch-researchers-disappear-on-their-way-to-the-north-pole/
The experienced Pole researchers Marc Cornelissen and Philip de Roo sent out an SOS signal on Wednesday and a helicopter was launched. The pilot saw one of the pair’s dogs on the ice, but no traces of the two men.
The coordination centre says it is warm in the area and the ice is breaking up.
http://www.nltimes.nl/2015/04/30/dutch-arctic-researchers-missing-in-canada-distress-signal-sent/
Ice cream makers Ben & Jerry’s are seeking young people to stop the melt and help lick global warming.
Together with WWF and polar explorer Marc Cornelissen, the internationally-recognized brand is launching the Ben & Jerry’s Climate Change College in support of WWF’s international PowerSwitch! campaign.
The three-year initiative will see six young people – aged 18-25 – each year become Climate Change Ambassadors after graduating from the Ben & Jerry’s Climate College. Successful applicants to the college will be fully trained through internships, workshops, and a visit to the polar region to witness the issue for themselves and support ongoing research into climate change.
http://wwf.panda.org/?20152/Ben-Jerrys-and-WWF-launch-climate-change-college
Sad to see people die for nothing. Let’s hope the children who were misled by them fare better.
Just curious. How much would the error boundaries for Arctic Sea Ice change if you included the low number for 1975? Do the past ten years fall into that error boundary?