Crux of AGW’s Flawed Science
(Wrong water-vapor feedback and missing ocean influence)
William M. Gray
Professor Emeritus
Colorado State University
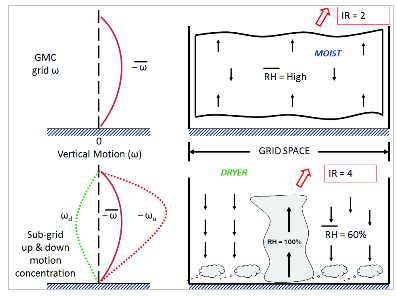
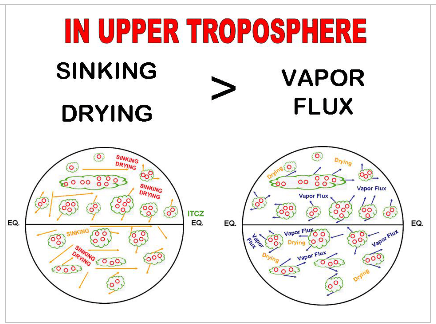
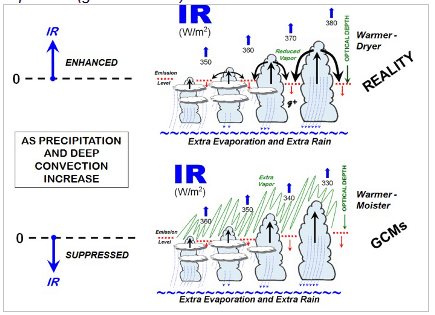
There are many flaws in the global climate models. But the largest flaw is a result of the climate model’s inability to realistically deal with the small horizontal scale (and model unresolvable) changes brought about by the globe’s thousands of individual deep cumulonimbus (Cb) cloud elements (Figure 1). An increase in the totality of these deep Cb convective units adds drying to the upper troposphere (Figure 2). This is in contrast to the assumptions implicit in the General Climate Model (GCM) simulations which increase upper tropospheric water-vapor as a result of enhanced rainfall and Cb convection associated with rising levels of CO2.
Figure 1. Illustration of how the large grids of the GCM models cannot resolve the individual convective cloud elements and all the local up-and-down vertical motion between the grid units. This sub-grid scale convection can result in enhanced IR loss to space and lesser amounts of warming than the coarser GCMs would allow for.
Figure 2. Idealized portrayal of global deep cumulus rain and cloud areas. The left diagram illustrates the upper-level sinking mass coming from the raining deep Cb cloud. This sinking acts to dry and warm the upper troposphere. The right diagram shows water-vapor and cloud particles being advected from the same high rain areas. Observations indicate that the sinking-drying in the upper troposphere is greater than the water-vapor and cloud water replacement by moist air outward advection and evaporation. Enhanced Cb convection leads to upper-level drying and extra IR loss to space.
The model simulations have followed the unrealistic physical ideas emanating from the National Academy of Science (NAS), 1979 (or Charney Report). This report speculated that as the troposphere warms from CO2 increases that this warming would be accompanied (follow the Clausius-Clapeyron relationship between temperature and moisture) by a moisture increase such that the relative humidity (RH) of the air would remain near constant as the temperature increased. Implicit in this NAS assumption of CO2 induced warming was the necessity that this increase of moisture would add additional blockage of infrared (IR) radiation to space beyond what the CO2 gas did by itself. The net IR blockage to space from increasing CO2 was thus assumed to occur not only from the CO2 gas itself but also from the extra water-vapor gain needed to keep the RH near constant as the temperature rose. This additional water-vapor gain was shown by the models to have about twice as large an influence on reducing IR blockage to space as the CO2 increase by itself. Thus, any CO2 increase of one unit of IR blockage to space would simultaneously bring along with it an additional two units of water-vapor blockage of IR loss to space. This additional moisture related blockage of IR loss to space (associated with CO2 induced warming) has been designated as ‘positive water-vapor feedback’. All the CO2 climate models have strong amounts of positive water-favor feedback.
It is this large and direct tie of water-vapor increase with CO2 induced temperature rise which is the primary physical flaw in all of the GCM CO2 doubling model simulations. This is the reason why all the GCMs have so strongly over-predicted the amount of global warming which will occur with a doubling of atmospheric CO2.
Observations show that the warming or cooling of the upper troposphere does not occur with RH remaining close to constant. Temperature and RH tend to change oppositely from each other and not in unison as the models assume. My project’s study of cumulus convection and tropical cyclone formation over many decades has taught me that the NAS 1979 (Charney) Report assessment that rising CO2 amounts will occur with water-vapor increase is not a realistic assessment of how these parameters change in the upper troposphere.
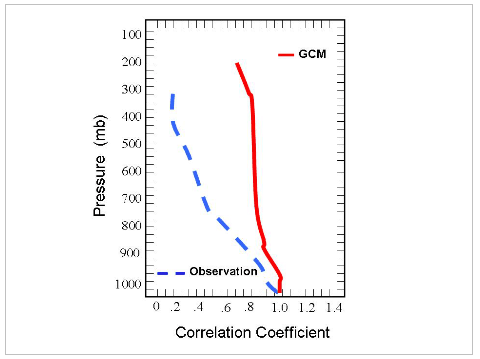
The GCM CO2 simulations are also constructed so as to have their moisture simulations arranged such that water-vapor changes occur uniformly at both upper and lower tropospheric levels. By contrast, the observations of moisture change at upper and lower tropospheric levels show them to be little related to each other (Figure 3).
Figure 3. Correlation of lower and upper troposphere moisture changes. The GCM models simultaneously simulate the same moisture changes at both the lower and upper tropospheric levels – high correlation. The observations however, show very little correlation between upper and lower tropospheric moisture changes.
Our observation analysis finds that increases in cumulonimbus (Cb) cloud intensity and frequency brings about a decrease in upper tropospheric water-vapor, not an upper tropospheric moistening as the model simulations show.
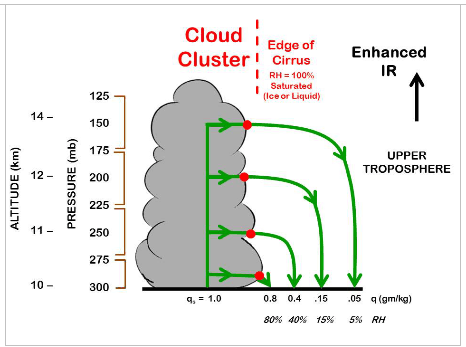
The deeper and/or the more intense Cb clouds become the higher is their rainfall efficiency. Cb clouds rain out most of their moisture as they overshoot from the top of their positive buoyancy layer near 300 mb (~ 10 km) and penetrate higher into the stabilizing upper troposphere where they became weaker and terminate their upward motion. The Cbs weakening upward vertical motion at these high levels leave little upper-level moisture as they die. Their updrafts deposit their saturated but miniscule moisture content air and liquid cirrus clouds high in the troposphere. These are the heights where the vertical gradients of saturation air is, percentage-wise, very large. Any subsidence of this cold upper-level saturated air parcels to lower and warmer levels causes an especially large reduction of the sinking air’s RH.
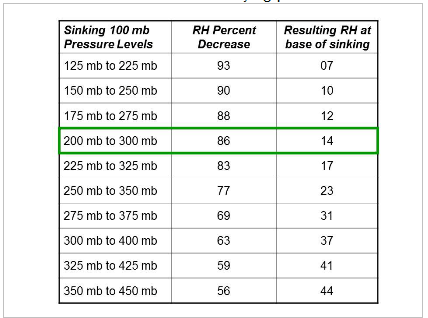
For instance, a saturated air parcel at 200 mb (12 km height) and a temperature of -53oC will contain little moisture even though it is saturated. If this parcel then sinks with no mixing to 300 mb (~10 km height) and takes on the temperature of the lower-level air it will have its RH reduced from 100 percent to only 12 percent (Figure 4). Such Cb induced upper-level air parcel subsidence to lower levels induces an upper-level drying and with it an increased infrared (IR) radiation loss to space. The contrast of these two processes is seen in Figure 5. The crucial flaw of the models is that they have not made a proper up-and-down mass balance of the upper-troposphere’s vertical motion that would have accounted for the high rainfall efficiency of the Cb air which penetrates above 300 mb and the very dry return flow subsidence. See Figures 7-9 at the back for more graphical illustrations of this subsidence drying process.
Figure 4. Illustration of extreme upper troposphere vertical gradient of saturated air in the tropics. This table shows the amount of relative humidity (RH) decrease by saturated air sinking 100 mb between various pressure levels as it assumes the temperature of the lower-level air. The resulting lower-level humidity is given on the right. For instance, saturated air sinking from 200 mb to 300 mb without mixing and maintaining its moisture but taking on the temperature of the air at 300 mb would have a RH of only 14 percent (green bracket).
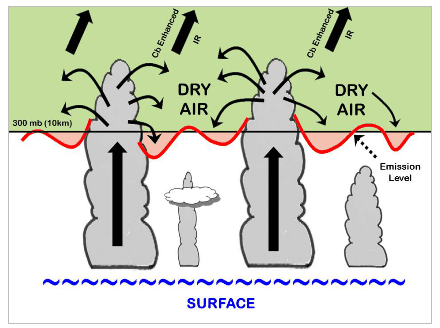
Figure 5. Two contrasting views of the effects of deep cumulus convection. The top diagram emphasizes the extra return flow mass subsidence drying associated with the deep convection. Extra IR energy flux is emitted to space. By contrast, the bottom diagram shows how the typical global climate models (GCMs) interpret the mass outflow from the deep cumulus as adding water-vapor to the upper troposphere and blocking more IR loss to space. The bottom diagram is not realistic as regards to the way Cb convection functions in the atmosphere.
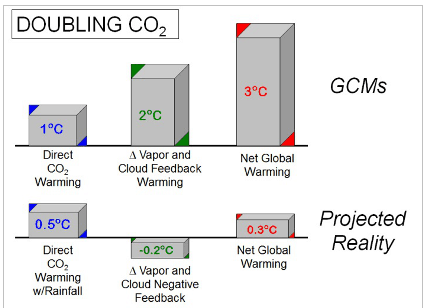
Example. To balance the influence of a doubling of CO2 by radiation alone it would be required that the temperature of the globe be warmed by 1oC. The models then assume that this CO2 induced warming of 1oC will (following the Charney Report assumptions) cause a moisture increase that will further reduce IR loss to space, such that there will have to be an additional 2oC upper-level warming beyond the needed 1oC warming from the CO2 by itself. The combination of these two processes is assumed to bring about an upper-level 3oC global warming over the whole tropics (30oN-30oS). Of this 3oC warming 2oC would be designated as positive water-vapor feedback warming. Such an expected strong and positive temperature increase and positive water-vapor feedback of a doubling of CO2 is quite unrealistic.
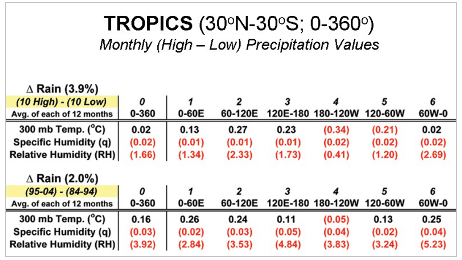
Our project’s many years of analysis of the International Satellite Cloud Climatology Project (ISCCP) observations of IR loss to space in association with enhanced Cb convection and rainfall do not show a decreased IR blockage to space (as the models have indicated will occur) but rather an enhancement of IR loss to space. Our data analysis is, by contrast with the models, representation of a negative water-vapor feedback – the larger the rainfall rate, the lower the upper tropospheric water-vapor content and the greater the IR loss to space (Figure 6).
Figure 6. Changes in 300 mb temperature, specific humidity (q – gm/kg), and relative humidity (RH) by area between two reanalysis rainfall difference data sets for the tropics. Rain differences average 3.9 percent for the 10 highest minus 10 lowest monthly differences and 1.9 percent for the (95-04)-(84-94) data set differences. Negative values are in red. All 300 mb moisture parameters showed water-vapor and RH decreases with enhanced rainfall.
Real global warming to be expected. Without upper-troposphere water-vapor change and without enhanced surface evaporation cooling associated with extra rainfall, the pure radiation response to a doubling of CO2 would indicate we should expect about a 1.0oC global warming. But even with zero assumed water-vapor change this 1oC warming is two to three times larger than what will likely take place. This is because about 60 percent of the 3.7 Wm-2 IR blocking to space from a doubling of CO2 will be balanced by an enhancement of surface evaporation and an increase of the global hydrologic cycle by about 2½ to 3 percent. A zero water-vapor feedback will thus be expected to only bring about a 0.4oC global temperature rise from CO2 doubling.
We show that there is a very modest degree of negative water-vapor feedback of 0.1 to 0.2oC. With this occurring we should expect that the real amount of global warming that will occur from a doubling of CO2 would be only about 0.2-0.3oC or about 5-10 percent the amount projected by the many global models of 2-4oC. The AGW threat and especially the catastrophic AGW (or CAGW) threat cannot be a realistic assertion of how the planet’s climate system functions.
Author’s Background. The author holds an MS (meteorology) and Ph.D. (geophysical sciences) from the University of Chicago. He has been a weather-climate forecaster, researcher, and university graduate school professor for 60 years. He has supervised 50 MS and 20 Ph.D. students. He originated and has been involved with Atlantic basin seasonal hurricane forecasting for the last 31 years.
Gray has never received any research funding from any fossil-fuel source. His position on the global warming issue has led in recent decades to loss of all federal research support he had previously received. His research on this topic continues only through his own funding.
Figure 7. Idealized portrayal of how the outflow and sinking from the upper levels of Cb clouds generates upper-tropospheric drying and a general lowering of the infrared emission level (red line).
Figure 8. Idealized illustration of how upper tropospheric saturated air sinking from the side of a cloud cluster to the 300 mb level will arrive at this lower-level with little water-vapor content compared with its surroundings.
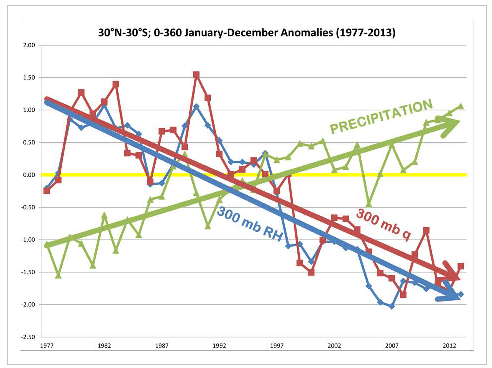
Figure 9. Global tropical analysis showing how the 35 years increase in precipitation has brought about a decrease in 300 mb (10 km) relative (RH) and specific (q) humidity.
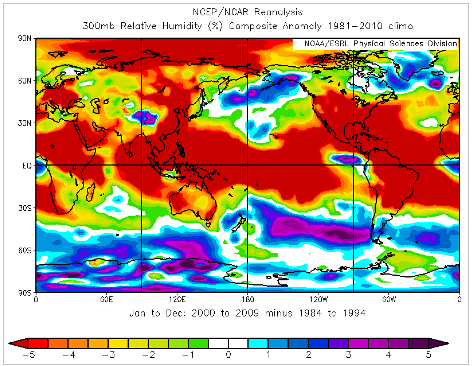
Figure 10. Average relative humidity (RH) decrease from (1984-1994) to (2000-2009) while global precipitation increased by 3 percent.
Figure 11. Contrast of what the GCMs give vs. what our observations indicate as to the likely global temperature changes which can be expected from a doubling of CO2.


It’s always great to see articles written by people who know what they are talking about rather than putting forth the nonsense of the wantabe scientist.
Mann: I don’t understand this shit do you?
Jones: No, this is too much work, Let’s just get Gray Fired.
Gavin: Yep, fire Gray.
Mann: I’ll shove a Hockey Stick right up his A$$…
Jones: LOL .. Mikey does love Hockey…
Gavin: I’ve got a gas guzzling Private Jet to catch… so agreed? Fire Gray.
Mann: Yep, its a Consensus… Fire Gray…
They keep trying to adjust temperatures to fit their flawed models. Now an Australian politician has realized what the Czech President realized several years ago:
AGW is a NWO scam promoted by the United Nations
http://fellowshipoftheminds.com/2015/05/09/top-adviser-to-australia-pm-global-warming-is-a-nwo-fraud-led-by-un/
I am not so sure that those who speak out are just realizing anything. It may be more likely that hey are finally outraged enough, or manage to work up the nerve, to say something that they have long known.
Having this UN propaganda minister tell the Australians that they need to close down their coal industry may have precipitated his speaking out.
Hugh Ellsaesser pointed this out around 1982.
Maybe they don’t work, but they are too big to fail.
The AGW scam may be BIG enough to bring Big Brother to his knees.
“For instance, a saturated air parcel at 200 mb (12 km height) and a temperature of -53oC will contain little moisture even though it is saturated. If this parcel then sinks with no mixing to 300 mb (~10 km height) and takes on the temperature of the lower-level air it will have its RH reduced from 100 percent to only 12 percent (Figure 4).”
So what happens to the energy content?
7.2.1.2 Effects of Clouds on the Earth’s Radiation Budget
The effect of clouds on the Earth’s present-day top of the atmosphere (TOA) radiation budget, or cloud radiative effect (CRE), can be inferred from satellite data by comparing upwelling radiation in cloudy and non-cloudy conditions (Ramanathan et al., 1989). By enhancing the planetary albedo, cloudy conditions exert a global and annual shortwave cloud radiative effect (SWCRE) of approximately –50 W m–2 and, by contributing to the greenhouse effect, exert a mean longwave effect (LWCRE) of approximately +30 W m–2, with a range of 10% or less between published satellite estimates (Loeb et al., 2009). Some of the apparent LWCRE comes from the enhanced water vapour coinciding with the natural cloud fluctuations used to measure the effect, so the true cloud LWCRE is about 10% smaller (Sohn et al., 2010). !!!!!The net global mean CRE of approximately –20 W m–2 implies a net cooling.!!!!!
-20 W/m^2 as apposed to <2 W/m^2 for CO2.
I am looking at the Larimer-Weld Canal and the snow on May 9, 2015 is horizontal. I am so sick and tired of phony intellectuals.
After the massive amount of Man-Made CO2 choking the atmosphere, the question for me is, “why isn’t it getting hotter?” It really is a good question. Shouldn’t it be getting hotter? IPCC models predict hotter. It isn’t getting hotter. Even if it did get hotter, it could be for any number of reasons other than Man-Made CO2; but nevertheless, it isn’t getting hotter.
Thanks for the excellent post. Food for thought; as to why it isn’t getting hotter, even though CO2 levels have passed the “safe” point of 350 ppm.
Oh. And shouldn’t global sea-ice be disappearing? There’s plenty of sea ice. More evidence it isn’t getting hotter.
There are problems with the Man-Made Global Warming conjecture.
“After the massive amount of Man-Made CO2 choking the atmosphere”
Get real!
The amount of CO2 in dry air is one molecule out of every Two Thousand and Five Hundred of Nitrogen and Oxygen. Add in water vapor and it is even less.
And how is a colorless, odorless, and beneficial molecule of CO2 going to “choke” anything or anyone?
The atmosphere is not choked, ferchrisake!
You should stop using such language if you are really skeptical of CAGW.
Don’t you think that the liars are spreading enough BS as it is?
He forgot the /sarc tag.
Did you?
His comment was entirely sincere, and needs no /sarc.
Even the one degree from CO2 is wrong. It neglects the effect of saturation, already 50% and increasing approximately exponentially with increased concentration.
https://geosciencebigpicture.files.wordpress.com/2014/03/co2abs4x.jpg
Image credit Gavin Schmidt, who fails to note that the pink area (that would be 1x CO2) is already saturated and the wimpy yellow areas are the only additional pressure broadening increases to be had from 4xCO2. That would be something like 1500ppm, depending on when you started your quadrupling.
“…Computer models
Cannot possibly predict,
The physics not sorted
To allow that edict;
But that is ignored,
You could say it’s denied,
(Isn’t that the term used
If you haven’t complied?)…”
Read more: http://wp.me/p3KQlH-CL
We need some one line rhyming sound bites.
“If the glove don’t fit, you must acquit”, but only true, and related to the scam.
Maybe something like “If the temp ain’t higher, they must be liars!”
See what you can come up with.
Yup, epic climate model failure:
http://www.drroyspencer.com/wp-content/uploads/CMIP5-73-models-vs-obs-20N-20S-MT-5-yr-means1.png
If you’re allowed to add three arbitrary fudge factors into the model, then it’s easy to make a climate model that seems to produce accurate 24 year hindcasts.
http://i.imgur.com/jOLMXcP.gif
The challenge is to make a climate model that produces accurate 50 year forecasts while using only physically proven parameters and relationships. I’ve never heard of anyone achieving that.
The more highly resolved the model is spatially (as Dr Gray requests) the more quickly the simulation state becomes dominated by floating point roundoff errors in the computer calculations. At the same time, if short term weather effects can accumulate into decadal temperature fluctuations (as Roy Spencer pointed out a few days ago) then the chaos of the real world, which cannot be simulated, will make all climate models fail on any time period shorter than a 30 year average.
Considering how often warmists accuse skeptics of “demanding that impossible standards be met” in climate science, it is an interesting question as to whether multi decadal climate projections can ever be accurate. If not, why are they used as the basis of policy?
” If not, why are they used as the basis of policy?”
Is that a serous question? Or rhetorical?
Follow the money, and the power (political power). There is your answer.
“Still Obsessing On Climate Sensitivity”
All of the planets with sufficiently massive atmospheres (Earth, Venus, Jupiter, Saturn and its moon Titan, Uranus, and Neptune) have temperature profiles with the same basic structure–above about 200 mb (in every case), an “earth tropospheric” temperature lapse rate structure. That fact alone should tell any competent physical scientist that the same overall condition found empirically in Earth’s troposphere (the hydrostatic condition of the Standard Atmosphere) rules all of the planets with substantial atmospheres.
The observational data may or may not fall in line with any given model. Nonetheless the ice caps are melting, the oceans are acidifying and we are not doing anything about it. 2014 was the hottest year on record. Denying these facts is ridiculous. Action is necessary. The atmosphere is a closed system and we have dumped far too much CO2 into it. We’ve already bought a ticket to a very different climate. Enjoy the ride.
“Dear future generations: Please accept our apologies. We were rolling drunk on petroleum.”
? Kurt Vonnegut
Gullibility is your only strong suit. You have brought into every lie they have fed you.
The Global sea ice is at record high levels.
Oceans are not acidifying.
2014 was NOT the hottest year, even in the short record we actually have.
The truth is that the world’s temperature is only just above the coldest its been in the whole Holocene, ie the LIA.
We can be so glad for the small amount of warming we have had.
And we haven’t dumped anywhere near enough CO2 into the atmosphere to bring it up even close to levels that existed when life developed on this glorious green (Thanks to CO2) organic (that means carbon-based, btw) planet of ours.
There is no need to invoke water vapour feedbacks etc. to explain the failure of climate models, nor the inconvenient fact that they are never going to be capable of doing anything other than failing.
Even the IPCC understood that…once.
…in climate research and modeling we should recognise that we are dealing with a complex non linear chaotic signature and therefore that long-term prediction of future climatic states is not possible…
IPCC 2001 section 4.2.2.2 page 774
If Dr. Bill Gray, a man of integrity in the climate science world, speaks–it is well to take note and learn.
With all the swindle, and the swindle swindle, and the great swindle, which are just fights between groups of scientists or so-called scientists. But I think I am smart enough to underline some important facts that I think are logical: people’s pollution and energy consumption have some effect on the climate, but there are other factors that contribute to the climate change in a bigger way. Those factors are: the sun and the oceans, as explained on http://www.seaclimate.com. From what I have seen, there has been payed little, if no attention to the oceans. And I think this should be out focus for the next period. Oceans influence the climate!
How can Dr. Gray claim that atmospheric gaseous CO2 and H2O absorb radiative exit flux with no evidence of such? The opposing “radiance” of these gasses do limit the surface flux. They also replace that exit flux with a much better emitter, the atmosphere. For any gas to absorb outgoing flux that gas must be at a temperature lower than that required for radiative equilibrium.
Because of convection and conversion of latent heat all levels of this atmosphere have temperatures above such radiative equilibrium. This results in the value of radiative exit flux to accumulate all the way to 120 km. As shown in Dr. Gray’s presentation the Cb clouds have tall vertical structure and are comprised partially of H2O condensate. Such structure must generate exit flux in the 8-14 micron window and is not limited to a PI steradian greater solid angle of its horizontal area, as is the surface.
Dr. Gray considers the inversion of effects on upper tropospheric WV the largest flaw in global climate models among many. It is the fatally incorrect use of the Line by line radiative transmission model (LBLRTM)! This model will correctly calculate optical depth or emissivity of any air column in any frequency band from 0.2 to 200 microns. Such a model cannot correctly calculate the attenuation of any incident radiative flux however without first determining if that air will increase its sensible or latent heat in doing so!
Bill Gray, it is noted, has been also cast into outer financial darkness. Is there a way to donate to him?
Thank God, a real climatologist has brought so light to these years of insanity.
My (non physics) bit of logic on the subject:
Yes Virginia, There is a Positive water vapor Feedback)
(and it augments the water vapor negative feedback in the earths climate)
Regardless of our understanding of the random chaotic physics of the atmosphere, water vapor has been the primary atmospheric energy transfer and earth net cooling agent since the earth first acquired a hydrosphere. It dominates the energy transfer and radiation to space process, there is no other competing mechanism thus verifying that water vapor is the dominant cooling factor in the climate. It would stretch logic beyond credulity to think that it suddenly has become a warming factor in the climate energy balance equation. In contributing to increase the localized surface boundary layer temperature it enhances the transfer of this thermalized energy to latent heat of additional water vaporization
There has been in the literature an assertion that although the CO2 alone greenhouse effect would only raise the earth temperature by ~1 C per century, that an additional positive feedback by thermally excited water vapor would increase this climate warming by a factor of between 1 and 6 to reach the catastrophic warming promoted in the UNIPCC Summary for Policy Makers. This letter addresses the absurdity of that assertion and hopes to refocus the point of view of the climate study community to further address quantitatively this area of atmospheric physics.
There is in the lower surface level of the boundary layer, a positive water vapor feedback responding to additional forcing such as CO2 IR capture and thermalization which enhances the transfer of surface energy into the latent heat of vaporization of water. This enhances the cooling rate of the surface and enhances the primary heat energy transport to the level at which there can be radiation to space. It is not unusual in complex systems having outer loop negative feedback to find minor positive feedback loops within which augment the performance of important processes inside the system. These in no way detract from the overall system behavior. The confusing point is that water vapor takes place in both of these processes but at widely different altitudes. Water vaporization, vertical energy transport and radiation control the negative feedback response to any internal or external forcing that might drive climate temperature to change.
Stated simply; positive water vapor IR feedback exists and is limited by IR’s short, mean free path to the lowest strata of the boundary layer. Increased energy rate transfer in this strata is limited to the bulk surface energy transfer rate response but adds nothing to the total energy flow. Water vapor latent energy absorption and transport to altitude is the negative feedback factor driving the earth thermostat. Stated otherwise: Increased water vapor or carbon dioxide is not an additional radiation source since it has no internal source of energy but functions only as an incremental enhancement to energy transfer rate by reducing resistance above the surface-atmosphere boundary. The point of view that adding water vapor and CO2 to the atmosphere increased downward radiation will increase heating is backwards. They have no additional source of energy to radiate. Instead, looking up from the surface we see that surface IR is totally captured and thermalized by these gasses in the bottom surface layer of the atmospheric boundary layer. The vaunted 3.7 watts/m2 increase CO2 radiation to space is not relevant to its effect in this strata of the atmosphere. This question is addressed above the altitude where the latent heat energy has been released by condensation and freezing.
This discussion regarding water vaporization applies to the 90% of the earth covered by water in the form of open surface liquids and transpiring vegetation. The desert regions have their own less constrained radiation physics.
To tediously belabor the point in English:
Water vapor is of course the major ‘Greenhouse’ ie IR absorbing Gas’. By virtue of its broad spectral response as well as its dominating volumetric ratio it is dominant in the atmospheric boundary layer all the way through the troposphere to its final condensation and radiation escape altitudes. It captures IR from the surface radiation in the first several IR mean free path lengths in the first several meters above the surface. CO2 is also active in this region. By virtue of its volume density some 12 to 50 times smaller than water vapor in this region its overlapping band of the spectrum’s mean free path is more than 10 times longer than water vapor. IR will thus encounter ~many attenuation lengths of water vapor absorption before encountering one absorption length of CO2. So we see that additional CO2 in the energy transfer equation will be minimum. Its effect could only serve to slightly lower the vertical level at which all IR is captured and thermalized in the boundary layer Any potential increment to the positive water vapor feedback loop slightly decreases the air thermal resistance. Available IR absorption is complete in this bottom strata of the atmosphere. This short distance radiation inherent in any ‘greenhouse gas’ heat transfer thus serves only to improve the effective conductivity of air in this strata of the boundary layer. This conductivity is in series with and does not bypass the conductivity/convection resistance of the surface mass which is limiting the energy flow to the evaporating and radiating surface.
*ref. Complete thermalization
To recapitulate:
The total energy transfer rate is limited to the bulk surface mass conductivity/convectivity energy transfer rate supplying energy to the surface and is further limited by the cooling effect of surface water evaporating into the accumulating local relative humidity. This surface heat transfer process is thus rate enhanced by the positive water vapor feedback but self limited by these physical heat transfer rate limits. The water vapor positive feedback merely reduces the resistance to the energy transfer from the surface. It cannot increase the energy transfer rate beyond that available through the surface mass transfer rate.
Regardless of the balance of IR radiation capture resulting from these effects, CO2 influence on the energy transfer rate from surface to boundary layer is minimal to none. Relative to water vapor its share in capturing IR is not important but as we shall see any captured IR by any ‘greenhouse’ molecule is a desired benefit to increase the efficiency of energy transfer across the surface boundary and to the water vaporization process and thus to the ultimate water vapor energy convection transport to the radiation level in the troposphere.
Water being an IR absorption molecule it has always had its positive feedback influence on the boundary layer temperature by virtue of the complete thermalization of the captured IR., Due to spectral overlap in the 15 u band this is also true though to perhaps lesser degree than the CO2 contribution in the 2 u wide upper side band slice of unsaturated spectrum. However it plays out between conduction and radiation into the top 10 u film of surface liquid water, the end effect is still total thermalization of the IR in the lowest reaches of the boundary layer. To complete the positive feed back loop, any net thermalized air and any direct radiation of IR contributes to further vaporization of water from the surface and contributes to atmospheric convective lift of the water vapor entrained in the warm rising columns of air.
This local positive water vaporization loop through direct radiation and air thermalization does not add any energy to the system but merely lowers the resistance and thus enhances the rate at which the available energy from the surface converts its heat energy into thermalized air and latent heat of water vaporization. In other words and terms it increases the gain and therefore the rate in a surface-power limited positive feedback energy transfer loop from surface to air and water vaporization but cannot increase the total amount of energy transfer since the surface mass is the only source of energy. This positive feedback water vapor loop is already essentially power limited (saturated) and thus can have no significant response to additional IR capture by additional CO2 gas. In feedback system terms; the loop is already driven by positive feedback to its power supply limit. If surface mass heat energy flow constraints allowed it to respond faster, it would already have evaporated more water to do so.
The surface energy transfer would take place without water vapor positive feedback albeit at a higher surface temperature, slower air conduction/convection limited rate. The positive radiation feedback merely reduces the total resistance to energy transfer toward the surface energy rate limit, it generates no more total water vapor or energy but brings the surface energy transfer to its physical limit more efficiently at a lower surface temperature than would be required in a air/surface conduction-only limited heat transfer. In this respect a local delicately balanced positive feedback factor is not required to prevent runaway since the process is power limited to the rate at which the surface can transfer energy from its thermal mass to the water-air boundary. Thus positive feedback is not to be feared since it makes the surface cooling more efficient and promotes the normal hydrologic cooling cycle of the climate by enhancing latent heat capture in the water vapor.
This provides a strong negative feedback to the surface temperature rising and to the overall climate response to either internal or external forcing, since the evaporated water with its latent heat of vaporization dominates the surface cooling effect by enhancing transfer of energy from the surface. Additional air temperature increase from any increased thermalization enhances convection of this latent heat to the mid and upper level of the troposphere where water, solid, liquid and vapor dominates the total radiation spectrum to space and is the major factor in the earth cooling energy balance.
Above the final condensation and freezing level the increased (doubling) CO2 content of the thin atmosphere would have a minor effect due to its low partial pressure and density and perhaps narrowing side band spectral lines. The final IR radiation temperature (~217K) of the TOA CO2 15 u band spectrum implies that its radiation to space takes place at the tropopause level where the vaunted colder temperature with altitude due to negative lapse rate is diminishing to zero. This further brings into serious question that there can be any significant CO2 ‘greenhouse effect’ anywhere in the earth climate system.
A note:
Perhaps this helps explain why the ocean thermal energy increase rate measured by ARGO is on the order of ½ watt/m2 or less and does not reflect the predicted (1.6 watt) CO2 heating increase let alone any positive feedback energy increase effects.
I believe you mean to say that there is a “negative” water vapor feedback. Alarmists place a “positive” water vapor feedback into their models in order to show warming, and so far a “positive” water vapor feedback has not been observed in nature.
Here are three evaluations of NASA’s NVAP satellite data.
Vonder Haar and Humlum show no discernible trend, Solomon et al show a decrease in atmospheric water vapour in the decade post-2000.
No evidence whatsoever of the essential water vapour feedback without which the high sensitivity water vapour driven positive feedback CAGW hypothesis is dead in the water.
Vonder Haar
http://onlinelibrary.wiley.com/doi/10.1029/2012GL052094/full
Humlum
http://www.climate4you.com/GreenhouseGasses.htm
Solomon et al.
Abstract
Stratospheric water vapor concentrations decreased by about 10% after the year 2000. Here we show that this acted to slow the rate of increase in global surface temperature over 2000–2009 by about 25% compared to that which would have occurred due only to carbon dioxide and other greenhouse gases. More limited data suggest that stratospheric water vapor probably increased between 1980 and 2000, which would have enhanced the decadal rate of surface warming during the 1990s by about 30% as compared to estimates neglecting this change. These findings show that stratospheric water vapor is an important driver of decadal global surface climate change.
https://www.sciencemag.org/content/327/5970/1219.abstract
…limited data suggest that stratospheric water vapor probably increased …
Now there’s some rock solid evidence! 😆