
Cross posted from my new blog : Error Greater Than The Trend | Real Science
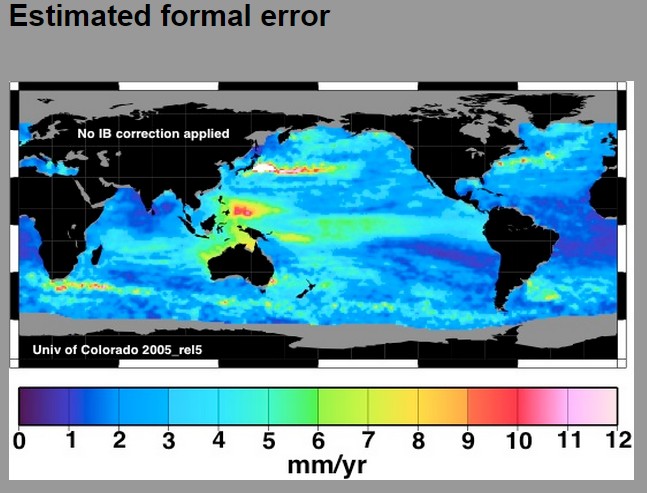
The University of Colorado used to publish this sea level map, showing that their error was as large as 10 mm/year.
Then they claim sea level is rising 3.3 mm/year (more than 2X tide gauges) when they have no idea how accurate their data is.

http://sealevel.colorado.edu/ says that the global mean sea level is rising at 3.3 +/- 0.4 mm. per year since 1993 and shows a strong correlation with the multivariate ENSO index.
ENSO is measured in mm?
Two data series do not have to be measured in the same units to be well correlated. See https://www.mathsisfun.com/data/correlation.html
Could sea level be rising at, say, 1.6mm/yr and still be correlated with ENSO?
If sea level were rising at 1.6 mm. per year, the peaks and troughs in the graph would be smaller, so they would probably not correlate so well with the MEI. However, this is only a guess about a hypothetical situation – one would need to plot the two graphs (real and hypothetical) to be sure.
Exactly. His point was, the fact that the squiggles on the ENSO graph vaguely correlate with those of Jasan and TOPEX, shows that he rate in mm is accurate. It doesn’t.
Feed a mouse and an elephant on the same schedule, growth rate shows correlation between feeding times and growth rate for both animals, and proves the mouse is as big as the elephant.
No, it doesn’t. All it proves is that there is a correlation between feeding times (however one would measure that) and growth rate.
You have no sarcasm detector. Let me restate my post with
Feed a mouse and an elephant on the same schedule, growth rate shows correlation between feeding times and growth rate for both animals, but does not tell growth rate itself.
Therefore, your point that there is correlation between ENSO and sea level rise says nothing to show the actual sea level rise is 3.3 mm. It’s not. Sea level rise has been a linear constant 1.4 mm / year for over 100 years, with no acceleration, and proves that CO2 levels have done absolutely nothing to affect sea levels in any way, shape, or form.
Take a gander at the global sea level gage in Honolulu, where continental changes and equatorial trade winds have no effect:
http://tidesandcurrents.noaa.gov/sltrends/sltrends_station.shtml?stnid=1612340
So let me get this straight – http://sealevel.colorado.edu/ says that global mean sea level rise since 1992 as measured by three satellites is 3.3 +/- 0.4 mm. per year, and you refer to http://tidesandcurrents.noaa.gov/sltrends/sltrends_station.shtml?stnid=1612340 which says that the sea level rise since 1905 in Honolulu is 1.41 +/- 0.22 mm. per year. Why do you believe that Honolulu is more representative of global sea level rise than three satellites measuring sea level around the world ?
Richard Mallett says:…………….”Why do you believe that Honolulu is more representative of global sea level rise than three satellites measuring sea level around the world ?”
Probably because it is! Even NASA says there are real problems with the current satellites measuring sea levels.
“New proposal from NASA JPL admits to “spurious” errors in current satellite based sea level and ice altimetry, calls for new space platform to fix the problem.” http://wattsupwiththat.com/2012/10/30/finally-jpl-intends-to-get-a-grasp-on-accurate-sea-level-and-ice-measurements/
Many thanks for that. I cannot find any mention of a definite launch date for this new GRASP satellite (in fact nothing beyond the concept stage) so maybe it has suffered from NASA budget cuts.
Ok Richard,
How about Sydney, 0.65mm/year
I can name LOTS of others in very geologically stable areas with trends way less than 2mm/year, but I prefer that you do your own research..
…maybe, just maybe, you will learn something then.
Yes, there a lot of tidal gauge measurements at http://www.climate4you.com/ as well as a discussion about the discrepancy between tidal gauges and satellite measurements.
Here’s a question to ponder.
Sydney, a highly stable geological area, shows a sea level trend of 0.65mm/year. (+/-1mm)
If the global sea level trend is, as they say, 3-4 mm/year then there must be other places where the sea level is rising at 7-8mm/year.
What happens in say 50 years when there is around 300-400mm difference ?
Something has got to give 😉
Who can measure global sea level to that fine of measurement? Nobody! But if the earths and oceans surface temperature were rising the way NOAA says it has been for the last decades then we would be seeing a very distinct increase in the rate of sea level rise.
This whole “man-made climate change” thing has reached comical proportions. Desperate “scientists” do desperate things apparently.
http://tidesandcurrents.noaa.gov/sltrends/sltrends_station.shtml?stnid=1612340
Note that some of the biggest rise in seas is right off of Fukushima. This is due to the ocean floor shooting upwards after the giant earthquakes there.
Talking about ‘Error’
What happens when you put Basques and Catalans in the same futbal stadion and play the spanish national anthem?
https://youtu.be/ShRHttF6AFM
2
And a lot of people in Spain don’t understand why we act like this.
https://youtu.be/JlgPifXIsQg
showing that their error was as large as 10 mm/year….back when they admitted gravity pulls satellites down
I wonder if the satellites are being pulled down at 1.9 mm / year
When measurements are taken from satellites, they take orbital decay into account, as they do for the UAH and RSS global temperature data sets.
Just place this handkerchief against the part of your body that needs healing.
It looks like the maximum error is simply at least 12mm/yr, since the scale doesn’t go above 12mm/yr, but there is a rather large area of pure white. Some basic maths is in order.
Let us place an arbitrary cut-off at 14,000,000,000mm/yr & assume that we cannot estimate the error closer than whole mm/yr. There are a finite number of whole mm between 12 & 14000000000, & any fat kid with assburgers can tell you that there are an infinite number of whole mm above 14000000000. Thus the odds of the number being < 14000000000 can be expressed as 14000000000/infinity, which as you well know is zero. Thus we know from sound science & good maths that the maximum error must be larger than 14000000000mm/yr. QED.
I noticed on their trend map that the coast of NSW around Sydney has a trend in the yellow to pink, 6 – 9mm/year.
This is absolutely WRONG!
Fort Denison in Sydney Harbour, one of the most stable geographic areas around, shows a rate of 0.65 – 0.75 mm/year. Wollongong, Newcastle are about the same
Makes you wonder how much of the rest of the map is TOTALLY BOGUS !!!