
Cross posted from my new blog : Cheating With Sea Level – Same Old Data Tampering Story | Real Science
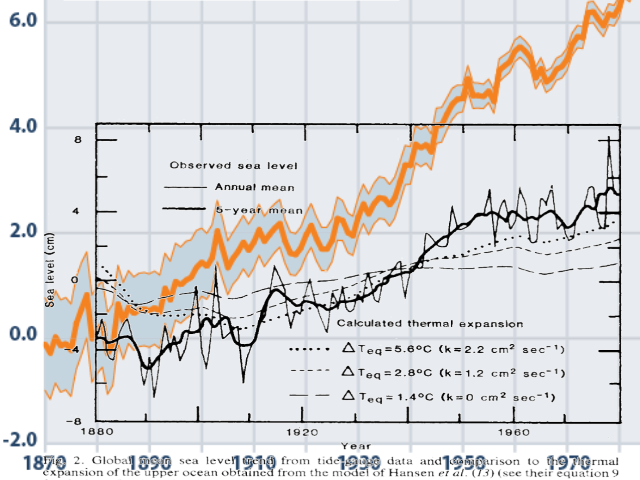
In 1982, NASA showed about three inches (~8cm) of sea level rise from 1880 to 1980.
The EPA now shows double that amount, six inches of sea level rise from 1880 to 1980
Trends in global average absolute sea level, 1870-2008 (US EPA) – Sea level rise
This image overlays the two graphs, to show how they have doubled sea level rise as funding and political requirements have changed.
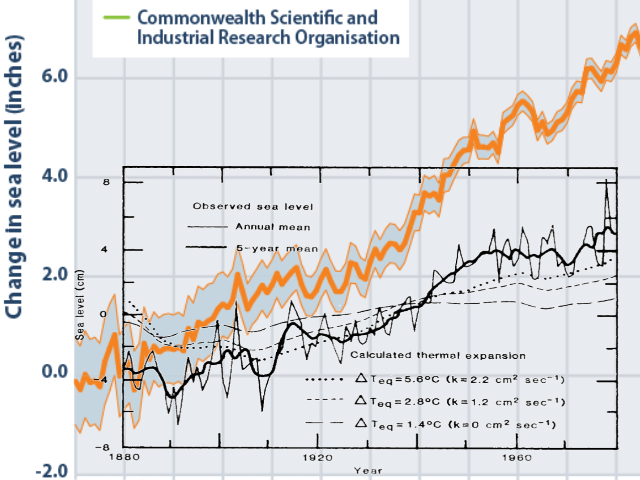
Particularly interesting is how in the 1982 study, sea level went flat after 1950. The EPA has conveniently made that disappear.

.png)
Why is the EPA chasing sea level? Isn’t that a NOAA function?
What can be their justification for such changes? The folks before didn’t know how to read the tide gauges?
The EPA doesn’t need to justify anything. They are the propaganda wing of the executive branch. They don’t do science, they do propaganda. Since the majority of the public doesn’t know anything about the subject, they can make up whatever they want.
And those that do know anything about the subject, have no viable course of action to stop the EPA.
This is the greatest challenge of technology today, making it possible for 100% participation in government.
Meant to say “greatest political challenge of technology…”
Mr. Morgan, I do not disagree with you in principle. But. EPA is only ONE of the Propagandists. EPA is actually the legalized stealth underminer of science that aids and abets political objectives as well as an enforcement arm of politicians seeking power. The “Media”, Universities, Common Core, NY Times, “Real Climate”, UEA, etc, are the other propagandists. Termites are dangerous to both wood and society.
Yes, but I said executive branch. The head of the EPA, although not an official cabinet post, is a white house position. Congress has no say in the EPA.
Thanks again for this info.
It is valuable to have and to use.
Sometimes, for those who are total alarmists, unwilling to engage,
one can simply play the part of an ignorant person asking for help
Above all, never let on what your original thoughts are.
Gradually, ask for help in interpreting what you don’t understand.
On occasion, a person will convince themselves, when you will never
be able to convince them
After all, we humans are stubborn by nature
If you use the Internet Archives WayBack Machine you can find old pages from CU’s Sea Level Research Group:
https://web.archive.org/web/20040327115248/http://sealevel.colorado.edu/
and old versions of raw data files:
https://web.archive.org/web/20040719102733/http://sealevel.colorado.edu/2004_rel1.2/sl_ib_ns_cu2004_rel1.2_global.txt
Download (copy and paste) into Excel and use Excel’s Slope function to figure the rate of sea level rise for the entire time series:
year msl_ib_ns(mm) #version_2004_rel1.2
1992.928 -4.489
…
2003.842 18.55
You will find it comes to 2.6 mm/yr
Do the same thing for today’s version except find the slope for the same time series as the above (#version_2004_rel1.2)
year msl_ib_ns(mm) #version_2015_rel2
1992.9595 -5.818
…
2003.873 30.516
You will find the rate to be 3.5 mm/yr
Over the last ten years the historical data for satellite sea level has been rewritten resulting in an increase of 0.98 mm/yr in the rate of sea level rise.
Looks like:
http://oi59.tinypic.com/24e8482.jpg
Uhm 0.9 mm/yr (somehow a typo 8 appeared)
And have they corrected for the 18.6-yearly Luna Nodal cycle?
The Dutch seems to have found it.
Local Relative Sea Level
To determine the relevance of the nodal cycle at the Dutch coast, a spectral analysis was carried out on the yearly means of six main tidal gauges for the period 1890–2008. The data were corrected for atmospheric pressure variation using an inverse barometer correction. The spectral density shows a clear peak at the 18.6 -year period (Figure 1). The multiple linear regression yields a sea-level rise (b1) of 0.19 +/- 0.015 cm y-1 (95%), an amplitude (A) of 1.2 +/- 0.92 cm, and a phase (w) of -1.16 (with 1970 as 0), resulting in a peak in February 2005 (Figure 2). No significant acceleration (inclusion of b2) was found.
CONCLUSIONS
Coastal management requires estimates of the rate of sealevel rise. The trends found locally for the Dutch coast are the same as have been found in the past 50 years (Deltacommissie, 1960; Dillingh et al., 1993). Even though including the nodal cycle made it more likely that the high-level scenarios would become apparent in the observations, no acceleration in the rate of sea-level rise was found. The higher, recent rise (van den Hurk et al., 2007) coincides with the up phase of the nodal cycle. For the period 2005 through 2011, the Dutch mean sea-level is expected to drop because the lunar cycle is in the down phase. This shows the importance of including the 18.6-year cycle in regional sea-level estimates. Not doing so on a regional or local scale for decadal length projections leads to inaccuracies.
http://www.bioone.org/doi/pdf/10.2112/JCOASTRES-D-11-00169.1
Linear trend lines on sinusoidal curves are very time dependent.
Steve,
Is that suppose to read 3.5mm/yr instead of 3.2mm/year on the graph?
Steve,
then again I just got the same 3.2mm/yr as you stated from 94 to 04.
Which would be an increase of 0.6mm/yr.
Or am I missing something?
Then again, I see you are reading the 9mm/10year from the graph
OK, I will take my time
How about a 1994 to 2004 reading of 24mm/10 year or 2.4 instead of 2.6 mm per year on the 2004
graph
On the other graph,then a 33m/10 year or 3.3mm/yr reading.
The difference being 0.9 mm/year as you stated.
It was the values stated on the two graphs that I felt were not quite correct.
Thanks again
Interesting. Six inches in 100 years = 6″/100yr x 25.4mm/” / 100 yr = 1.52 mm/yr, which is only a few tenths of a mm above what you get by averaging the best coastal tide gauges. It probably includes the addition of Peltier’s 0.3 mm/yr fudge factor to account for estimated <a href="post-glacial sinking of the ocean floor, which would make the actual measured average coastal sea change 1.52 – 0.3 = 1.22 mm/yr, which is just about right.
That 0.3 mm/yr is Prof. Dick Peltier’s estimate of the amount by which sea-level at the coasts would be falling due to ongoing post-glacial sinking of the ocean floor (enlargement of ocean basins) due to crustal loading from meltwater from the last major deglaciation, about 10K yrs ago, were there no other factors affecting sea-level. (The IPCC’s 1.7 mm/year claimed rate for the 20th century is also exaggerated by the addition of that 0.3 mm/yr adjustment.) But sea-level is the level of the surface of the sea, which means that you can’t legitimately subtract off factors (like Peltier’s 0.3 mm/yr GIA) which lower sea-level. Such arithmetic is useful for mass budget calculations, but the result of that subtraction isn’t sea-level!
The Gornitz graph shows what appears to be about 10 or 11 cm (3.9 or 4.3 inches) of sea-level rise over the same period. That would be 1.0 or 1.1 mm/yr, which is also just about right.
The 0.1 or 0.2 mm/yr difference doesn’t seem suspicious to me. You can easily shift the “average” by 0.2 mm/yr or more, without dishonesty, simply by which tide gauge records you choose to study. It’s only the 0.3 mm/yr GIA/PGR component in the EPA’s graph that I object to.
Lots of bullseyes in that post.
Since many many humans insist on building RIGHT NEXT TO THE OCEAN as close as possible, the hysteria about the ocean not being fixed in place is…INSANE. Utterly mad.
The closer to the ocean=the more valuable the land. If anyone believing in it being too warm is at all serious, they would flee the oceans but nope. The more they are hysterical, the more likely they have a mansion right on top of the nearest warm beachfront. Without exception.
I live on a mountain. I don’t fear oceans getting deep, they would have to rise by 3,000 feet to get my feet wet. But then, I am not a creepy rich person squawking about this.
+1
Mansions we pay for when the worst happens.