Several times a day, news reports go out that the polar ice caps are melting, and it is drowning Pacific islanders. As with everything else related to this scam, it is complete BS.
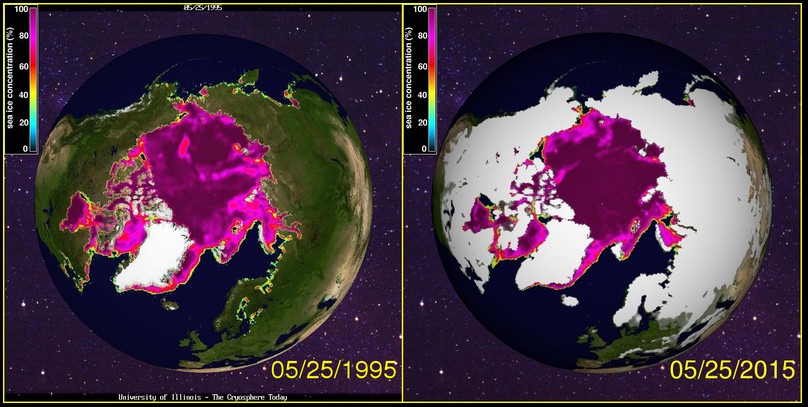
Arctic sea ice extent is almost identical to twenty years ago.
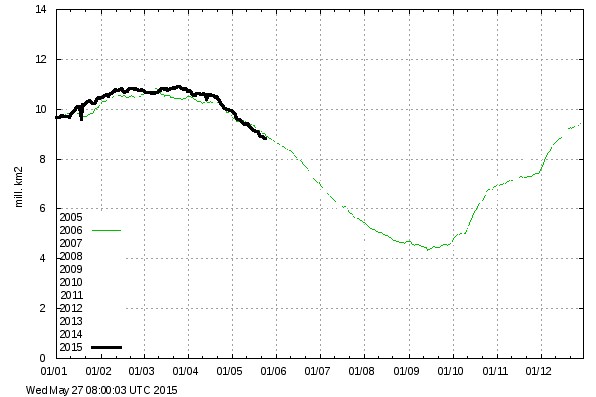
Arctic sea ice is closely tracking 2006, the year with the highest summer minimum from the past decade.
Greenland has gained 500 billion tons of ice since September, and the melt season there is almost a month late
Temperatures on the Greenland Ice Sheet are extremely cold, and scientists there are getting buried in snow and ice
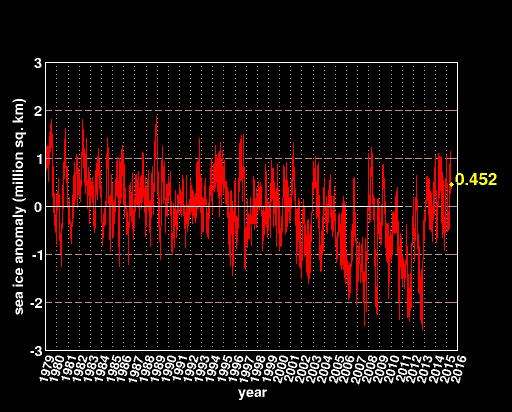
The amount of sea ice on Earth has been running above normal for the past two years.
Temperatures on the Antarctic Ice Sheet are incredibly cold
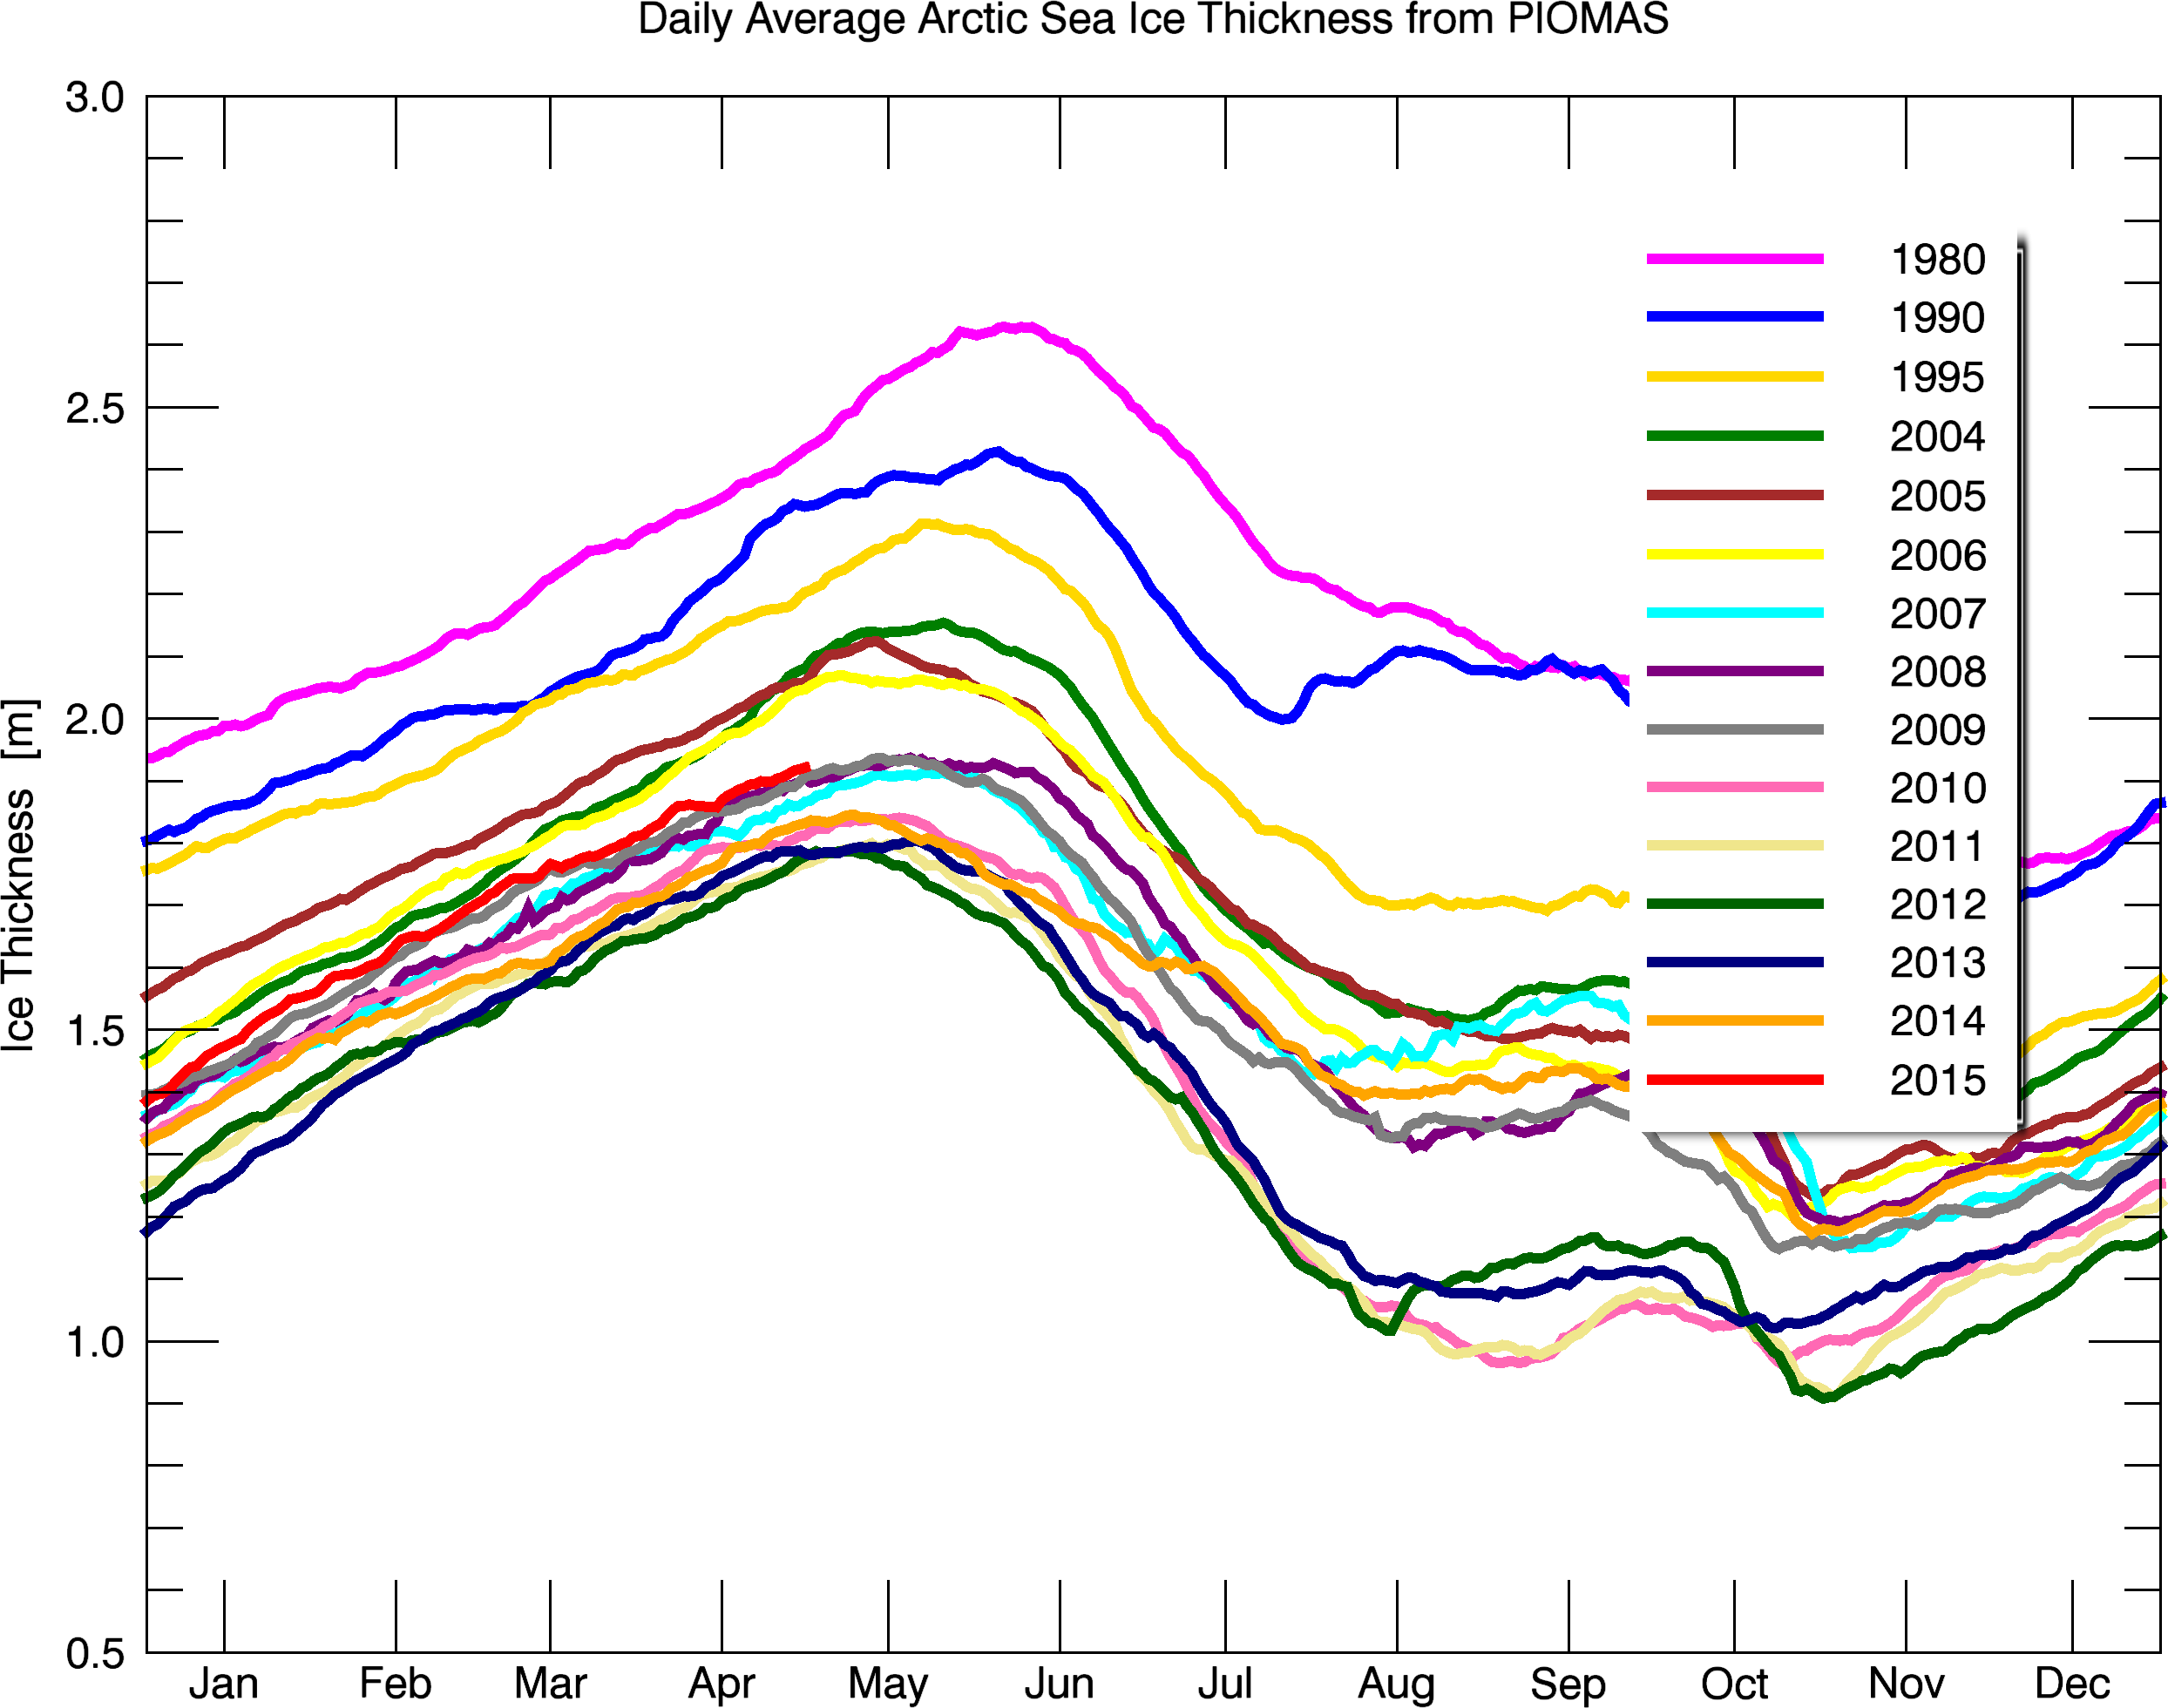
Arctic sea ice is the thickest it has been in almost a decade.
The poles are not melting down. Experts predicted they would, but the predictions were wrong – so now they just lie about it.
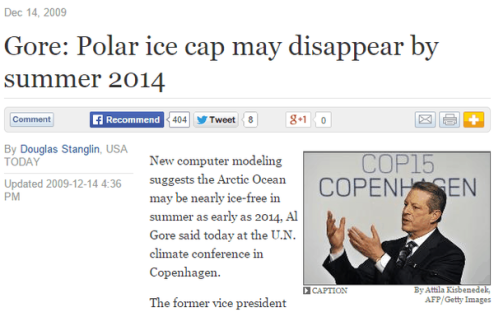
Gore: Polar ice cap may disappear by summer 2014
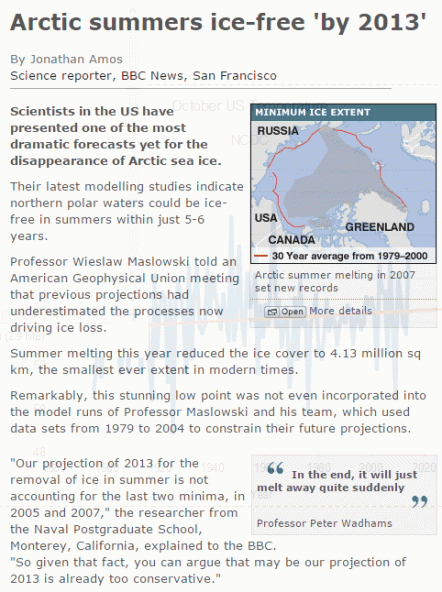
BBC NEWS | Science/Nature | Arctic summers ice-free ‘by 2013?
These people are pushing the largest fraud in history.






It appears that Beckwith’s article has been memory-holed at Sierra Club Canada: can’t find it by title or by author.
Tony… how about applying your brilliance to the Nimbus Satellite Data??
Got to be a few Gems in there.. a few good baselines for the Arctic besides the high point of 1979..
http://nsidc.org/data/nimbus/data-sets.html
ElCore: Is this the Beckwith “prediction” from 2013 you reference?
http://www.desmog.ca/2013/06/14/arctic-sea-ice-vanish-2013
http://www.thecanadiandaily.ca/paul-beckwith-why-arctic-sea-ice-will-vanish-in-2013/
Different links, identical content. Boy, does he have egg on his face.
Tony,
This post and the last one on Texas are excellent. I assume those HCN temperatures are before adjustment? How does it look after adjusting? Also, I can’t remember the name of the even higher quality stations in the US that only has about 130 stations (if I recall correctly). What is that acronym?
Thanks.
Bill
USCRN.
http://www.ncdc.noaa.gov/temp-and-precip/national-temperature-index/time-series?datasets%5B%5D=uscrn¶meter=anom-tavg&time_scale=p12&begyear=2005&endyear=2015&month=5
See posts about half way down a thread a day or so ago.
https://stevengoddard.wordpress.com/2015/05/25/reader-quiz-25/
http://weather.gc.ca/city/pages/nu-15_metric_e.html
Cambridge Bay Nunavut -9c this am where’s the arctic amplification?
Do people understand how unbelievably and dangerously cold -101F is?
Frank: No, most people don’t understand.
Last flight out was Feb 13 from Amundsen-Scott. No flights in until November.
Hydraulic fluids, fuel, etc, don’t function at -100F.
http://www.theatlantic.com/health/archive/2015/02/how-to-survive-winter-in-antarctica/385509/
IMS has this year tracking above 2006 and 2007
http://www.natice.noaa.gov/ims/images/sea_ice_only.jpg
Different in every data set, and the year lines keep crossing over each.
Who knows where it will bottom out this year.!
Nowhere near as low as it would have got to for most of the Holcene, though.
We really need to remember that we are at a COLD part of the current interglacial, only just a molehill out of the coldest period in the last 10,000 years.
And the Antarctic is still hugging last year’s maximums.
http://www.iup.uni-bremen.de:8084/amsr2/extent_s_running_mean_amsr2_previous.png
Funny that you say that, because the extent is again slightly smaller at this time of year than it has previously been. Closely tracking yes, but it would be equally true to say new records have been made during the last year.
Records such as??
According the the Consensus and their Media Lap dogs… 2015 has had some of the hottest months ever.. and Arctic Ice is still decreasing… not going up as indicated here…
Somebody is manipulating and lying…
So which new records ‘could’ have been set this past year??
I was talking about the graphs above.
According to them, 2015 has been and currently is below 2006. According to the institution which created the data, 2015 and late 2014 has been several times and for some time below the whole recorded history.
If you call it a lie, then making a point based on data from that institution is pointless for both you and Steven Goddard.
Here Jimmy Jimmy Jimmy…….!
I knew it would work!
Your wish is my command!
I’m sorry about the delay. Try rubbing the lamp harder next time.
Tell us which of the above graphics (In Tony’s post) are incorrect, and why.
Well David, if you say it’s wrong, that proves it’s right.
David – Starting at the top, the left side shows no snow cover. The right side is much whiter and is dated May 25th 2015, but in fact shows snow cover from February 24th or thereabouts:
http://igloo.atmos.uiuc.edu/cgi-bin/test/print.sh?fm=02&fd=24&fy=2015&sm=05&sd=25&sy=2015
Jim, how does that make the graphics in THIS post wrong?
I just explained that Dave. See the topmost graphic in THIS post!
OK David, I’ll bite. Enlighten us.
Jim tends to ignore what is actually posted.
In a main post with about 8 graphics and an equal number of articles, Jim complains about NOTHING except two arctic sea ice graphics, one from 2015, and one from 1995, he then nit picks a few areas where 1995 has more ice then 2015. Of course he ignores the deep 100 percent purple dominating 2015 verses the much greater 80 percent lighter purple in the 2015 graphic, and apparently every other part of the post was right on.
I’ll pick a few more nits if I may David. Hot on the heels of the NSIDC 5 day average Arctic sea ice extent falling below 12 million km² in May for the first time since their records began, JAXA extent has now dropped below 11 M km² in May for the first time:
http://greatwhitecon.info/wp-content/uploads/2015/05/JAXA-20150529.png
As is Tony’s wont, the conversation has moved elsewhere, where you will find me picking more nits about the conspicuous absence of any mention of the ice mass balance of the Antarctic ice sheet either here or there.
IMS shows this year above 2006. 2007, As does Norsex.
Global sea ice has a zero trend for this day since 1978
Antarctic sea ice area is still setting daily extent records.
And I notice that you are still too cowardly to admit that you are basing your sea ice scare on a pitifully short period at the end of a small climb out of the coldest period of the last 10,000 years
Still refusing to admit that for most of the Holocene, sea ice levels would have been much lower because Arctic temperatures were 1-2 degrees warmer.
Low Arctic sea ice is the NORM over the Holcene.
Its been unusually high over the last few hundred years.
Pity warming has stopped and its starting to cool, because those northern countries will not get the massive benefit of a navigable Arctic sea for any part of the year for a long, long time
Andy,
I note that your usual diatribe contains no reference to the ice mass balance of the Antarctic ice sheet either. Why is that?
And your cowardice continues.
Jim, I asked, “” And you ignore that, and post another graphic.Jim, how does that make the graphics in THIS post wrong?”
Your response is a nit that the tow sea ice graphics are not exact, and then, instead of commenting on any other graphic, you show a new one. Just as I thought. I can show you peer reviewed research showing that Antarctica ice sheet balance is likely not know, and within the error bars of just that, possibly gaining, possibly losing a bit, likely due to volcanism, and not your suv.
However Jim, I guess all the other graphics in this post are perfect, as you disputed none of them. If you are going to pick nits, at least stay on the playing field.
Jimmy, you wuss.
You know that there are just about as many papers showing that Antarctic ice mass is growing as there are that it is decreasing.
You, of course will only show at the ones that show a decrease, because that’s part of your mis-information and propaganda con.
Just like your cowardly refusal to admit that the Arctic sea ice was almost certainly much lower for most of the warmer Holocene.
So….
A paper published today in Earth & Planetary Science Letters evaluates snow and ice-mass changes in Antarctica using both satellite altimetry [Envisat] and gravimetry [GRACE] between 2003-2010. The data shows most areas of the ice sheet are stable to increasing in ice mass, including the East Antarctic ice sheet, which alone contains over 80% of the total ice mass of Antarctica. The Pine Island and Thwaites glaciers in West Antarctica, which overlie geothermal heat sources are found to be losing ice, but represent relatively small regions of the ice sheet. The entire Dronning Maud Land north coast of Antarctica was found to have increasing snow accumulation.
http://ars.els-cdn.com/content/image/1-s2.0-S0012821X14005068-gr001.jpg
Also
http://ntrs.nasa.gov/archive/nasa/casi.ntrs.nasa.gov/20120013495.pdf
And the West Antarctic melt is due to thermal activity
http://iceagenow.info/2014/09/researchers-find-major-west-antarctic-glacier-melting-geothermal-sources/
rah – Errrm, yes. When it slides into to the strangely liquid sea:
https://pbs.twimg.com/media/B8IGcfGCIAIiXdK.png
But ice sliding into the sea was already frozen! Given the exact right conditions fresh water run off can nearly instantly refreeze in salt water. That is refreezing. There are slight differences in the freezing point of water depending on salinity and various other factors. But then when that fresh water refreezes it’s sea ice and thus effects sea level! Again, all that happens in between is academic. No general increase in the rate of sea level rise means no exceptional loss of terrestrial ice. And THAT is the bottom line. You can’t avoid that FACT!
rah – Can I assume from your remarks that you don’t much care for these recent CSIRO results?
http://www.cmar.csiro.au/sealevel/N_a_altimetry_gmsl_refined.html
http://www.cmar.csiro.au/sealevel/images/alt_gmsl_seas_rem_refined.jpg
The trend is your friend. I see no increased trend there. I see a spike spanning maybe 18 months time which very well could be anomalous or natural variance. Besides, you have been claiming the melting has been going on much much longer than that!
Besides even NASA admits that satellite altimeter data does not agree with the tide gauges which show a lower rate of rise. Funny you hadn’t heard about this: A climate science bombshell: New proposal from NASA JPL admits to “spurious” errors in current satellite based sea level and ice altimetry, calls for new space platform to fix the problem. http://wattsupwiththat.com/2012/10/30/finally-jpl-intends-to-get-a-grasp-on-accurate-sea-level-and-ice-measurements/
Andy – And then of course there’s recent papers like this one from 2015:
http://www.princeton.edu/geosciences/people/simons/pdf/EPSL-2015a.pdf
West Antarctica has been losing ice mass at a rate of – 121 ± 8Gt / yr and has experienced large acceleration of ice mass losses along the Amundsen Sea coast of – 18 ± 5Gt / yr 2 , doubling the mass loss rate in the past six years. The Antarctic Peninsula shows slightly accelerating ice mass loss, with larger accelerated losses in the southern half of the Peninsula. Ice mass gains due to snowfall in Dronning Maud Land have continued to add about half the amount of West Antarctica’s loss back onto the continent over the last decade. We estimate the overall mass losses from Antarctica since January 2003 at – 92 ± 10 Gt / yr.
YAWN.. The error margins and time scale are too small to even be worth consideration.
So…. Back to Real topic that your refuse to admit.
Holocene, warmer,less ice, for nearly all of the last 10,000 years.
We have been warming out of the coldest period in the last 10,000 years
Lower sea and polar ice is the norm, not unusual. So Don’t Panic.
Just keep running and hiding from reality. It’s what you do, its who you are.
Andy – Back to the headline at the top of the page.
It’s frankly absurd to discuss whether the “Polar icecaps are disappearing” or not without mentioning the ice mass balance of the Antarctic ice sheet.
“Temperatures on the Antarctic Ice Sheet” doesn’t get close I’m afraid. All IMHO of course!
Again Jim.
If in fact the land masses within either polar circle were in fact losing significant terrestrial ice mass then there must be a corresponding increase in the rate of general sea level rise. There isn’t. End of story. And as for temperatures? When does terrestrial ice melt when the air is well below freezing? The only reason I know of is volcanism. Is there another?
Nearly all ice loss in the Antarctic is in the Western Peninsular,
And it sure has nothing to do with temperature.
https://kenskingdom.files.wordpress.com/2015/05/uah-pause-apr-15-spol.gif
There be volcanoes under that there ice, !!
Nor can it be warm sea currents washing under the massive expanse of sea ice without melting it.. then melting land ice.
https://bobtisdale.files.wordpress.com/2013/12/14-southern.png?w=640&h=440
Yep, Rah, with all this melting ice and ocean warming, the sea ought to be rising at an enormous rate.. 😉
But it isn’t,. Nor is it accelerating.
They even had to invent an isostatic “adjustment™” to fake an extra trend to the small sea level rise that is being reported. So funny. 🙂
http://hockeyschtick.blogspot.com.au/2015/05/new-paper-finds-18-year-pause-of-global.html
But we can be totally sure that reduced polar ice is actually the normal state for the Holocene, and we are actually at the end of a period where polar ice has been at unusually high levels during and since the LIA.
Wouldn’t you agree, Jimmy ! (if you had the guts to)
“The Antarctic Ice Sheet contains 30 million cubic kilometres of ice.”
A gigaton of ice is approximately one cubic kilometre of ice.
So … at 92 gigatons per year, how long before Antarctica melts?
That would be 30,000,000 / 92
326,000 years.
LET’S ALL PANIC !!!!!
Seriously, Jimmy, I know you are a total coward, but…. GET A GRIP !!!
Using a gravity based satellite to measure ice mass changes in an area of know volcanic activity.. ERROR heaven !!
Is the volcanic intrusion below the West Antarctic peninsula heavy basaltic, or lighter granite? If this is moving, which from the warming it obviously is, then it will have a large effect on gravity measurements.
Isn’t it hilarious:-)
All the alarmist data clearly shows that the ice loss is regional.
Then they ascribe to this regional effect a cause that is global.
A quick question for you Andy. How many Gt of ice does the global sea ice anomaly pictured at the top correspond to?
Perhaps Katherine can grasp this one-page summary of the problem government science faces now because Stalin effectively won WWII and united nations [UN] and independent national academies of science [NAS] into an Orwellian Ministry of Consensus Science Truth on 24 Oct 1945:
https://dl.dropboxusercontent.com/u/10640850/Introduction.pdf
Or perhaps Katherine is paid not to tell?
It is perhaps not surprising that members of the press joined forces with the US National Academy of Sciences to deceive the public.
The US NAS has refuses to reply to charges of purposeful deception of the American public, and the US NAS still retains control of budget review of federal research agencies for Congress.
At the risk of repeating myself Tony:
https://twitter.com/GreatWhiteCon/status/603597391703502848
Sea Ice is NOT at an all time low for this date.
That is the most stupid statement I have ever seen.
Who is this moronic “Snow White” fool?
It disregards the FACT that for most of the last 10,000 years the temperatures have been warmer in the Arctic, and Sea Ice levels would have been much lower.
It relies purely on a small molehill of warming out of the COLDEST period in the whole Holocene, and is based on a pitifully short period of data.
Whoever Snow White is, they truly are running a huge CON !!!
And anyway IMS says its above 2006, 2007, 2010 and 2011 even in the pitifully short data.
http://www.natice.noaa.gov/ims/images/sea_ice_only.jpg
And Nordex puts it above 2007 and 2008
http://arctic-roos.org/observations/satellite-data/sea-ice/observation_images/ssmi_ice_area.png
And lets not forget that the Antarctic sea ice levels are “unprecedented™©”
http://www.iup.uni-bremen.de:8084/amsr2/extent_s_running_mean_amsr2_regular.png
Gees, I doesn’t like that link. Try another.. There’s plenty of them
http://nsidc.org/data/seaice_index/images/daily_images/S_stddev_timeseries.png
You’re interested in regional area and extent in Antarctica then Andy? Here you go:
http://GreatWhiteCon.info/resources/antarctic-sea-ice-graphs/
Wow, still trolling for site visitors.
SICK.
and COWARDLY
So in actual fact you’re not interested in what’s going on in the Antarctic Andy?
Facts? from your Dodgy Bros big Con site.. roflmao. get serious.
You have proven you CANNOT admit to facts.
Time and time and time again, you REFUSE to admit that sea ice levels were most certainly lower during most of the last 10,000 years.
I wouldn’t expect any non-propaganda facts on your page, because you have proven that you don’t do FACTS.
Sea Ice Extent – Day 146 – Antarctic Sets 57th Daily Record – 11th Highest Global Sea Ice For This Day
https://sunshinehours.files.wordpress.com/2015/05/antarctic_sea_ice_extent_zoomed_2015_day_146_1981-2010.png
Although all this sea ice is only over a very short period of time, and sea ice was almost certainly more extensive during and LIA and a lot LESS extensive during the rest of the Holocene.
Meanwhile, Global sea Ice extent is doing quite fine,
https://sunshinehours.files.wordpress.com/2015/05/global_sea_ice_extent_zoomed_2015_day_146_1981-2010.png
And I notice that you are still too cowardly to admit that you are basing your sea ice con on a pitifully short period at the end of a small climb out of the coldest period of the last 10,000 years.
Still refusing to admit that for most of the Holocene, sea ice levels would have been much lower because Arctic temperatures were 1-2 degrees warmer.
I don’t expect the media will focus on the Atlantic side, as the AMO is showing signs of moving into its “cold” phase, and the ice extent is likely to be normal on the Atlantic side. Rather the focus will be on the Pacific side, because the PDO is midst a “warm” spike, and there could be a chunk of ice melted in the Chukchi and Beaufort Seas. The ice is thicker over that way than it has been, but I myself still expect time-lapse films to show a bite being taken out of the ice-cover on the Pacific side in late August and early September, because that is normal, natural, and simply what happens when the PDO spikes “warm”. It will reverse when the PDO reverses, likely towards the end of next winter, but I don’t expect the media will mention this.
The best way to counter the media’s hoop-la is to study the history of what has happened in the past, and also to use your own lying eyes. They have more buoys and cameras floating around up there than ever, and I very much doubt reporters ever study the buoy’s data and pictures, for it takes the average layman around six hours of investigating to be a better investigative reporter than the media apparently owns, these days.
https://sunriseswansong.wordpress.com/2015/05/26/awa-ice-news-beaufort-break-up-begins/
https://sunriseswansong.wordpress.com/2015/05/27/arctic-sea-ice-o-buoy-reports/
You’re a bit behind on the Beaufort buoy front Caleb. For more up to date reports and images see:
http://GreatWhiteCon.info/resources/arctic-sea-ice-images/winter-201415-images/#IMB2015A
http://greatwhitecon.info/wp-content/uploads/2015/03/2015cam1_20150527-1024×576.jpg
In case anyone is wondering, this is a picture from Buoy 2015A, which is located right on the coast of Alaska. The coast has no snow-cover any more, and is baking under the midnight sun. The inshore waters often are ice-free by July.
You can access this bouy (including updated pictures) at http://imb.erdc.dren.mil/2015A.htm
There are 8 other Mass Balance Buoys as well. They are mapped and indexed here:
http://imb.erdc.dren.mil/newdata.htm
And their temperature profiles (and other interesting bits and bobs) can be found here:
http://GreatWhiteCon.info/resources/ice-mass-balance-buoys/summer-2015-imbs/
and you forgot to mention the one on the landfast sea ice off Barrow, and……
Jimmy-wimp..
Where is your sea ice data from the rest of the previous 10,000 years, when temperatures in the Arctic where 1-2C higher than now ?
Or are you really comparing now to a small rise out of the coldest period in whole Holocene?
That is very un-scientific.. but you know that, don’t you. 🙂
Tell us which of the above graphics (In Tony’s post) are incorrect, and why.
You can always depend on “Snow White” to sift through all arctic pictures to find the wettest one he can, but you cannot depend on him to show any freezing. He is not balanced, in more ways than one.
He does have a certain value, for he apparently has a lot of time on his hands, and is likely to note when a lead forms or a thaw occurs when other people are working real jobs. However it useless to try to have a discussion with him. I never respond to him directly, any more.
He is also useful because, when he states people had best avoid my posts and go to his, it always gets me a flurry of “hits”.
Remind me again Caleb. Why is it that you “never respond”?
“Why is it that you “never respond”?”
From you, that is hilarious.
Respond to the FACT that Sea Ice was certainly much lower during most of the previous 10,000 years, and that the only reason it shows a slight drop over the last decade or two is because it is still dropping from the COLDEST period in the whole of the Holocene.
Or will you “fail to repond” like you have the umpteen other times you have never responded. Cowardice? Ignorance? which is it Jimbo !!
Caleb most everybody is useful in some way: For Example:
https://www.youtube.com/embed/_43f9RzAqMM
looks like a mini ice-age up north,
Some Arctic ice watchers are focused on the BCE region: Beaufort, Chukchi and East Siberian Seas. It seems that when multi-year ice collects in this region, the Arctic Sea ice margin is protected, and the melting is reduced, resulting in a higher September minimum. Thus an early melting in BCE region can signal a lower summer minimum for NH ice extent, and vice-versa. Part of the interest in BCE this year comes from the warm water blob in the N. Pacific, that may add melting to this region located on the Asian side.
To monitor this, I have added a BCE index, being the total 2015 ice extent in BCE as a % of total 2014 extent in the same region. All figures from MASIE.
So far the two years have been virtually identical with little melting prior to day 130. Daily losses since then have been similar until a gain on day 139 caused 2015 to take a 1% lead over last year. That lead was reversed then recovered and held, until a tie occurred yesterday.
https://rclutz.wordpress.com/2015/05/12/arctic-ice-watch-2015-2/
I recommend this site.
Don’t forget this site Caleb:
http://arctic.atmos.uiuc.edu/cryosphere/IMAGES/recent365.anom.region.11.jpg
Most intriguing! That shows an old copy. Click the image for an up to date version.
Tell us which of the above graphics (In Tony’s post) are incorrect, and why.
Even more intriguing, the thumbnail above seems to have updated itself!
David – Getting back to the topmost image, can you see the dark blue areas in the 2015 image where there aren’t any in 1995 image? Try looking at the Beaufort Sea, the Chukchi Sea, the Kara Sea, Hudson Bay and the North Water Polynya.
Jim, how does that make the graphics in THIS post wrong?
thanks for the recommendation caleb ,it was well worth a visit.
This graph, and both short-term and long-term graphs for all of the fifteen Cryosphere Today Sea-Ice regions, can be found on one page at: http://wattsupwiththat.com/reference-pages/sea-ice-page/northern-regional-sea-ice-page/
And of course independently derived graphs of both area and extent for all of the FOURTEEN Cryosphere Today Sea-Ice regions, can be found on one page at:
http://GreatWhiteCon.info/resources/arctic-sea-ice-graphs/#Area
Jimmy, I notice that you are still too cowardly to admit that you are basing your sea ice con on a pitifully short period at the end of a small climb out of the coldest period of the last 10,000 years
Still refusing to admit that for most of the Holocene, sea ice levels would have been much lower because Arctic temperatures were 1-2 degrees warmer
This graph, and both short-term and long-term graphs for all of the fifteen Cryosphere Today Sea-Ice regions, can be found on one page at: http://wattsupwiththat.com/reference-pages/sea-ice-page/northern-regional-sea-ice-page/
But I repeat myself…
This is a fun game, isn’t it?
Still too cowardly to admit that you are basing your sea ice con on a pitifully short period at the end of a small climb out of the coldest period of the last 10,000 years.
Still refusing to admit that for most of the Holocene, sea ice levels would have been much lower because Arctic temperatures were 1-2 degrees warmer.
This just in: The RAPID measurements prove oceans make climate, and it looks like cooling in the future.
https://rclutz.wordpress.com/2015/05/27/evidence-is-mounting-oceans-make-climate/
Reblogged this on Climatism.
Reblogged this on Centinel2012 and commented:
Reality has no meaning to those that have bought into the lie!
Here’s the NSIDC’s view of the current “reality”, for your edification:
http://GreatWhiteCon.info/2015/05/arctic-sea-ice-fails-to-track-2005-06/#comment-210064
“The NSIDC’s 5 day averaged Arctic sea ice extent falls below 12 million square kilometers in May for the first time since their satellite records began.”
http://greatwhitecon.info/wp-content/uploads/2015/05/Charctic-2005-06-15-0527.jpg
Antarctic sea ice is at “all time” high
https://sunshinehours.files.wordpress.com/2015/05/antarctic_sea_ice_extent_zoomed_2015_day_147_1981-2010.png
IMS shows NH sea ice well above 2006, and 2007.
http://www.natice.noaa.gov/ims/images/sea_ice_only.jpg
GLOBAL sea ice is also very high compared to the rest of the Holocene
https://sunshinehours.files.wordpress.com/2015/05/global_sea_ice_extent_zoomed_2015_day_147_1981-2010.png
You have NOTHING, because that is what you are, and insignificant wimp..
No Honesty,
No Integrity,,
And you are still too cCOWARDLY to admit that you are basing your sea ice con on a pitifully short period at the end of a small climb out of the coldest period of the last 10,000 years
CON is what you do, it is what you are.
You are still refusing to admit that for most of the Holocene, sea ice levels would have been much lower because Arctic temperatures were 1-2 degrees warmer.
PATHETIC !
You do know you are doing immeasurable damage to your agenda/cause don’t you?
Anyone you reads this forum can see you ducking weaving, slithering and sliming.
avoiding the reality.. refusing to answer.
you know it is the truth……… but refuse to acknowledge it.
So funny to watch 🙂
The trend of GLOBAL sea ice from 1978 is basically DEAD FLAT for this day of the year.
https://sunshinehours.files.wordpress.com/2015/05/global-sea-ice-extent-for-day-147-from-1978-infilled.png
Amazing !
I would have expected a slight decrease but I guess the 1998 El Nino didn’t affect sea ice much at all even though it did cause a slight jump in atmospheric temperatures.
Seems that the global climate has been “unprecedentedly” stable since the advent of the satellite measuring systems.