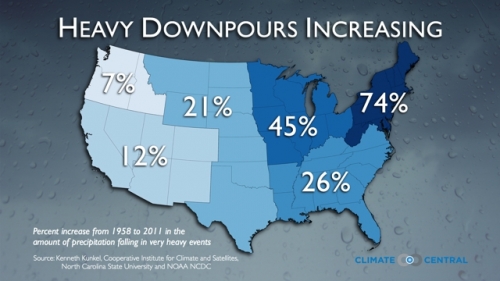
Scientific American published this map showing an increase in heavy rains since 1958, and blamed them on global warming.
Global Warming May Mean More Downpours like in Oklahoma – Scientific American
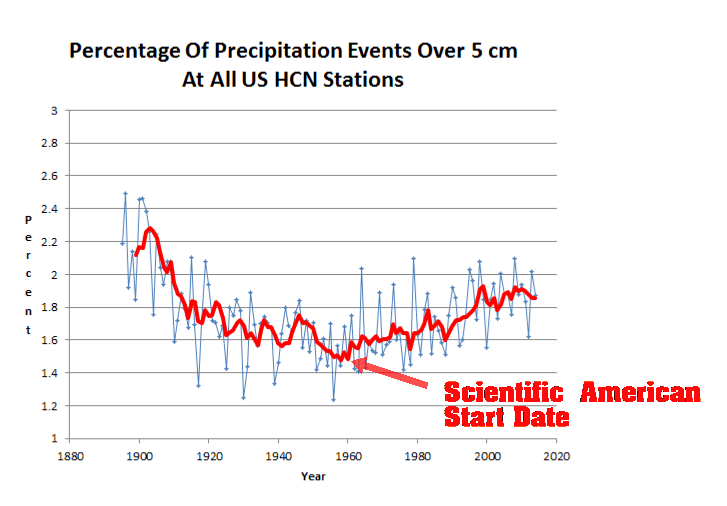
Now check out the spectacular fraud being committed. The author cherry picked the start date of 1958, because it was the minimum in the US climate record. In fact, heavy rainfall events were much more common in the early 20th century, when temperatures were cooler.
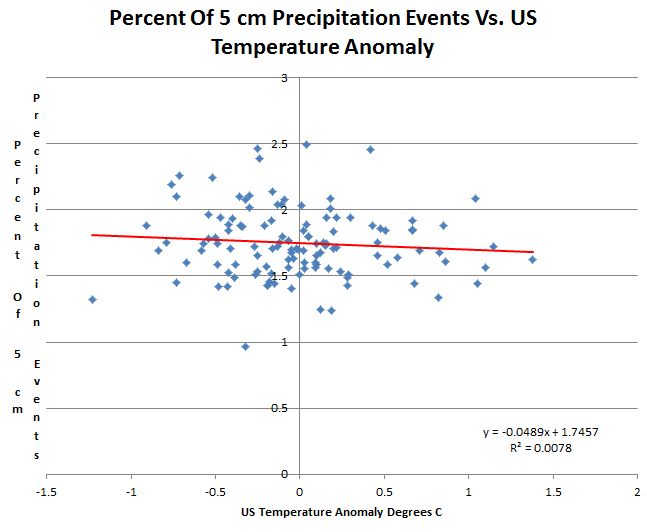
There is no correlation between US temperature and heavy precipitation events
The author is engaged in scientific malfeasance, in an effort mislead Scientific American readers and direct them to the wrong conclusion.


Unfortunately, scientific fraud is lucrative under our tyrannical world government.
1. In 2007 Czech President Vaclav Klaus realized AGW as world tyranny engulfing planet Earth: http://tinyurl.com/5z4j6g
2. Now an Australian politician says the climate change story is NWO fraud from the United Nations. I agreed and documented the reasons for this conclusion:
http://fellowshipoftheminds.com/2015/05/09/top-adviser-to-australia-pm-global-warming-is-a-nwo-fraud-led-by-un/comment-page-1/#comment-414974
http://en.wikipedia.org/wiki/Federation_Drought
Thing is, the early 1900s were actually warmer then today
The link from SA (regarding their info source) is to this:
http://nca2014.globalchange.gov/report/regions/great-plains
“Rising temperatures are leading to increased demand for water…”
I guess one might conclude that something is responding to the demand? I was searching for what their reasons (i.e. not Tony’s) were (if any) for the 1958 start date. I was too twisted up from laughter to bother with looking any further.
Look at her list of total bogus shit Articles… Geez…
http://www.scientificamerican.com/author/andrea-thompson/
“It’s rained before and it’s raining again,
But this time its “climate change”.
Compensation I’ve been promised by President Obama,
So a claim form I need to arrange.
Although it has rained many times before,
I think I can claim “extreme” drops.
So I must get my form submitted, quick, quick,
Before this extreme weather stops.
After the rain, when the sun comes out,
It will be the hottest day ever;
Computer models will confirm that this is the case;
These climate scientists are so very clever…..”
Read more: http://wp.me/p3KQlH-7G
Scientific American has long been a fraud, would not trust anything said, they just want to keep sales up publishing anything, scientific or complete garbage, e.g. latter – OK story on heavy rain.
But get ready for some above average wet weather over next year, and more future stories incorrectly blaming such on CO2 and global warming (abet things may be getting a tad cooler) – two things, 1.) recent volcanic eruption of Calbuco in Chile put up a lot of dust but moreover sulfur dioxide injected in stratosphere, dust blocks out sun and sulfate aerosols seed clouds both cooling the troposphere, e.g. Pinatubo in 1991 caused say a year or two so spike down in temperatures 0.5C and some record rainfalls in 1992, but Calbuco at this point is weaker than Pinatubo so wait and see if it erupts a few more times, and 2.) if you follow solar cycle 24 reduced sun activity this time round on flip, sort of like a weakened dynamo and magnetosphere protecting earth from cosmic radiation, and when less of that high frequency stuff is reflected off earth, you will also get some more entering and seeding of clouds, cooler climate and more rain, it will take a number of years to see if going into a period similar to Dalton or Maunder and Minimum, but on margin speculative bets going up.
Must not forget Eyjafjallajökull in Iceland, and the effect it had upon much of Europe’s weather.
Nor of Bardarbunga.
Nice graph, a pretty cherry-picking event.
Could you make peace with Anthony?
It is up to Anthony and Judith Curry to set the record straight – clearly and unambiguously. They created the problem, and only they can fix it.
Their careless, self-serving and incorrect remarks greatly damaged the ability of skeptics to get the data tampering message across.
Is the entire story somewhere? (I hate asking, but I am seemingly terrible at finding the obvious)
I know it has been ask before, but any answers to this question?
So Tony what have your detractors to the original identification come up with? After all, A. Watts posted – NCDC needs to step up and fix this along with other problems that have been identified.
And they are, I expect some sort of a statement, and possibly a correction next week. In the meantime, let’s let them do their work and go through their methodology. It will not be helpful to ANYONE if we start beating up the people at NCDC ahead of such a statement and/or correction.
I will be among the first, if not the first to know what they are doing to fix the issues, and as soon as I know, so will all of you. Patience and restraint is what we need at the moment. I believe they are making a good faith effort, but as you all know the government moves slowly, they have to get policy wonks to review documents and all that. So, we’ll likely hear something early next week.
http://wattsupwiththat.com/2014/06/28/the-scientific-method-is-at-work-on-the-ushcn-temperature-data-set/
Never did read about any corrections and from the above now 50% (up 10%) still fake they are only making more.
How many more years of lying are you willing to give them?
I say “Beat’em up” with their own fallacious “data”. They are the ones who giving more rope to hang themselves with.
Tony, you have made some mistakes, and making friends with possible allies has not been among them 🙂
Now yes, Anthony made some nasty remarks on you, but I’d be glad to see you forgetful.
Scientific American and National Geographic went over to the dark side a long time ago.
Nature went with them
And Popular Science along with them.
A significant increase (as seen in garfice) cosmic radiation causes an increase in rainfall and decrease the humidity in the upper troposphere (what is observed). As a result, the temperature drops in the troposphere. The decrease in solar activity (the temperature gradient in the stratosphere) reduces the force of the wind and the consequent evaporation in the equatorial regions.
Our project’s many years of analysis of the International Satellite Cloud Climatology Project (ISCCP) observations of IR loss to space in association with enhanced Cb convection and rainfall do not show a decreased IR blockage to space (as the models have indicated will occur) but rather an enhancement of IR loss to space. Our data analysis is, by contrast with the models, representation of a negative water-vapor feedback – the larger the rainfall rate, the lower the upper tropospheric water-vapor content and the greater the IR loss to space (Figure 6).
https://stevengoddard.files.wordpress.com/2015/05/screenhunter_9119-may-09-19-04.gif?w=640
https://i0.wp.com/oi60.tinypic.com/2u54yo1.jpg
Willard F. Libby discovered the carbon dating method in the 1950s. He discovered the atmosphere contains a certain concentration of radioactive carbon to normal carbon. The radioactive carbon 14 atoms are generated within the earth’s atmosphere as illustrated below:
http://jesuscreated.org/Scientific/Carbon_Dating_files/image001.gif
http://upload.wikimedia.org/wikipedia/en/3/32/Carbon14-sunspot-1000px.png
C14 growth indicates weakening Earth’s magnetic field.
Very interesting, what is the specific reference (paper? book?) for this comment. You also said in your follow up comment that
“C14 growth indicates weakening Earth’s magnetic field.”
Your comments seem related with the observation that paleomagnetic excursions seem closely connected with abrupt climate changes,
http://www.paleomag.net/members/qingsongliu/References/EPSL/Thouveny%20excursions%20since%20400%20ka%20EPSL%202004.pdf
and some discussion here,
https://www.physicsforums.com/threads/geomagnetic-excursions-interglacial-termination-abrupt-climate-change.384098/
I’m convinced that Earth’s climate is presently very “sensible” to solar radiations, following them perhaps too closely.
Anything that happens in the Sun is almost immediately and importantly reflected on Earth’s climate.
One example are the polar icecaps, note how well both reacted to the relatively low level of radiations in first months of 2013, and how the increase of radiations in 2014 took its toll on the ice extent of the Arctic and the rate of increase of the Antarctic ice, especially in the 2nd semester of last year.
As far as I know the magnetic field of Earth continues to decline and the excursion of the NMP also continues (although I think it has slowed a little in the last couple of years).
Then, if the solar radiations really enter a prolonged phase of minimum as the majority of analyses suggest, we may have big cooling problems ahead.
There’s no such term (plural), in the context you’re using it in, as “radiations”. It is very rare, perhaps referring to types of radiation, or more than one radiating event.
OK! 🙂
Reading off one of the graphs in the first comment of RENs:
The Astrophysical Journal, 802:105 (14pp.) 2015 April 1
https://stevengoddard.wordpress.com/2015/05/09/dr-bill-gray-explains-why-climate-models-dont-work/
A marvelous article. ECS of 0.3+/-0.1, even assuming the back-radiation mechanism
ELECTRIC downpours RISE via RISING volcanic ash/COOLING, while less electrified light rains decline, and floods alternate with droughts, a clear precursor of a glacial
“The author cherry picked the start date of 1958, because it was the minimum in the US climate record.”
Thanks for pointing that out. Saved me a lot of work.
So was the marriage between William Libby and Leona Woods Marshall the result of carbon dating?
* * * ROFLOL * * *
What happened to all that permanent drought in Texas?
Didn’t you hear? Scientists now say there is a Sahara desert worth of sand buried in Texas. The drought lies below the surface grade where you can’t see it and above the filling aquifers waiting to pop up and cause all kinds of dryness.
Ha Ha! Excellent!
To think I used to subscribe to SA. Always thought that Sachs guy was kind of weird, so I just skipped him.
I enjoyed reading about the wide variety of topics and generally considered it a fun magazine; until 2009 and Climategate. I was waiting for them to weigh in and report that yes, Man-Made Global Warming “science” was nothing but political activism based on weak conjectures as practiced by a tiny minority of lavishly publicly-funded activists masquerading as scientists.
Didn’t happen; they doubled-down on the foolishness so I cancelled my subscription and haven’t so much as glanced at SA since. I had subscribed to them for well over 20 years. Were it not for updates on this blog, I wouldn’t know about anything they write.
Ditto on my Newsweek subscription and Newsweek has since went under. I wonder about the readership of SA… Up, down, stagnant? Did a quick internet check on their readership and came up snake-eyes; but didn’t try very hard. Anybody know how they are doing readership-wise since they abandoned their integrity?
Peoples should studies online, and earns their STFU-degree. Then they won’t be fooled by ‘dem smart scientists!
https://www.youtube.com/watch?v=PWKRwLTh5G4
That won’t be hard to do:
https://www.youtube.com/watch?v=p0wk4qG2mIg
Just amazing! The earth’s tilt means half of the circuit around the sun, it is tilted towards the sun and then away from the sun (gradually). Right now ice is actually melting, thank god, on the Northern Hemisphere because of this tilt which was probably caused by a collision between the earth and the planet that should have occupied the space between Mars and the Earth, which is when the moon was created thanks to this collision.
Failure to understand or care to understand or observe the world around them. The only people that would answer that question the way they did would have:
1. Never been curious enough to find out what a solstice or equinox is.
2, Never learned what the tropical lines on a globe mean.
3. Never observed that the Ecliptic (apparent path of the sun) changes in their skies with the seasons.
4. Never even realized that when it is summer in the Northern hemisphere it’s winter in the Southern.
5. Did not pay attention to when the longest day of the summer was announced as it always is all over the news and wondered why the period of daylight varies.
That, and the Earth’s axis being parallel to the Sun’s axis.
I read that we have 60-year wet/dry alternating cycles, and are nearing end of dry pd. that coincided with aggravating trends (urban sprawl) for water shortages. The next 60 year cycle begins in a few years, will be wet.
I think a past look at the trends as reported by the Farmer’s Almanac over all its years would show something similar. Look at this weather and the previous cycle, and compare that with the when the “Dust Bowl” occurred.
When I posted this I was greeted by this in return.
http://nca2014.globalchange.gov/report/our-changing-climate/heavy-downpours-increasing
Reblogged this on John Hargrove’s Weblog.