
Cross posted from my new blog : NASA Has Quadrupled 1955-1980 Sea Level Rise Since 1982 | Real Science
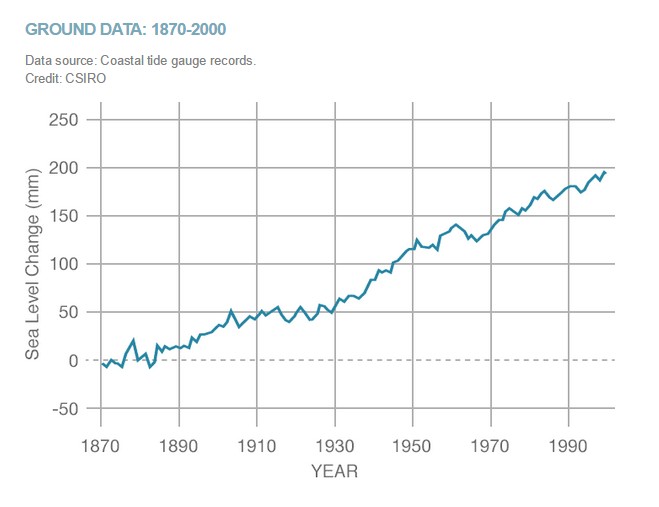
This is the current NASA tide gauge data, which shows 17 cm of sea level rise from 1870 to 1980, or 1.8 mm/year
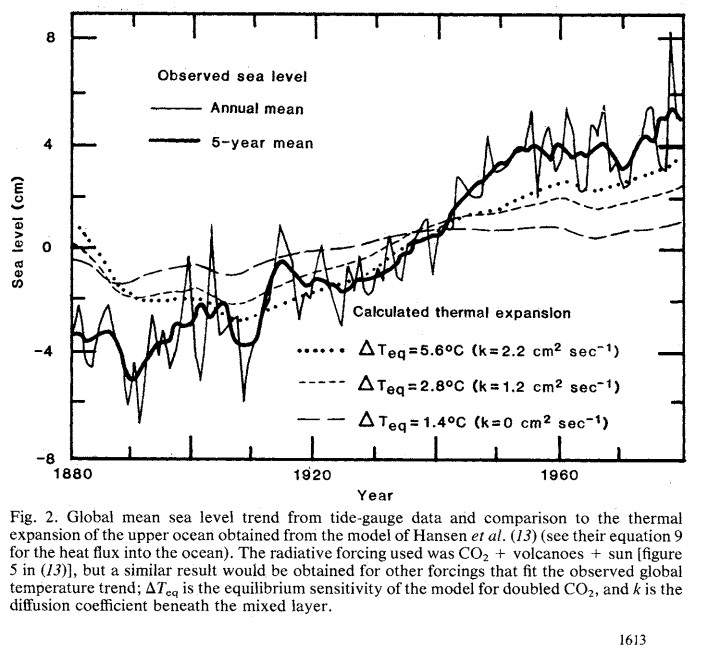
Here is the 1982 version, which shows about half that much rise.
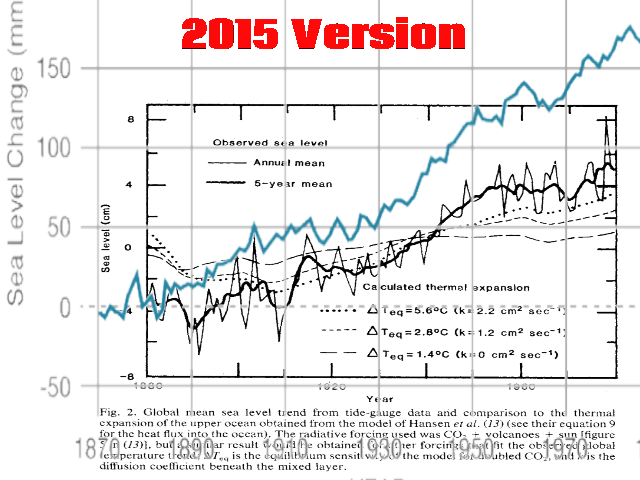
The next image overlays the two at the same scale, normalized to 1880, showing how the data has been altered since 1982.
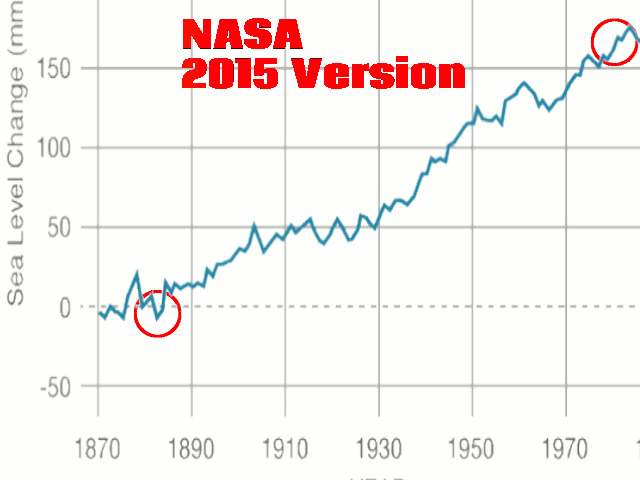
And here is an animation with markers.
This is bad, but it is much worse than it seems. The data tampering has accelerated as time went on. NASA has quadrupled 1955-1980 sea level rise since their 1982 version.


My father, Dr. Meinel, is rolling in his grave. He helped found NASA.
Reblogged this on rennydiokno.com.
Reblogged this on rennydiokno.com.
Falsifying public records is a crime. What will change things is a change in the political climate, not the natural climate, (though a change in the natural climate may bring about a change in the political climate.)
Then there will only need to be one, big “showcase trial”. Then plan further trials, but offer immunity to low ranking employees who will give evidence of who ordered the falsifying of public records, and how it was done. People will come out of the woodwork to testify against the people who corrupted science. There must be many who despise what has been done, but remain silent out of fear.
Haven’t you noticed that those in control don’t need to worry about being prosecuted for crimes they commit? Just HOW will (not could) they be prosecuted? Maybe the issue here is how do those who respect the law get control of the legal system again?
I have a question about sea level rise in general….
What few little glaciers we have are melting and are contributing to sea level rise….they can figure out how much the sea floor is rising of falling….they try to blame ground water use….thermal expansion they can measure…..etc
…but not one word about erosion, silting, sedimentation…..etc etc
Every farm is eroding and washing into the sea, every mountain, every coastline….
…and that is happening 24/7
http://switchboard.nrdc.org/blogs/aalexander/mississippi-delta-dead-zone.jpg
http://eatingjellyfish.com/wp-content/uploads/2012/05/montauk-erosion11.jpg
https://c1.staticflickr.com/9/8020/7412952026_05404e2ba6_b.jpg
Coastal erosion does not happen everywhere by any means. In fact in some places it goes the other way. In others there is virtually no erosion. And in others the change in the rate of erosion can be very dynamic when storms alter the sand bars and shoals.
24/7..
http://a.static.trunity.net/files/201101_201200/201165/thumbs/yangtzedeltaandshanghainasa_438x0_scale.jpg
I was curious about this once so I did the math on it. It comes to about 0.2 mm/year contribution from sediment transport. It’s not the majority of claimed sealevel rise, but it is significant.
http://blogs.kxan.com/files/2012/07/dust_from_Africa_July_2012_NOAA-2.jpeg
According to this reference, blown dust transport is ‘only’ ~couple billion tons of dust per year, which is a couple percent of river sediment transport.
Aaaaaand it helps if I actually post the paper.
http://www.limnoreferences.missouristate.edu/assets/limnoreferences/Kellogg_and_Griffin_2006_aerial_dispersal.pdf
Whoops, I misremembered a decimal point. It’s actually in the range of 0.02~0.05 mm/year.
https://docs.google.com/spreadsheets/d/1t8AdmoU_jcChSE1xaL-2JZkNa4zXN4dmjq_9zgel44k/edit?usp=sharing
I don’t buy it….erosion and sedimentation go on 24/7
What I do buy is that it doesn’t fit into their agenda
Even with their “adjustments” they can’t produce the spike that would be expected if there was the massive melting of the terrestrial ice sheets they and others keep claiming is happening. And I don’t think they will be able to falsify their own data enough to do so simply because unlike temperature the average person who spends time on the coast can gauge with their own MARK 1 eyeballs if their claims are justified.
The acceleration from 1930 to 1960 is not seen on any individual tide gauge, anywhere.
If I remember correctly this last winter Steven had a post showing a the beach at Fort Lauderdale, FL from the 1960s film ‘Where the Boys Are” in comparison to how that exact same stretch of beach looked at the present time and the similarity was striking.
I think what your looking at is the results of Dr. John Church and Neil White from one of their papers where they pick and choose what tide gauge stations they use and don’t use.
Here’s the CSIRO data page
http://www.cmar.csiro.au/sealevel/sl_data_cmar.html
Here’s the link to Church And White list of tide gauges
ftp://ftp.marine.csiro.au/pub/legresy/church_white_gmsl_2011_tg_list.zip
Here’s what I got when I compared an analysis I did using their stations and the one’s they threw out.
http://oi49.tinypic.com/ab78d5.jpg
I just need to make sure I understand what you are saying here. The C&W published value is 3.2 mm/yr, but the value you get from analyzing the very same stations they used is 2.4? Do I have that right? Any idea how they jumped from 2.4 to 3.2?
Please correct me if I am misreading your chart. Oh, and THANKS for posting it!
Jason
Thanks for your reply. My analysis isn’t going to be accepted by anyone because I’m a nobody with an Excel spreadsheet. BUT what I am illustrating is that when I use the same method to analyze The Church and White data, All the data, and the Data Church & White tossed out, I got some very interesting results. It seems that they tossed out stations that show little or negative sea level rise.
For example Church & White didn’t use the data from the Churchill Manitoba tide gauge. It’s the only gauge for a thousand miles and the data is current and goes back to 1940.
http://www.psmsl.org/data/obtaining/rlr.monthly.plots/447.png
Try this link to the Churchill data
http://www.psmsl.org/data/obtaining/stations/447.php
Hmmmm when I first hit “Post Comment” the image link didn’t work, now it does ????
Hey Steve! Yes, looking at your graph, your part makes sense. Sadly, we have seen way too many papers where the authors will pull out part of the data (the part that seems to support their conclusions) and leave out the data that would weaken their conclusion. The three trend lines you show seem to illustrate exactly that behavior on the part of C&W. I guess that my sense of outrage is so scarred and callused that I almost expect that sort of thing from the CAGW crowd. Still, I wonder what they did to the selected data they used, that managed to bump the trend from 2.4 to 3.2. Did they give some reason for the increase or did they just hope no one would notice? I am sure that you remember the old cartoon which shows a scientist with a long equation on a blackboard and squeezed into the middle is a step that says “And here a miracle occurs”. I just wondered whether they not only cherry picked data, but used a miracle in their calculations also.
(Oh, and yes, the image is coming through OK.)
The authors are quite right to throw out data that doesn’t fit, clearly they are anomalous outliers /sarc
It is man-made global warming after all.
Jason Calley says: June 1, 2015 at 5:46 pm
What do C&W do to bump it up to 3.2 mm/yr?
They get some mileage out of using the Peltier Glacial Isostatic Adjustment. Beyond that I haven’t a clue.
The southern half of North America is sinking due to the glacial rebound of the northern half. But more people live in the southern half so there are more gauges. It’s stupid to average tide gauges together.
And Church and White is what NASA uses as “Evidence for Climate Change.” I really can’t believe NASA can get away with not using sources that are beyond reproach.
What follows is my best recollection and paraphrased slightly, but about six years ago I was talking with a friend who is a strong believer in CAGW. I told him, “I keep hearing that the oceans are rising, that we are having more storms, that the world is getting hotter — but when I look around, things look pretty much the same to me that they were thirty years ago. I go to the beach and the ocean is still where it was and the buildings are not any closer to the water. How long do you think it will be until the changes are so obvious that anyone can see them?” He told me, “If it is not completely obvious in another five years, I will have to reconsider whether global warming is real.” Well, it has been six years, and he is just as certain as ever.
“Well, it has been six years, and he is just as certain as ever.”
That’s because the global warming industry and their allies in the MSM are very good at moving goalposts…
Or it could be that your friend is deluded…
In any case, when comes to changes in sea level, if the coastal water levels gradually reach a point that they impact land use, I think people will be smart enough to make the appropriate changes, like they have for thousands of years…
Reminds me of a reply given by (If I Remember Correctly) an Aussie coastal researcher of what to do about the rising seas.
“Just take one step back every 50 years or so.”
No religion has ever disbanded when the end times due date came and went.
Reblogged this on Climate Collections.
If anyone knows anyone who “believes” in human caused global warming, here is a site that will show them how wrong they are, not to mention they are only helping the evil UN with their agenda 21
http://whatreallyhappened.com/WRHARTICLES/climategate.php#axzz3b3vcGmeZ
After reporting NASA’s long track record of success at hiding from the American public the nature of the star that made our elements, birthed the solar system, sustained the origin and evolution of life and still controls Earth’s climate today, . . .
An intriguing and extremely well-done video response to “The Great Social Experiment of 1945-2015?
https://dl.dropboxusercontent.com/u/10640850/Social_Experiment.pdf
described this totalitarian rule of the world as “The Long Peace of 1945-2015:”
http://junkscience.com/2015/05/31/think-of-the-carnage-of-wwii-70-million-dead/
Are there no other options than
_ a.) Worldwide nuclear war
_ b.) Tyrannical world rule, or
_ c.) Fear of nuclear energy?
“The Nuclear Scare Scam:”
https://m.youtube.com/watch?v=ejCQrOTE-XA&feature=player_embedded
Steven’s criticism of NASA is somewhat misguided. Science is not a static and in many areas is undergoing rapid development of new understanding.
NASA ( in 1982) used the results of Gornitz et al, 1982 which estimated sea level rise from data from 193 stations (out of 700 possible) selected world wide as the best available measurement of sea level changes at that time and rejecting stations with records less than 20 years long or where staions were in seismically or tectonically active regions ( to exclude the effects of local and regional subsidence of the landmasses). Gornitz et al applied global estimates of some of the long term shifts in sea level but these were simplified corrections, not because they were lying but because they did not have any better data at that time
This data was not corrected for the longterm effects associated with glacial isostatic shifts in the landmasses of the earth which are still taking place as a result of the end of the last ice age. At that time altimetry data on a gloabal scale was not available ( TOPEX, JASON1 and JASON2 satellites had not been launched) and the global isostatic models which predict the global and regioanl movements of the earth’s landmasses had not been developed.
The more recent data which NASA has now put up as the current best available understanding at this point in time (2015, 33 years on from Gornitz et als estimate) is from the work of Church and White 2004, 2011. In the last 31 years considerable work has been performed in developing an understanding of the movements of the earth’s landmasses as a result of the ice sheets having receded at the end of the last ice age. These are still occurring (Lambeck and Johnston 1998; Peltier 1998; Milne et al. 2001). The Church and White results which are corrected for these landmass movements include the data used by Gornitz et al 1982, but in addition include the data Gornitz et al rejected because they were not able to correct the data for the effects of movements of the landmasses (and seafloor). Their data is also corrected for atmospheric pressure variations which Gornitz et al’s data was not as well as for changes in the mass stored in glaciers and ice sheets.
No one is lying, no-one is applying corrections which have not been scientifically developed and validated. The reason for the disagreement is simply a limitation in the methodology available when the 1982 estimates were developed and the subsequent development in the understanding of the geophysics of the Earth. All of the information above is available and referenced in the papers of Gornitz et al 1982. and Church and White 2004 and 2011. Steven you were right to question the fact that the results appeared to be different, they were!!
You could equally well have checked out, why they were different and that the difference was scientifically validated had you not been trying to bolster a conspiracy theory that NASA is out to deceive us all.
Reblogged this on Globalcooler's Weblog.
Reblogged this on CbFool.