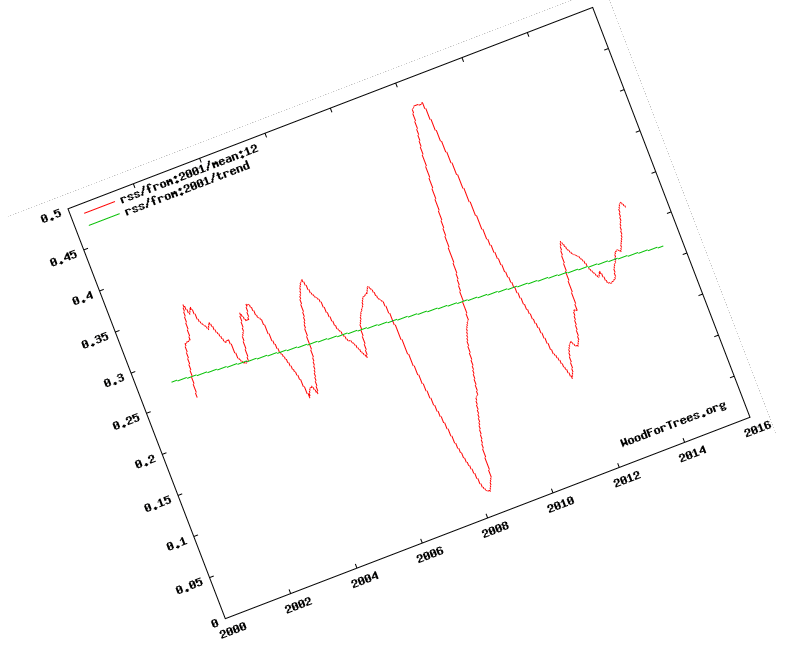
I was able to reproduce NOAA’s latest temperature adjustments, using the identical technique on satellite data
Disrupting the Borg is expensive and time consuming!
Google Search
-
Recent Posts
- Cheering Crowds
- Understanding Flood Mechanisms
- Extreme Weather
- 70C At Lisbon
- Grok Defending The Climate Scam
- “Earlier Than Usual”
- Perfect Correlation
- Elon’s Hockey Stick
- Latest Climate News
- “Climate dread is everywhere”
- “The Atmosphere Is ‘Thirstier.’”
- Skynet Becomes Self Aware
- “We Have To Vote For It So That You Can See What’s In It”
- Diversity Is Our Strength
- “even within the lifetime of our children”
- 60 Years Of Progress in London
- The Anti-Greta
- “a persistent concern”
- Deadliest US Tornado Days
- The Other Side Of The Pond
- “HEMI V8 Roars Back”
- Big Pharma Sales Tool
- Your Tax Dollars At Work
- 622 billion tons of new ice
- Fossil Fuels To Turn The UK Tropical
Recent Comments
- arn on Cheering Crowds
- Gordon Vigurs on Understanding Flood Mechanisms
- Gordon Vigurs on Understanding Flood Mechanisms
- Gordon Vigurs on Understanding Flood Mechanisms
- Disillusioned on “Earlier Than Usual”
- arn on Understanding Flood Mechanisms
- dm on Extreme Weather
- Mike on 70C At Lisbon
- Mike on Extreme Weather
- conrad ziefle on Extreme Weather


Yes! Obviously the temperature is increasing when the graph is viewed “correctly.”
oh come on….this is good news…
The found the missing heat…..it was hiding behind an adjustment and not the deep ocean
…and the adjustment means they haven’t been able to accurately measure temps for the past 20 years
People should be making fun of them and ragging them out on a rail…..
Thank you, Steven, for having the insight to see, and the courage to label, consensus science as BS.
I witnessed this deception over my entire scientific career, but I simply could not image that scientists would purposely deceive the public.
Climategate has been a real eye-opener to the reality of George Orwell’s “Nineteen Eighty-Four.”
Hear, hear. Steve has been a giant in demolishing the tsunami of spin, bull-shite and standing strong even against those who are sceptics. reminds me of John Daley.
By the way Tony/Steve (FFS can’t we narrow it down to one name?) the graph is hilarious.
Oh great. Riemann climatology.
Now CERN physicists seek their fair share of credit for “advancing science.”
http://wchildblog.com/2015/06/05/c-e-r-n-the-opening-of-the-abyss/
That angle still is not going to get us to Catastrophic warming. If you turn the graph 90 degrees you might have something scary.
Now that is a classic!
Now that is a classic!
Thanks, again we appreciate what is displayed here.
***If possible, I have a request –=–, something which you have done in part before
I would like to see at one location, or a regional set of temperature readings
(MINNESOTA WOULD BE GREAT, OR SOME PART THEREOF
where the temperature adjustment from the most current value is plotted on the ordinate
as a function of dates. perhaps five year intervals
An example to make sure that I am saying this correctly:——
. If a temperature graph or reading from say 1936 at some location.is available, then the 1936 point would be the adjustment from that value to the current value.
That would mean having the data available as it was presented in each of the five years
or any irregular time interval would be great.
I would expect to see negative adjustments in the 1930’s and increasing positive adjustments
in recent years
Then send a location where one such as me can send a little something to cover your expenses.
I think the graph I described would be very powerful and useful.
.
I
never a day when Mr Goddard does not make me chuckle.
I got a good belly laugh from it as well.
Sea Level same problem
https://youtu.be/8EMoU8OOsBs
min 7.28
OT
3
https://www.facebook.com/photo.php?fbid=10153209184009504&set=p.10153209184009504&type=1&theater
Steven Goddard has the courage to be a real scientist, like Marie Curie. Joseph Stalin, on the other hand was a real coward, like most bullies.
“Nothing in life is to be feared.
It is only to be understood.”
~ Marie Curie
The “1945 Stalinization” of science was based on FEAR of nuclear energy and the ill-fated decision to alter the foundations of physics to hide the source of energy in cores of galaxies, stars, some planets and all atoms heavier than 150 amu (atomic mass units) – NEUTRON REPULSION.
An intriguing and extremely well-done video response to our report on “The Great Social Experiment of 1945-2015?
https://dl.dropboxusercontent.com/u/10640850/Social_Experiment.pdf
describes this same period of time as “The Long Peace of 1945-2015:”
http://junkscience.com/2015/05/31/think-of-the-carnage-of-wwii-70-million-dead/
There is better option for the brave at heart than
_ a.) Worldwide nuclear war
_ b.) Tyrannical world rule, &
_ c.) Nuclear energy paranoia
“The Nuclear Scare Scam:”
https://m.youtube.com/watch?v=ejCQrOTE-XA&feature=player_embedded
That option is ACCEPTANCE of reality: Our fate is determined, not by Stalin nor our other political leaders, but by the pulsar at the core of the Sun that made our elements, birthed the solar system and sustained the origin and evolution of life!
https://dl.dropboxusercontent.com/u/10640850/Introduction.pdf
Reblogged this on Globalcooler's Weblog.
I could not understand your graph until I turned my iPad 45 degrees counterclockwise.