NOAA makes a large adjustment to the US temperature record based on Time Of Observation Bias. The idea is that most station operators were morons in the 1930’s, and reset their min/max thermometers in the afternoon – causing double counting of warm days.
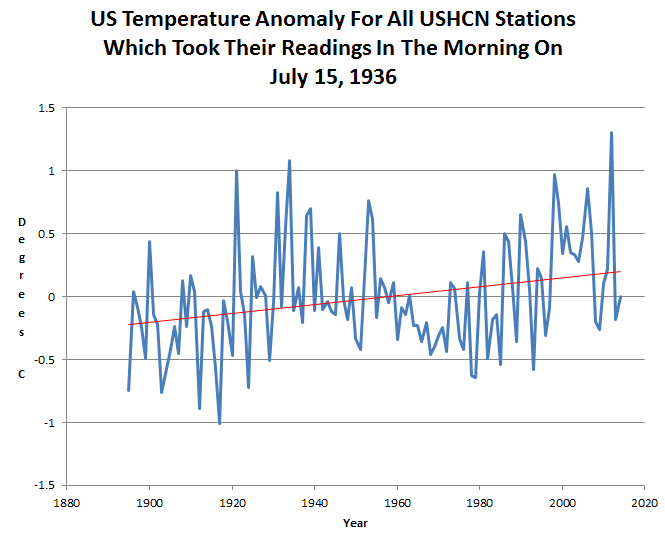
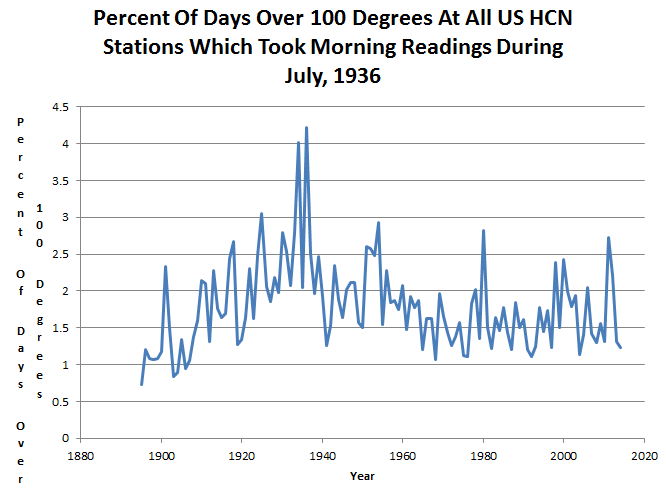
It is easy to test this, by eliminating all stations which took readings in the afternoon during July 1936.
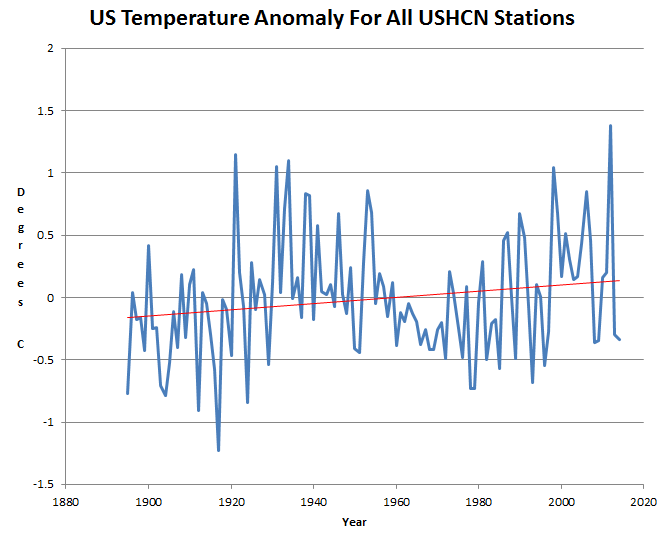
The set of all stations shows about 0.3C warming since 1895.
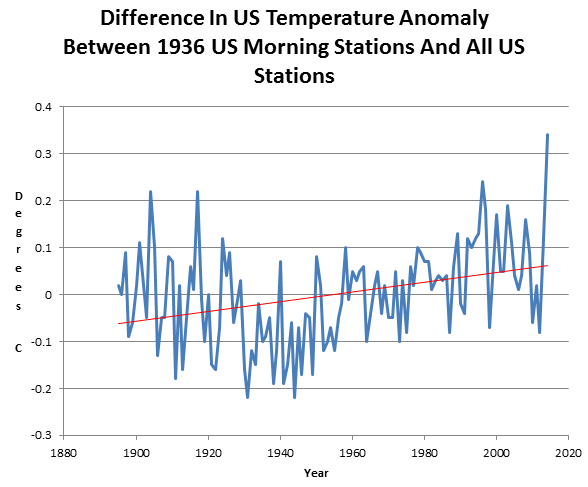
The set of stations which took morning readings during July, 1936 shows slightly more warming – about 0.4C. These stations are biased cold in the past, because they took their readings too close to the daily minimum.
The total bias caused by afternoon TOBS is a little more than 0.1C (0.2F)
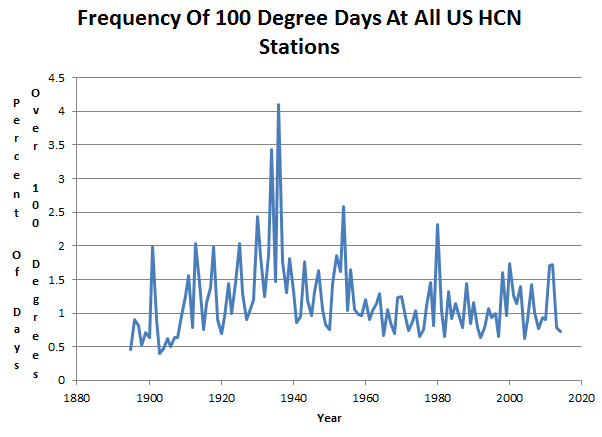
This is much less than the bloated adjustment used by USHCN. But what about hot days? Did afternoon TOBS cause double counting of hot days in 1936? The evidence shows that there was little if any such effect. The trend is almost identical between the two data sets.
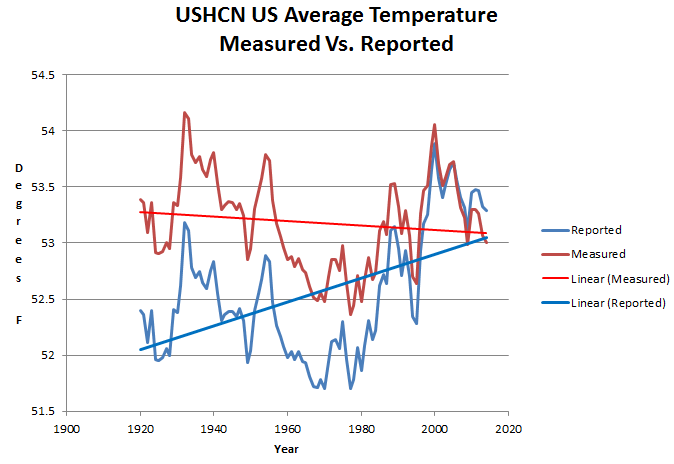
The total NOAA adjustment is nearly two degrees F. It is unsupportable nonsense, and fraud.


Goddard is genius. Him and Watt should be taught in schools.
The liar-in-chief wants data to support his war on civilization. (energy == civilization)
The climate czar delivers what the liar-in-chief asked for. (As any good minion would)
Science? Facts? Accurate data? Surely you jest! Political grandstanding, image, pomposity and speech-making are far, far, more important to the folks occupying Mordor-on-the-Potomac (DC).
After the Paris insanity conference, silly season (presidential puppet campaigning) will begin.
You are right, shazaam. You describe the recipe by which Stalin successfully destroyed the integrity of science and sovereign governments in the West after combining nations and national academies of science (NAS) into a giant, worldwide “Orwellian Ministry of Consensus Science (UN)Truths“ on October 24, 1945.
It doesn’t matter what time of day you observe and reset a mix/max, so long as you do it the same time every day. These old farmers all had strict routines…milk the cows, feed the pigs, check the thermometer, shovel the barn….
You will get a different annual value if you reset in the afternoon than if you do in the morning.
Morgan:
The potential TOBS problem is this:
Let’s say you read the min and max settings each day at 5pm. On a hot summer day you might get a 95F reading. You reset the max setting, but it quickly goes back to, say, 93F. The next day is substantially cooler, only rising to 85F. But when you go out to read it the next day at 5pm, you will have a 93F reading. This would bias the temperatures “up” on average over a month or year.
If you read and reset in the morning, you will have an equivalent problem with the “min” readings. This would bias the temperatures “down”.
But, as Tony never hesitates to point out, the volunteers motivated enough to do these readings in the first place would almost invariably be motivated enough to do an additional morning reset of max if doing afternoon readings, or an additional afternoon reset of min if doing morning readings.
The TOBS adjustments made by NCDC, NOAA, and the like assume that no one did the second daily reset. Tony is providing strong evidence that this assumption is wildly incorrect.
from the seventies we started with temp. recorders which take temperature every second
If you want to know what is going on with climate
look at minima or maxima
means is a bit confusing because of interactions on earth
https://i0.wp.com/oi62.tinypic.com/33kd6k2.jpg
Nice parabola.. but if you fit a linear trend, it is definitely still warming.
Well according to the alarmista, anyway! 😉
You have to read the graph from right (past) to left ( to the present).
It is like somebody throwing a ball?
Everything perfectly natural. Conclusion: there is no man made warming. None whatsoever.
I was joking Henry 😉
Pretending to put a meaningless linear trend through it… like an alarmista would. 🙂
ps, over what period is each rate calculated? I notice the time periods vary.
And can you put in ALL the yearly points rather than just the chosen 4 years , please.
Good post about GISS “adjustments™” on Paul’s site.
https://notalotofpeopleknowthat.wordpress.com/2015/07/29/massive-tampering-by-giss/
GISS “adjustments” are only the last futile attempt to hide “NEUTRON REPULSION: The force used for creation, destruction, preservation and redemption.”
Thanks to Max Planck’s 1944 speech in Florence, Italy on the nature of matter, we now have absolute assurance humanity will survive this seventy-year (1945-2015) effort to take totalitarian control of the globe by combining sovereign nations into one United Nation on October 24, 1945.
https://dl.dropboxusercontent.com/u/10640850/Assurance.pdf
This is humanity’s assurance Big Brother is going down !
What is the real value of TOBS? Trillions of dollars.
Hmmm. Much like most of today’s “doctors” in medicine believe that our “primitive” ancestors knew nothing about health and its maintenance.
Why does this mentality have so many recesses in high places to hide in??? (Answer: Money and politics!)
Just as a sidelight, this afternoon it was 95 degrees on the shores of James Bay and 90 on the shores of Hudson Bay. Reggie’s blowtorch must be at work on the Hudson Bay ice. But the heat wave is short lived with temps going back to below normal within the next couple of days.
will be real interesting i those areas next year if all the current ice does not melt out. multi year ice in both regions would cause serious problems if it becomes persistent.
TOBS adjustments + Tom Karl’s pesky Ship Buckets make 2015 the HOttest EVeR!!
That’s some shitty statistics. For god’s sake, read up a little on advanced regression, trend identification, trend uncertainty, spurious regression, etc.
Moron alert.
According to NOAA, “The TOB is only of concern with regard to temperature trends because there has been a widespread conversion from afternoon [warm bias] to morning [cold bias] observation times in the USHCN”, i.e. switch from hot bias in past with afternoon readings to cold bias more recent.
http://www.ncdc.noaa.gov/oa/climate/research/ushcn/
justifying their adjustment lowering past temps, but I would like to see data on that change from afternoon to night and how significant, or how many stations, also hard to see them even having older reported data on supposed afternoon to morning “switch” for foreign stations or are they just applying a biased proxy?
In any case, likely few adjustments would be needed. The time of day observation are heavily bi-modal with the vast majority of readings taken around 7-8 am and 5-6 pm before reset with only a small percentage around earlier times where double counting would theoretically occur.
http://1.bp.blogspot.com/-8FeBwyTVpjk/UBmuRHhhkGI/AAAAAAAAAEA/hmpSZnArAOI/s400/tob_fig3.png
TOBS should be small at best.
Bias would also increase with a lower diurnal temperature range, also less a factor for rural stations versus urban.
The trend (US only) from morning to evening observations is bottom p. 996 ftp://ftp.ncdc.noaa.gov/pub/data/ushcn/v2/monthly/menne-etal2009.pdf
It begins circa late 1950’s and there should be no TOBS adjustment say 1920-1960, and some looks like some non reported time of day measurement being replaced by morning measurements over time. It is also based on grouped AM versus PM measurements – but really need exact time of day, switching from say 8 pm to 8 am should not matter or cause bias relative to say switching from 4 pm to 6 am, and I would also venture to guess most morning readings happen after sunrise and peak daily lows, so not just bifurcated AM versus PM.
They state, “The net effect of the TOB adjustments is to increase the overall trend in maximum temperatures by about 0.015°C decade?1 (±0.002) and in minimum temperatures by about 0.022°C decade?1 (±0.002) during the period 1895–2007.” which is not too far off Tony’s estimate.and minor. But still, you have a old static proxy of bias, and apply it to the switched time of day measurements increasing closer to current, but I would assume the more modern stations with better equipment report more accurately than older data without double readings.
I think massive government/Galvin the magic mathematician cooking/”adjusting” the temperature books is less TOBS, but more UHI, dropping stations, and filling in data. The gig is up, all that accurate RSS satellite data deviates more and more everyday from the cooked books, and even state of art USCRN stations NOAA put up in 2005 show cooling which they will have to rectify differences with their adjusted data and constant propaganda put out to press on “hottest … ever”
http://www.forbes.com/sites/jamestaylor/2014/06/25/government-data-show-u-s-in-decade-long-cooling/
I really want Galvin to get grilled before Congress on the adjustments, made up data, and deviation with RSS and USCRN, This fraud in the data needs to be exposed before more politicians feel at ease to jump the AGW boat, but can give Tony Abbott down under a hands up, as opposed to all the green energy, solar, electric car firms in US with lobbyists milking the gov subsidies and giving contributions corrupting politicians who also want to play out to misinformed environmental groups, it is not just fraudulent scientists following research dollars, we have huge fortunes and corporations almost entirely dependent on this fraud (e.g. look at Elon Musk and Tesla Motors and SolarCity, et al).
I’ve posted the link to USCRN data many time, (I’m at work at the moment and don’t have the link or calculation spreadsheet here).
Since 2005, USCRN shows a cooling trend of 0.23ºF/decade (iirc)
It does? IT DOES? Oh shit, oh shit, oh shit, oh shit. BURN MORE COAL.
Here is the link..
http://www.ncdc.noaa.gov/temp-and-precip/national-temperature-index/time-series?datasets%5B%5D=uscrn¶meter=anom-tavg&time_scale=p12&begyear=2005&endyear=2015&month=7
What will July USCRN come in at… from comments, reports etc etc, I’m guessing around 0 – 0.3ºC.
If I’m wrong , I promise to have another bottle of red. 🙂
note, if you go to that link and ctrl-select ClimDiv and USHCN, you will see an amazing, unbelievable match between all 3 data sets.
For those who haven’t figured it out… that CANNOT be real.
There is ABSOLUTELY NO WAY in which the three data sets, from different measurements systems, can be that closely aligned.
There is MAJOR fudging going on !!!
ps, and the people doing it are just WAAAAAY TOO CLUELESS to realise that they leaving their adjustment fingerprints all over the place.
But that’s NOAA for you. 🙂
from a WUWT post
http://wattsupwiththat.com/2015/03/06/can-adjustments-right-a-wrong/
After reading Zeke’s blog post, I could find nowhere the affect made to the monthly data you are posting here. Zeke ‘says’ At first glance, it would seem that the time of observation wouldn’t matter at all. After all, the instrument is recording the minimum and maximum temperatures for a 24-hour period no matter what time of day you reset it. The reason that it matters, however, is that depending on the time of observation you will end up occasionally double counting either high or low days more than you should. For example, say that today is unusually warm, and that the temperature drops, say, 10 degrees F tomorrow. If you observe the temperature at 5 PM and reset the instrument, the temperature at 5:01 PM might be higher than any readings during the next day, but would still end up being counted as the high of the next day. Similarly, if you observe the temperature in the early morning, you end up occasionally double counting low temperatures. If you keep the time of observation constant over time, this won’t make any different to the long-term station trends. If you change the observations times from afternoons to mornings, as occurred in the U.S., you change from occasionally double counting highs to occasionally double counting lows, resulting in a measurable bias.
To show the effect of time of observation on the resulting temperature, I analyzed all the hourly temperatures between 2004 and 2014 in the newly created and pristinely sited U.S. Climate Reference Network (CRN). I looked at all possible different 24 hour periods (midnight to midnight, 1 AM to 1 AM, etc.), and calculated the maximum, minimum, and mean temperatures for all of the 24 hours periods in the CRN data. The results are shown in Figure 4, and are nearly identical to Figure 3 published in Vose et al 2003 (which was used a similar approach on a different hourly dataset).If you keep the time of observation constant over time, this won’t make any different to the long-term station trends. If you change the observations times from afternoons to mornings, as occurred
in the U.S., you change from occasionally double counting highs to occasionally double counting lows, resulting in a measurable bias..
If the TOA does not trend in the monthly average, then a single change in time of observation would not change more than the month in which the time change was made in. His study only looked at the daily temperature changes based on TOA. He never shows how much it would change the monthly average, most likely because it doesn’t.
thanks for that link andy, as you say, beyond remarkable !
Reblogged this on Climate Collections and commented:
Tony Heller provides a cogent analysis of historical data and NOAA’s current practice of modifying it for a dubious reason–Time of Observation Bias (TOBS).
AndyG55 says
And can you put in ALL the yearly points rather than just the chosen 4 years , please.
Henry says
I have 4 points for the speed of warming. It is enough for me to determine the trend.
You just have to understand how I obtained the data:
54 weather stations
balanced by latitude (to ca. zero)
(longitude does not matter as long as we look at the change in temperature per annum, do you know why?)
My Rule no. 1: I decided to look at the change of weather (temperatures), rather than absolute temperatures.
As an example I [can] attach my [separate] result sheet for George (South Africa).
My original data come from http://www.tutiempo.net
I specifically used the data from this website as I distrust the various Anglo Saxon websites, like BOM, NOAA, Best, etc.
You can type in the city that you are interested in and search the website.
In the case of George, the link to the original data is here:
http://www.tutiempo.net/clima/George_Airport/688280.htm
It gives the average yearly mean, max. and min. temps, in that order, as per the first three columns.
I copied that data to my Excel sheet, as attached.
For the years with missing data (red), you have to go to the individual months and look at every month’s average. Click on the relevant (blue) year and chose the month.
(for the results: see far below in the file, (that I can attach) 1983, 2002 and 2005)
[For months with less than 15 days data I applied the rule that I would rather take the average of [same] month of the preceding year and the following year, thereby adhering to Rule no. 1]
The overall result for George is an average decline of -0.0131K per annum since 1978, that is -0.5 degrees C, in total, since 1978, as shown in the graph (blue line)
(the value before the x)
By selecting different periods of data [in the graph] you can get the various inclines/declines from more recent times {i.e. the values before the x}, getting at least for 4 points for the speed of warming/cooling.
George is just one single result in my files.Let me know if you there is anything that is not clear to you as to how I obtained the data.
please provide a graph with each year value on it as a dot
Theoretically, you can do a regression for any station for all the data from any year but I chose
a) beginning of data
b) 1980
c) 1990
d) 2000
but with 100% correlation, when we throw the whole bunch together, that would be a waste of time
(speaking as a statistician)
because the end result would be the same.
please provide a graph with each year value on it as a dot
3 points, you will always have R² = 1 for a parabola, so getting the R² = 1 for the extra point, particularly when you use different intervals…… meaningless.
Please provide a graph with ALL year value on it.
??? There is no “double counting” however the thermometers are reset. Changing the clocks for daylight savings does NOT confuse the milk cows, and resetting the thermometers does not change the absolute values of the highs and lows. There will still be the same 365 highs and 365 lows for the year. The only difference is that if the reset happens between the daily low and high, then the recorded high for that date will the number from the previous afternoon. But the absolute value of the low and the high will be the same, just one day off. There is no bias. The yearly average will be identical because the readings will be unchanged.
@andyg55
did you catch my approach to the problem?
Mind you, the global cooling bit is not much,
ca.-0.009K per annum since 2000
[on minima]
= -0.135K since 2000 in total.
it is significant though if you want to relate increase in CO2 [still happening?] with increasing minimum temperatures [not happening]
which is what AGW was about….
Andy says
3 points, you will always have R² = 1 for a parabola, so getting the R² = 1 for the extra point, particularly when you use different intervals…… meaningless.
Henry says
I know my mathematics…yes….
but I have 4 points from a random sample which I know is sufficient to determine the trend.
[1973 is the average of the beginning of data for all 54 stations]
Not only that, from those 54 stations I have compiled 3 data sets: minima, maxima and means.
for maxima the drop in maximum temps. is best given by:
y=0.039 ln(x) -0.1112
rsquare= 0.9964
where y=K/annum
If you look at that graph, you just know that the [global] cooling now going on, must come to a dead end stop?
\
http://www.woodfortrees.org/plot/sidc-ssn/from:1972/to:2016/offset:10/trend/plot/sidc-ssn/from:1927/to:2016/plot/sidc-ssn/from:1927/to:1972/trend/plot/sidc-ssn/from:1927/to:2016/trend
Gleissberg mean anything to you?
We can only hope that we donot miss the switch
-which in fact has happened in the past, leading to, in my opinion, the LIA
Mind you, for those of you rejoicing in my prediction of the end of global cooling soon, please remember that there is a big lag of at least 7 years in what happens on the sun and what happens on earth. So brace yourselves for another decade of growing coldness. Pray that all planets arrive in time to make the switch on the sun.
\
http://www.woodfortrees.org/plot/sidc-ssn/from:1972/to:2016/offset:10/trend/plot/sidc-ssn/from:1927/to:2016/plot/sidc-ssn/from:1927/to:1972/trend/plot/sidc-ssn/from:1927/to:2016/trend