
NOAA has 16 USHCN stations in Maryland, but they have stopped collecting data from all but four of them. One of the disappearing stations is at Laurel, which has been collecting since 1895 – but no data reported since August 2015.
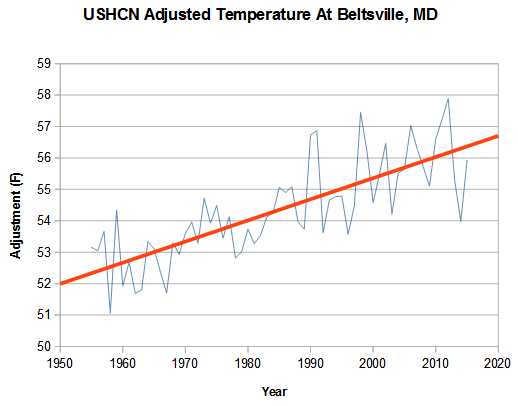
Laurel raw data shows no warming over the past 60 years, but Beltsville (at I-95 and The Beltway) is five miles closer to Washington DC and shows two degrees warming during that period as the city has expanded. Beltsville is one of the four stations still reporting.
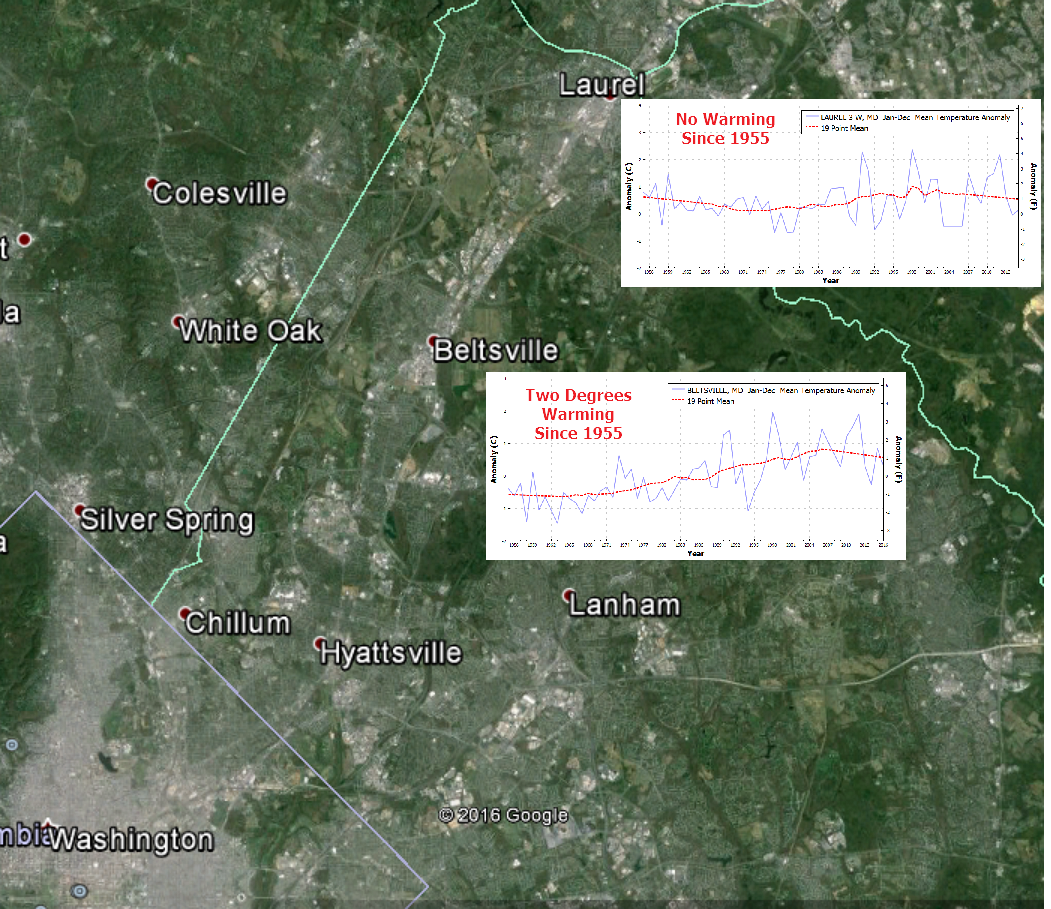
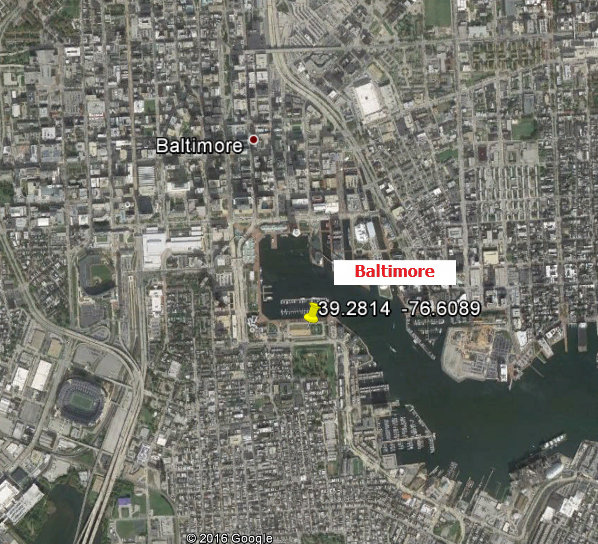
The fact that 75% of the stations in Maryland are missing doesn’t stop NOAA from fabricating temperatures for the 12 missing ones. Laurel is located midway between Washington DC and Baltimore, where another one of the four active stations is located.
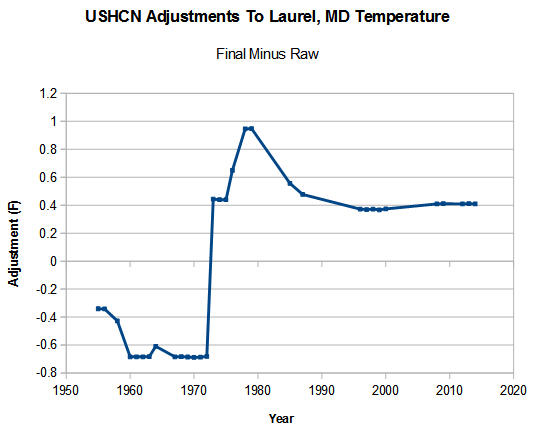
NOAA generates the fake Laurel temperature data by interpolating from the neighboring stations, which in this case would be UHI infected Beltsville and Baltimore. The graph below shows how Laurel temperatures are adjusted by USHCN. They cool pre-1975 temperatures and warm post-1975 temperatures. The exact opposite of what would be expected.
But here is where the NOAA fraud really gets ugly. Beltsville raw temperatures have warmed two degrees over the last 60 years due to Urban Heat Island effects. But instead of adjusting recent temperatures downwards to compensate, they do the exact opposite and massively cool the past.
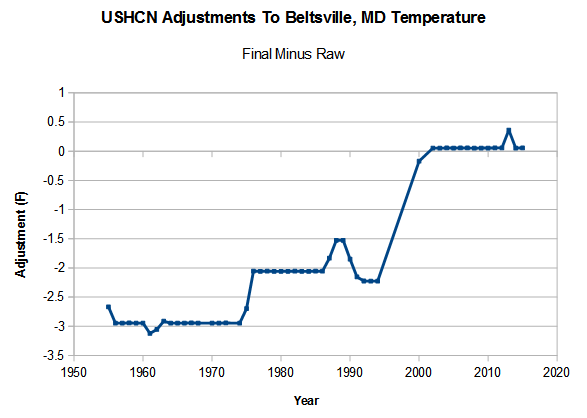
The final temperature graph for Beltsville shows almost five degrees warming over the past 60 years, when in fact there has been none.
This level of fraud defies explanation, but is standard operating procedure at NOAA and NASA.

The full extent of the fraud in government agencies is mind-boggling. We now seem to be escalating toward awareness of totalitarian control of society. I have had limited ability to comment after my Disqus and ResearchGate accounts were locked.
I am pleased to report notification today that the paper showing the Sun is the creator and sustainer of every atom, life and planet in the solar system – “Solar energy” (Submitted to Advances in Astronomy, 1 Sept 2014) – was reviewed and published elsewhere on February 11, 2016.
That paper is the conclusion to the research assignment I received from my research mentor, the late Professor Paul Kazuo Kuroda (1917-2001), in 1960.
Great Lakes current temperature.
http://oi67.tinypic.com/34q5lyq.jpg
Thanks, Ren, for showing the big picture, including (below) galactic radiation and pressure in the stratosphere. That’s is what brought me -5C in Missouri.
Strong growth galactic radiation and pressure in the stratosphere.
http://www.cpc.ncep.noaa.gov/products/stratosphere/strat-trop/gif_files/time_pres_HGT_ANOM_JFM_NH_2016.png
The jet stream will fall to the south.
it’s the same in colorado. they like ft collins of course, but they aren’t thrilled about cheesman
http://papers.ssrn.com/sol3/papers.cfm?abstract_id=2631298
Maybe it’s time we start a milk carton campaign for USHCN stations.
http://www.climatechangedispatch.com/images/pics4/milk_carton-GW-missing.jpg
It what you get when you drink homogenized milk instead of raw milk. I drink raw milk. 🙂
Kind of like homogenized data vs. raw data? The cream rises to the top with the raw and tastes delicious.
Well done!
NOAA proselytes create their own fraud…
https://www.youtube.com/watch?v=qXw9hekeSvI
A local police department that investigated the November incident outside BLM Colorado’s headquarters in Lakewood, Colo., said it found no criminal wrongdoing and has long since closed the matter. What’s more, the Lakewood Police Department said, the Nov. 12 incident appeared to have been “staged” by the groups, and the protester pretended to have been struck by the SUV, a police spokesman said…”It appeared to our people that this incident appeared to have been staged.”
http://www.climatedepot.com/2016/02/10/police-environmentalists-appear-to-have-staged-suv-hitting-climate-protester/#ixzz3zroBmqCO
Sue them!
Isnt that what Americans do.
As usual, what they do makes no sense whatsoever. Though Laurel has had quite a bit of development as well. Maybe the actual readings are taken somewhere away from the suburban sprawl in Laurel, but not in Beltsville. If I knew exactly where the readings are taken, I could get some pictures because I live no more than 10-15 minutes from either address.
The real joke are the main stations, BWI and Dulles. Those were very rural in the 1960’s, but they are quite built up now. It is obvious they should warm the past and cool the present, but I would bet my last nickle that they have done just the opposite,
At least for the future in the US, NOAA will have difficulty justifying “adjustements” if they disagree with the USCRN. So far it seems they have been careful not to show any discrepancies in recent years. Over time this should fix the problem for the US, but we need a GCRN for the rest of the globe.
“adjustments”
Possibly one of the most telling sites in the world, or at least the Northern Hemisphere, is the weather station at the top of Mt Washington in New Hampshire at an elevation of 1,912 meters (6,274 feet). It shows no upward trend in annual average temperate at all since 1949. To me this MAJOR discrepancy is enough to invalidate the whole CAGW hypothesis.
https://oz4caster.files.wordpress.com/2016/02/figure-4-mt-washington-annual-temperature-trend-1949-2015.gif
I can’t type this morning. temperate=>temperature
What happened to global warming? Not really much to it.
Even then, it looks like that USHCN station atop Mt. Washington is surrounded by concrete structures, so it may, too, be “UHI’d.”
I was up there last year. They have a traditional Stevenson screen, and it is right next to a concrete building wall. So it’s possible. But I have to tell you, when it’s 20°F and 70 MPH winds, I don’t think the radiative effects of the concrete are doing very much. There is just such a huge volume of air all the time, such effects should be about zero except for still days, which are exceptionally rare up there. The station is on the ENE side of the round building you see in the satellite photos. So it could get some direct sun in the morning, but not much.
About how old do you think that concrete building might be?
I’d guess built in the 70’s. Kind of a modern + rustic feel.
And I should also say that if you ever get a chance, take the cog train up the mountain. It was one of the coolest things I’ve ever done. No pun intended. Pick a day with high pressure if you want to see.
I think that “Release v. 1.3” could be a biggie. Tony, is there a Mac-app for that yet? My Mac chokes on it as it is now. In this culture, paper is everything and being able to show, unequivocally, the rural v. UHI’d differences could do it. Might even be big enough to sink a Hillary.
I have a Mac version, and in fact did most of the development on a mac. I just haven’t figured out how to package it yet.
I second that about the mac version.
It would be nice to be able to sort time of observation, so that only stations with the correct time readings could be used, to show just how bad the TOB has been tampered with
tried on my old pc (vista) and it’s still processing
That makes me want to try it on an old XP machine
Incredible!
Brilliant work Tony
Note to foreign readers: UHI means Urban Heat Island, a metropolitan area that’s a lot warmer than the rural areas surrounding it. ICU, ilha de calor urbana, isla de calor urbana
Fortunately there are a few honest scientists left at UAH and RSS.
http://www.eenews.net/assets/2015/03/25/document_pm_04.pdf
gallop,
Thanks for the link. Excellent summary.
All over the USA Climate Stations like Laurel MD are failing to perform for NOAA and are having to be replaced with ones that deliver the (UHI) Goods like Beltsville. A minimum performance criteria has been set at 2 degrees per half Century.
Just go back two or three years we have increased CO2 by 2.07 in 2013, by 2.17 in 2014 and by 2.89 in 2015. In the US alone we have actual cut our CO2 output (we have done this thru the use of natural gas, and have cut our coal use from 40% of electric production to less than 30% just in the last 3 years. We drove less miles in our cars. The europeans have done much the same.
In 2015 the world economies have all but come to a stand still
Yet NOAA shows the largest average increase in CO2 for 2015, on Mauna Loa, out pacing any years since they started measurements.
http://www.esrl.noaa.gov/gmd/ccgg/trends/gr.html
Something is not right
Scott,
Interesting; but miles driven is actually up just a bit: http://www.advisorperspectives.com/dshort/updates/DOT-Miles-Traveled.php
Nevertheless, those CO2 numbers do look fishy…
The Oceans (warm surface, El Nino year) may have increased CO2 output. Humans are a small percentage of the total.
Let’s not lose sight of water vapor. Dropping that from the context changes a conversation about GHGs to one about transfer payments from relatively free countries to looter dictatorships.
You are correct, I was looking at adjusted miles which is down almost 10% from its 2005 peak.
Even with out the adjustment with a peak year of 2005 the total unadjusted miles drops dramatically until around 2010 and doesn’t return to it previous 2005 high until 2015.
But Moana Loa climb in CO2 still shows still shows over 1.5 to 2.2 increase over that time period.
So in one sense we have gone back to 2005 levels of CO2 output without a reduction in the rate of growth, according to Moana Loa
Has anyone run a comparison of ignored sites vs. used sites?
If the trends from all the recently closed sites were averaged, and the trends from the open sites were averaged, they should be almost identical. Somehow, I’m guessing they wouldn’t be.
Off topic-
Remember Patricia? It was that Mexican hurricane last year that couldn’t even knock over a beach umbrella with it’s alleged 150 mph winds. It’s been upgraded:
http://www.nbcnews.com/news/weather/hurricane-patricia-strongest-storm-ever-measured-hit-mexico-n449731
These people really don’t have any shame.
Anyone else come across this fine piece of
specious drivelclimate “science” courtesy of data Mannipulater Zeke Hausfather over at Judith’s place?https://judithcurry.com/2016/02/09/assessing-u-s-temperature-adjustments-using-the-climate-reference-network/
I really hope I live to see day when the likes of Hausfather, Mosher, Venema, Mann, Hansen, Trenberth, Karl, Cowtan, Way, Cook and the truly vile Loopy Loo Lewandowski are held to account for their crimes against humanity in general and science in particular, nailed to a fence and left to dry up in the Sun.
And hey, I’m feeling quite charitable at the moment!
I told people ages ago that USCHN was being adjusted to data-match USCRN for the SPECIFIC PURPOSE of using the adjusted series to say that pre-2005 USCHN was ok
Zeke is either fooling himself or is knowingly lying about the same procedures being used pre-2005…
I suspect the latter.
I read it as Zeke saying .. yes we adjusted USCHN to match USCRN..
ie he is admitting to DATA FRAUD.
catweazle666, your anger toward those who deceived us after nations were united on 24 October 1946 is understandable, but . . .
Society would be better served if we forgive those who deceived us and move as quickly as possible to restore integrity to government science and constitutional limits on formerly national governments.
I agree that this is shameful shamanism by federally employed managers with a stable full of true believers. However, my federally funded research is totally accurate and even then I dread that I have made a mistake. These climate opportunists are a breed I know well. What they claim is clearly not true.
O/T
Anybody seen this? Earth is absorbing sea level rise like a sponge:
http://www.breitbart.com/environment/2016/02/11/nasa-study-sea-level-rise-absorbed-by-earth/
Satellite measurements over the past decade show for the first time that the Earth’s continents have soaked up and stored an extra 3.2 trillion tons of water in soils, lakes and underground aquifers, the experts said in a study in the journal Science.
They are speaking of GRACE, which has only been up for about a decade. Amazing that they can know that this is “the first time ever”.
Researchers learned that the “water gains over land were spread globally, but taken together they equal the volume of Lake Huron, the world’s seventh largest lake,” said a NASA statement.”
The Ogallala Aquifer alone is larger than Lake Huron, and is being depleted like many other aquifers. Many artesian aquifers stopped gushing due to the number of wells that tapped them, and this was a well established fact half a century ago.
Breitbart parroting more nonsense.
” “the first time ever”.”
in the last 20-30 years.
“Breitbart parroting more nonsense.”
Yep, he loves parroting their nonsense back at them….. mockery is great tool 🙂
At least Watts shows a little skepticism.
Is there anything global warming can’t do? Now it seems that there is so much global warming that it is slowing the rise of sea levels.
And frrom the abstract…
Recent advances in satellite measurement of time-variable gravity combined with reconciled global glacier loss estimates enable a disaggregation of continental land mass changes and a quantification of this term. We found that between 2002 and 2014, climate variability resulted in an additional 3200 ± 900 gigatons of water being stored on land. This gain partially offset water losses from ice sheets, glaciers, and groundwater pumping, slowing the rate of sea level rise by 0.71 ± 0.20 millimeters per year.
So they are using the flawed GRACE measurements to construct, wait for it, a model!
Poor little baby model probably believes in Santa too.
The earth has not absorbed any water. The level in Lake Michigan and Lake Huron is down over 6 feet since the 1860’s and the other Great Lakes have gone down too but not as much, we are pumping ground water at an increasing rate and in some areas on the earth the underground water is too gone. Some fresh water lakes in asia have dried up completely.
The scientists who did the study used satellites to determine this, I thought, according to NASA satellites we not reliable to calculate tempatures and so we must rely on ground based tempatures. Now we have ground based water gauges which show a drying of the planet but now those are unreliable so we have to use satellites.
They used this study to cover up the fact that the sea level is not rising as fast (or at all) as their models predicted.
According to the world banks website we have seen only a slight increase in rainfall over the past 50 years.
… according to NASA satellites we not reliable…
.
They fixed that with models. Models make the world go ’round.
Gaia can tell which water molecules come from melting glaciers and soaks them up. If they come from somewhere else She lets them run down the hill. Not even Lovelock could guess how clever She is.
Gaia is retaining water? Maybe some support stockings are in order… Or is she pregnant?
Meanwhile, SA goes full retard:
http://www.scientificamerican.com/article/climate-change-has-shifted-location-north-south-poles/
Dis-GRACEd model again…
GRACE’s twin probes measure changes in the Earth’s gravity field, which can be used to track shifts in the distribution of water and ice. Chen’s team used GRACE data to model how melting icecaps affect Earth’s mass distribution. They found that recent accelerated ice loss and associated sea-level rise accounted for more than 90% of the post-2005 polar shift.
I had a childhood friend who used to build models of superheroes and monsters, but that still did not make them real.
http://www.lowbudgetrecords.com/Model%20Museum/images/Big%20Wolfman%20CU%20liv%20room.jpg
So they hypothesize that the presumed Greenland ice loss is shifting the location of the pole and then they use the measured pole shift to support the Greenland ice loss estimates.
Brilliant. I must try this technique on my wife next time I want to buy another gun.
The following is true, but I have no idea what its significance may be. I noticed in the autumn of 2015 that my mobile weather app began to show the temperature for my area as 70-72 degrees all the time. The reporting station they used was the county Emergency Management office. It is located in Ursa, Illinois. This is a rural community on the western edge of the state. It was obvious that the measuring instrument was located inside a climate controlled building. I emailed the county director of the office and asked him if he knew that his station’s temperature reporting was so badly distorted and he said he didn’t. To his credit, the problem ended, but the app no longer uses that location. I’m not sure whether that station reported its results to the NWS or to NOAA, but it certainly would have been a distortion.
Reblogged this on Climatism and commented:
“Hottest Year Evah” update :
Reblogged this on Climate Collections.