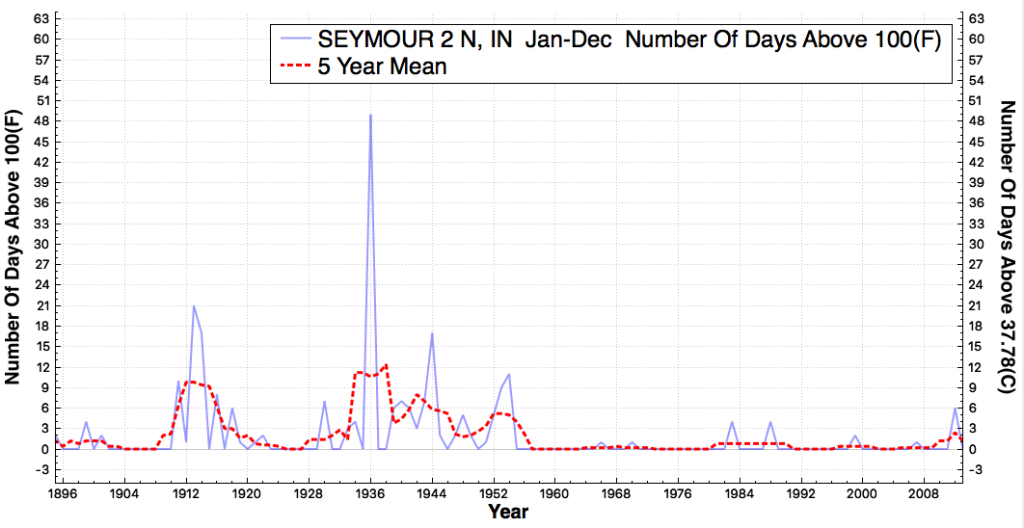
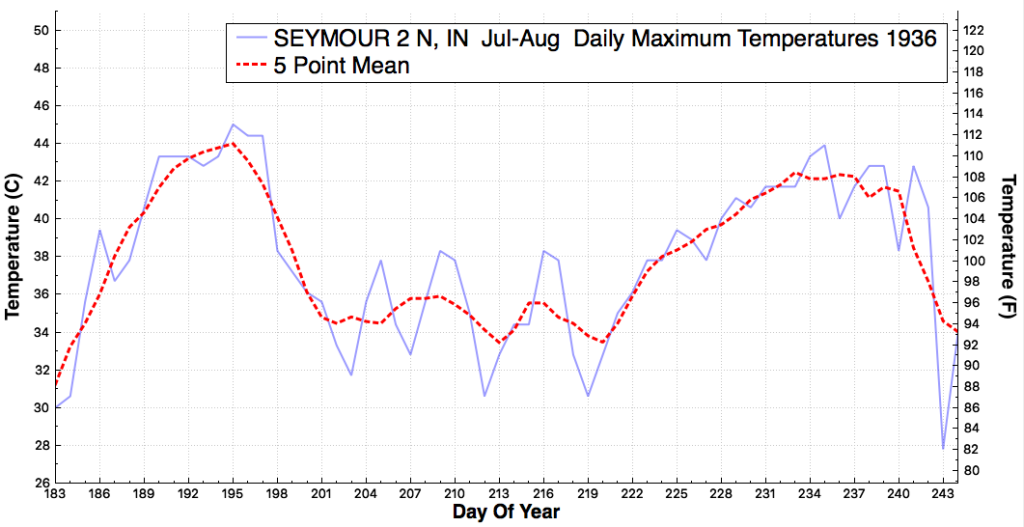
During the summer of 1936, Seymour, Indiana had 49 days over 100 degrees and reached 113 F (45C)

Most of the 100 degree days came during two heatwaves. A 15 day stretch in July and a 20 day stretch in August.

Indiana very rarely has 100 degree days any more. Fraudsters like Katharine Hayhoe claim that summers are getting hotter, but they are lying.


Thanks, Steven, for this reminder of the horrible heat waves in the central USA in July and August of 1936. I was born in Wichita, Kansas in October 1936. My mother never recovered from childbirth and finally died from tuberculosis in September 1940.
Hello.
I invite the author to
plot global summer temps to
back the written claim about
liars.
A nice clear chart with
defined baseline, error bars,
all the appropriate stuff.
That would really rub it in
to the alledged liars.
Or ya got cherry picked bullplop.
Your call on how how you want
your work and allegations to
be defined.
Li D Australia
You have no idea what you are talking about
It won’t be like 1936 but it’s looking like we here in the mid west and east are in for a much hotter summer than we have experienced in the last several years. Expect the alarmists to start howling again.
… here in the mid west and east are in for a much hotter summer than we have experienced in the last several years.
Good news for my tomatoes
Hello.
Why dont ya do a plot
of global summer temps for
the last hundred years to
really stick it to them people
you alledge to be liars.
Do it in the name of real science.
There isn’t any data set which is adequate for global temperatures for the past 100 years, and anyone who has worked with the data knows that. Even if they don’t admit it.
Ok. Lets take your belief about
lack of workable data as a given,
wether accurate or not.
That dosnt absolve YOU from
SHOWING your claim.
Use whatever data you can.
The data above about Seymour does
not SHOW your claim, although you
have attached the claim to it.
Hey, maybe Heyhoes claims are not
SHOWN either. I dont know.
Im sayin, you made a claim.
SHOW IT! Real Science
Li D Australia
Lid, what specific claim. The one refuting what Heyhoe claimed? The long term charts shown here certainly refute Heyhoe’s claims which are usually cherry picked and shown from the cooler times only.
How about this then.
http://s19.postimg.org/6h17htxrn/SEYMOUR2_N_IN_Mean_Temperature_Jan_Dec_1895_2015.png
Took me 10 seconds to draw, 20 seconds to upload to a free pic site.
(maybe you should try it yourself !)
CERTAINLY there is COOLING, not warming in Seymour.
Well done, Andy, you have proven that Heyhoe’s statement,
“Summers in Seymour, Indiana, have been getting hotter”,
is false.
……Unless……Heyhoe has never said such a thing, in which case, …..*who* is the “fraudster” who is “lying”?
PR nonsense.
The heat of the 1930’s was incredibly widespread, long lasting and extreme. It would take a huge amount of global warming to approach those temperatures again. But as we know, cool summers and even normal summers are also sure signs of global warming. We are all going to die!
Dustbowl. Man-made.
See, Andy, man-made. We are all gonna die.
Yes, because a few farmers in Oklahoma plowed the soil, we are all doomed!
Please spare us your alarmism. Of course you’re gonna die.
I don’t understand: you think the data from the 1930s in the USA is fine but don’t trust the newer data?
Turbo, the age of the actually measured and recorded data is not the problem.
That was a particularly unhelpful reply.
Turbo, he is telling you the adjustments, the elimination of stations, the homogenization of the records, the improper accounting for UHI is the problem. The surface record is a big subject, but it is fubar.
Sorry, Turbo. One of my ex-girlfriends used to say the same thing. I never figured out what to tell her when I thought the premise of her question was faulty. She had other redeeming qualities, though.
Measured vs reported. There is a LOT wrong with what has been done to the 1930’s data,
http://realclimatescience.com/wp-content/uploads/2016/01/2016-01-12-06-46-13.png
…and who concocted this graph?