
NASA shows that global land temperatures rose fairly steadily from 1880 to 1980, and have been increasing in a hockey stick since then.

NASA GISS Land Surface Temperature
It is simple enough to test the accuracy of their graph, by comparing it against the historical record of the Arctic. The Arctic is the air conditioner for the northern hemisphere – if the Arctic is missing ice, then the rest of the hemisphere will necessarily be warm. Arctic amplification is one of the fundamental tenets of global warming theory.
From the 1920’s to the 1950’s, the Arctic warmed tremendously. Glaciers were disappearing and collapsing, and Arctic sea ice was thinning and shrinking.
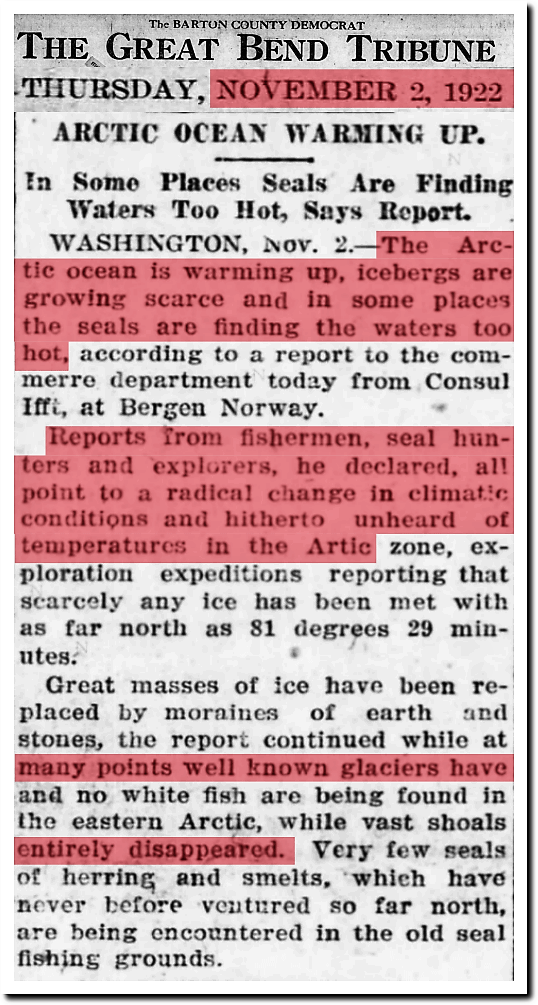
2 Nov 1922, Page 1 – Great Bend Tribune at Newspapers.com
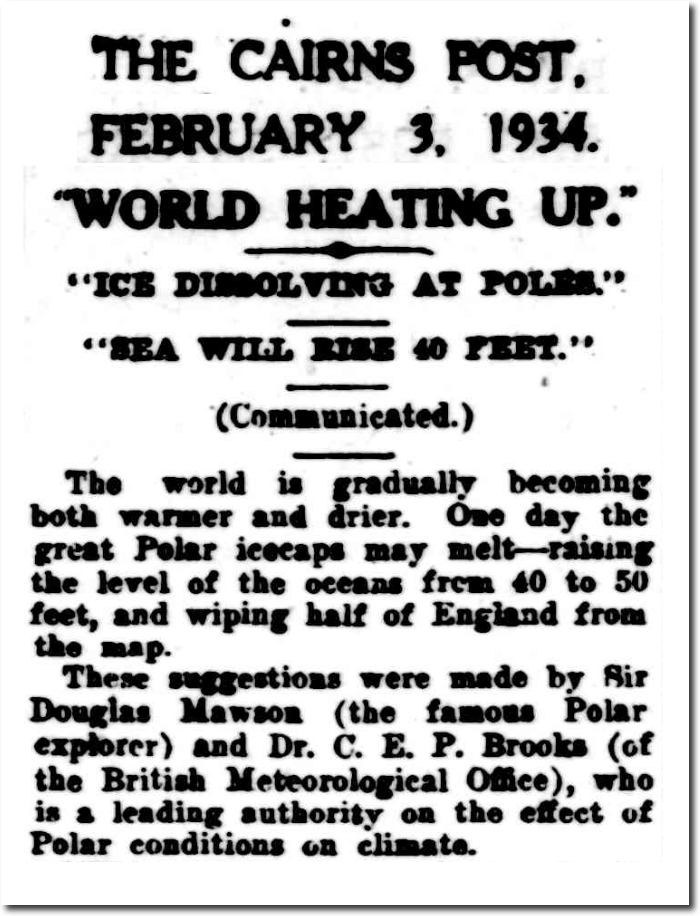
03 Feb 1934 – “WORLD HEATING UP.” – Trove

17 Dec 1939, Page 15 – Harrisburg Sunday Courier
at the same rate (as) they are at present melting, oceanic surfaces would rise to.catastrophic proportions, and people living in the lowlands along the shores would be inundated
temperatures in the Arctic have increased 10 degrees Fahrenheit since 1900, an “enormous” rise from the scientific standpoint

31 May 1947 – MELTING ICE CAP DANGER – Trove
By 1955, Arctic sea ice extent had shrunk in half.

10 Mar 1955, Page 3 – Democrat and Chronicle at Newspapers.com
Sixty years ago, the New York Times reported that Arctic sea ice was two meters thick. About the same as today. They predicted an ice-free Arctic within a generation.
Although the idea that a solid ice sheet covers the central Arctic has lingered stubbornly in the popular fancy, the northern cap of ice worn by our planet is actually a thin crust—on the whole, only about seven feet thick—over an ocean two miles deep in places.

The Changing Face of the Arctic; The Changing Face of the Arctic – The New York Times
But after 1958, the weather cooled rapidly and the ice cap expanded.

NASA warned of a new ice age by the year 2020.
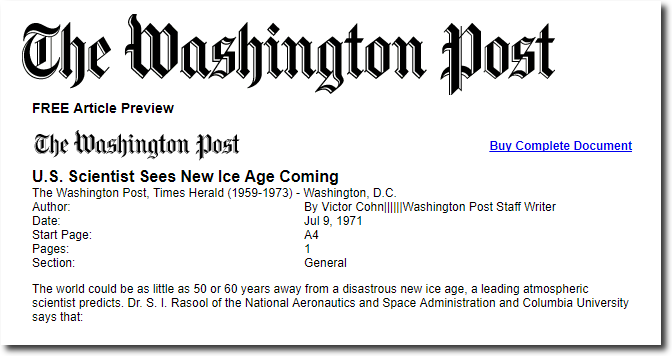
U.S. Scientist Sees New Ice Age Coming
Scientists wanted to melt the Arctic ice cap to stop global cooling.
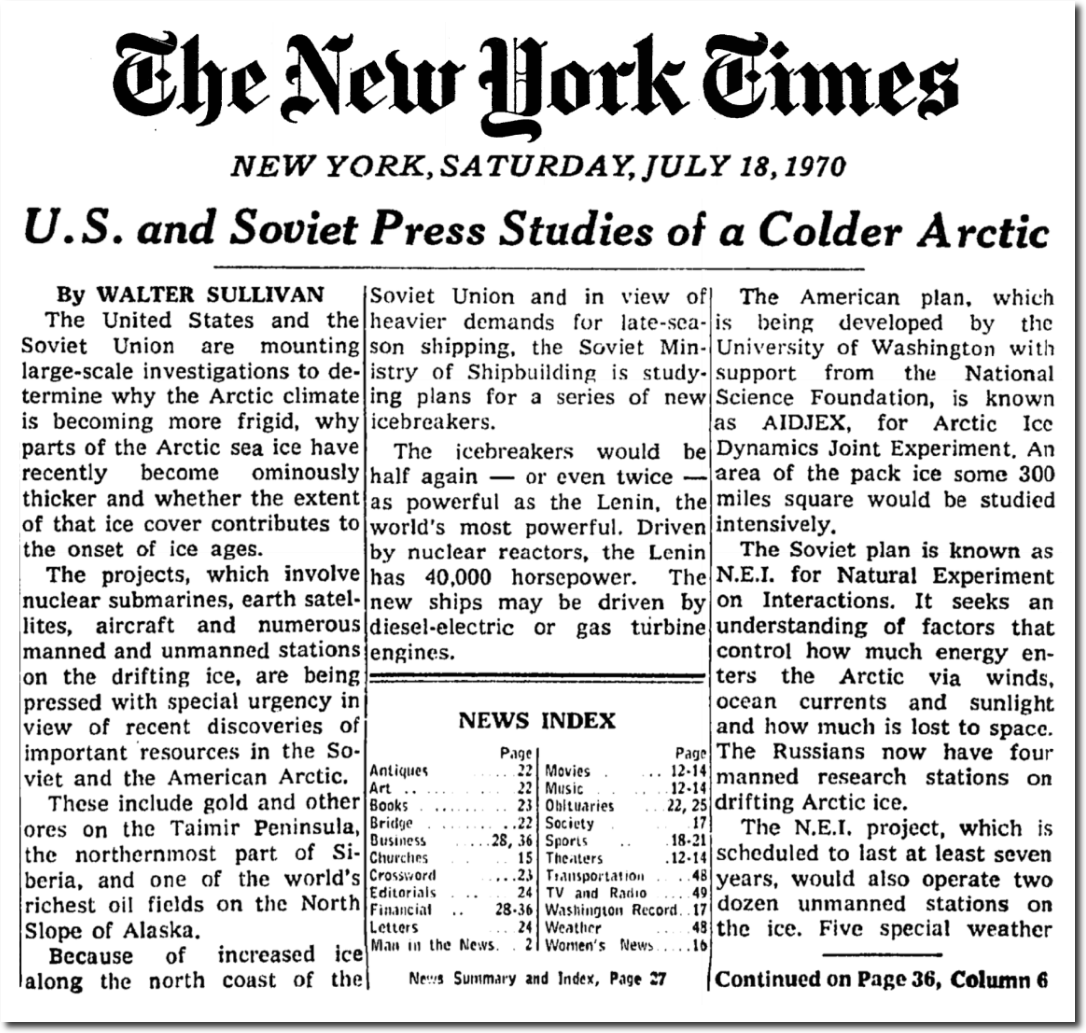
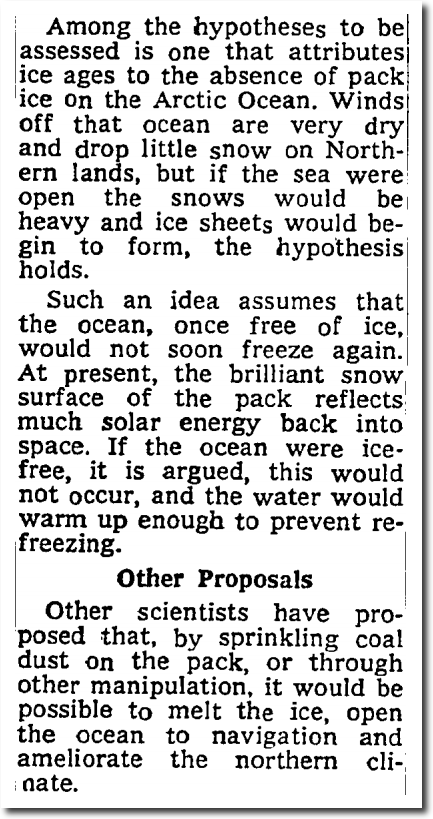
U.S. and Soviet Press Studies of a Colder Arctic – The New York Times
The world’s leading climate experts sent a letter to President Nixon warning of a new ice age within a century.
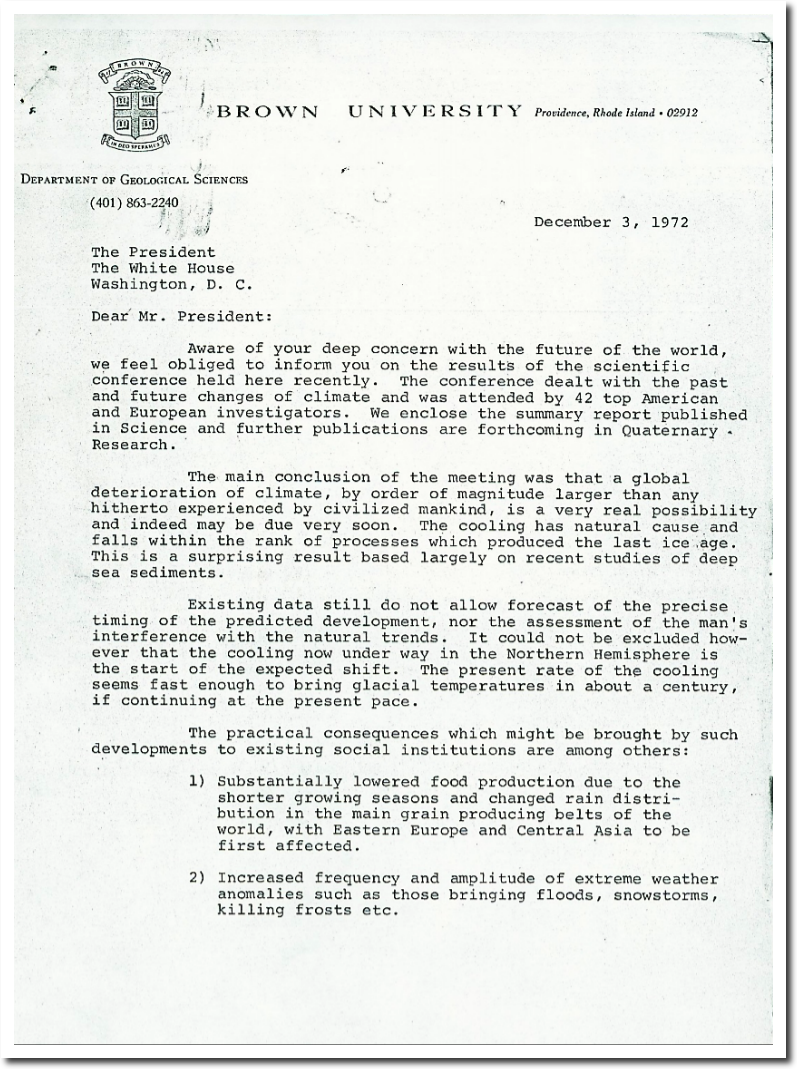
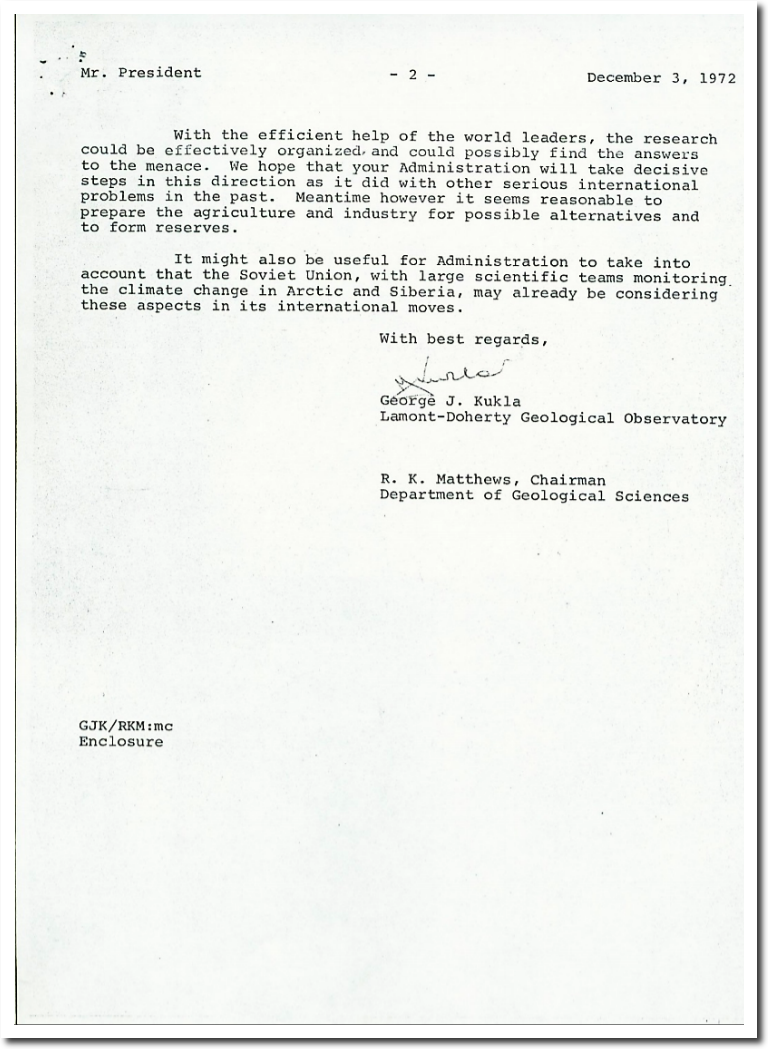
THE ROLE OF NOAA’S CLIMATE PREDICTION CENTER IN THE DEVELOPMENT OF CLIMATE SERVICES
14 Apr 1973, Page 8 – Iowa City Press-Citizen
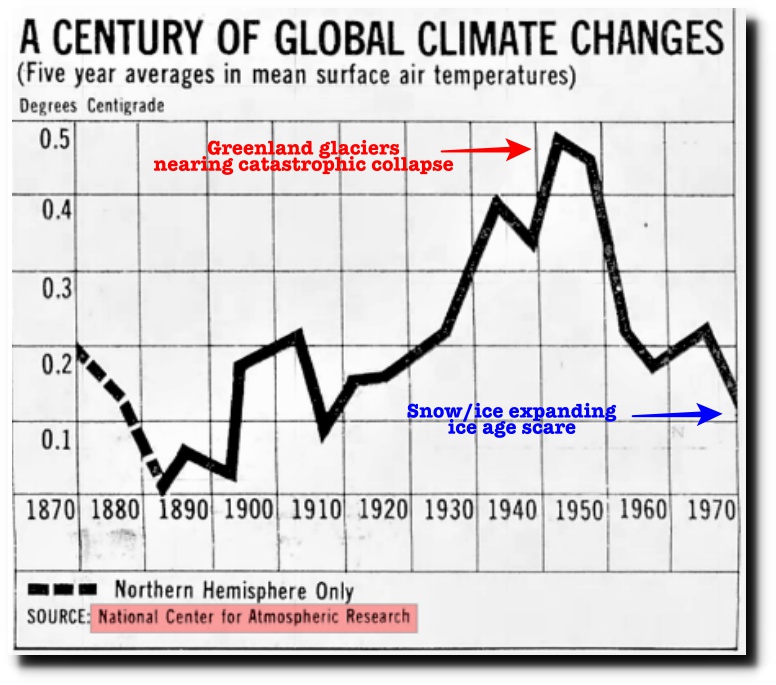
In 1974, NCAR showed that 1970 was colder than 1870.
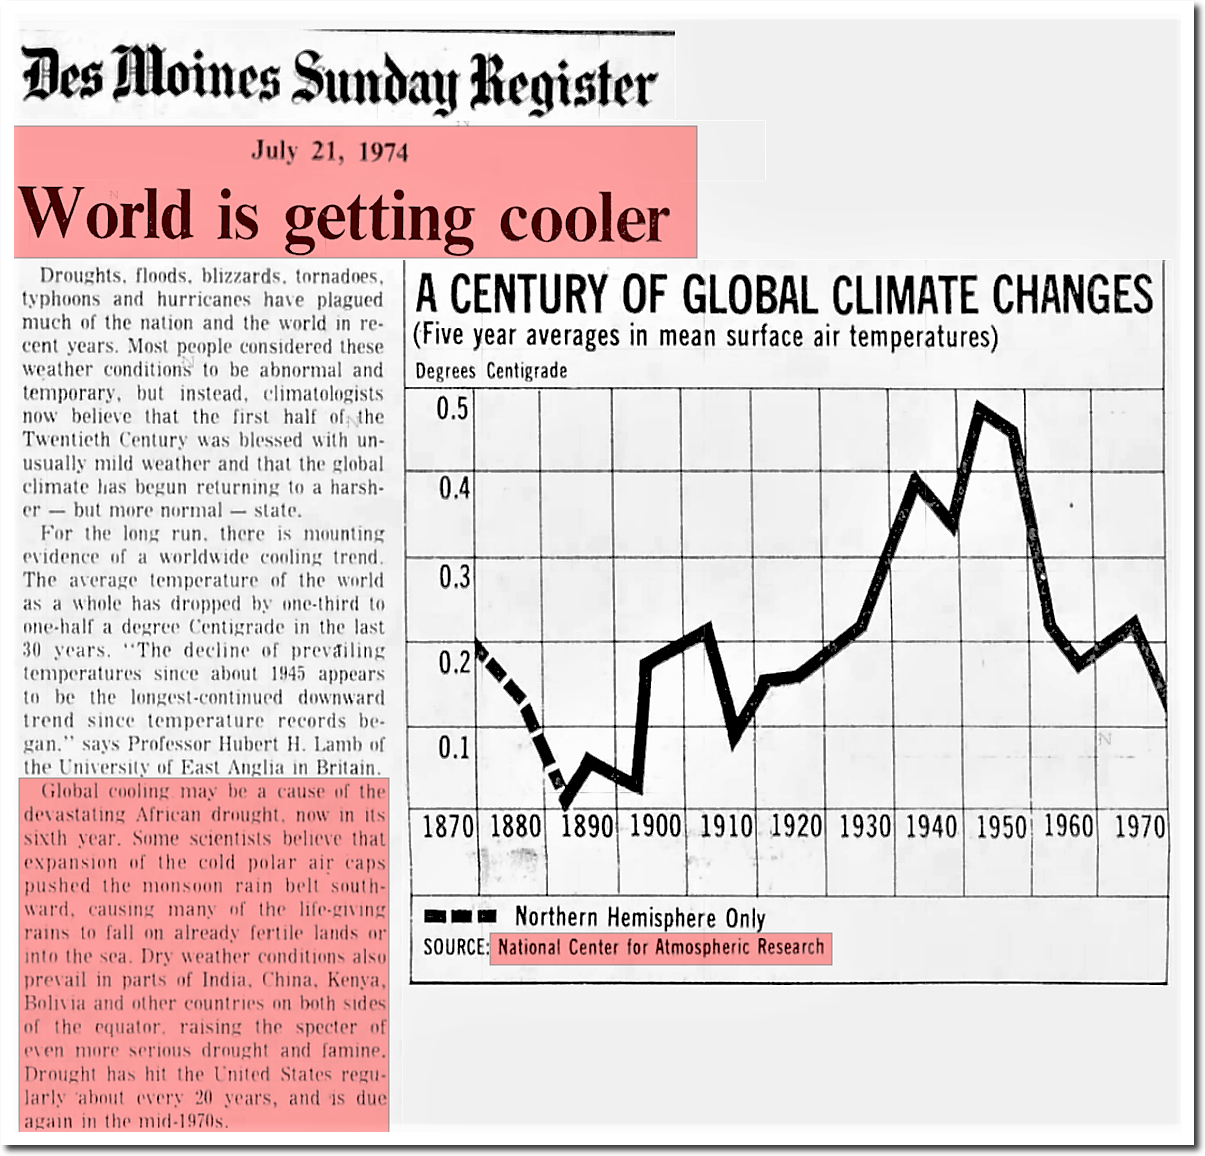
21 Jul 1974, 13 – The Des Moines Register at Newspapers.com
The 1974 NCAR graph correlated closely with the historical record, with ice melting during warm periods and freezing during cold periods.
21 Jul 1974, 13 – The Des Moines Register at Newspapers.com
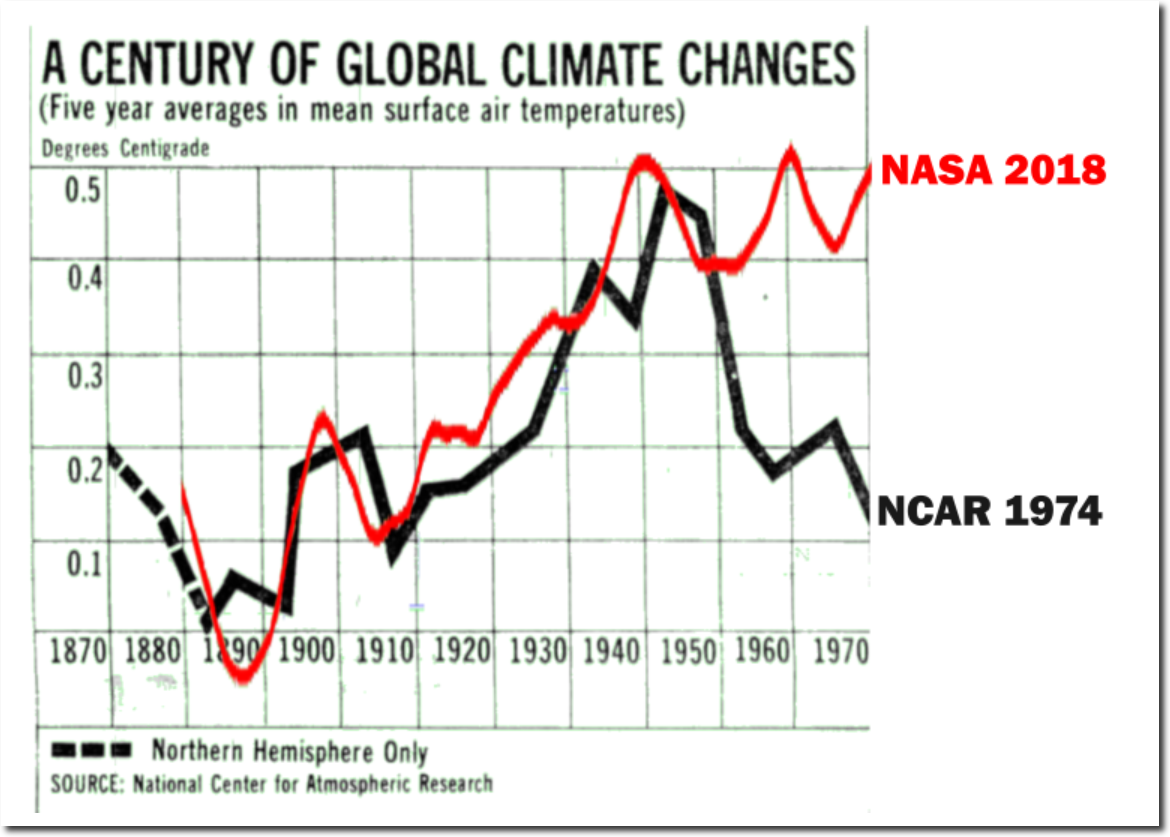
By contrast, the NASA graph does not correlate with historical records of the Arctic. It shows ice melting when the weather is cold, and freezing when the weather is hot.

NASA has erased the post 1940 cooling seen in the 1974 NCAR graph.
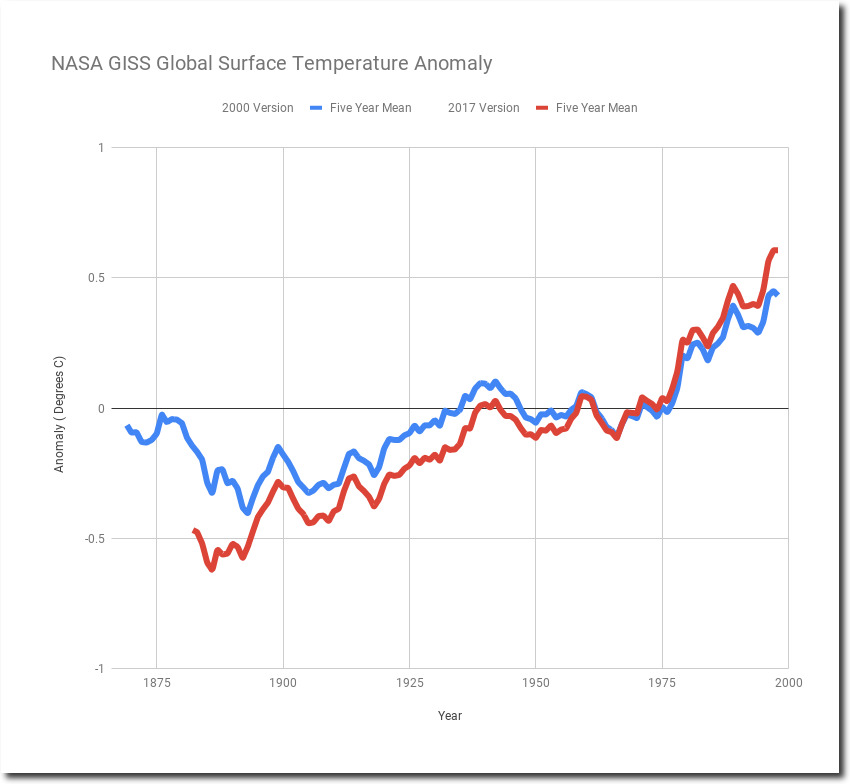
Climategate e-mails show that this alteration of the data was openly discussed by different government agencies, without any reason for doing so.

NASA continuously alters their data to cool the past and warm the present. The graph below shows changes just over the past 19 years.
The 1974 NCAR graph made sense. The current NASA graph does not.
