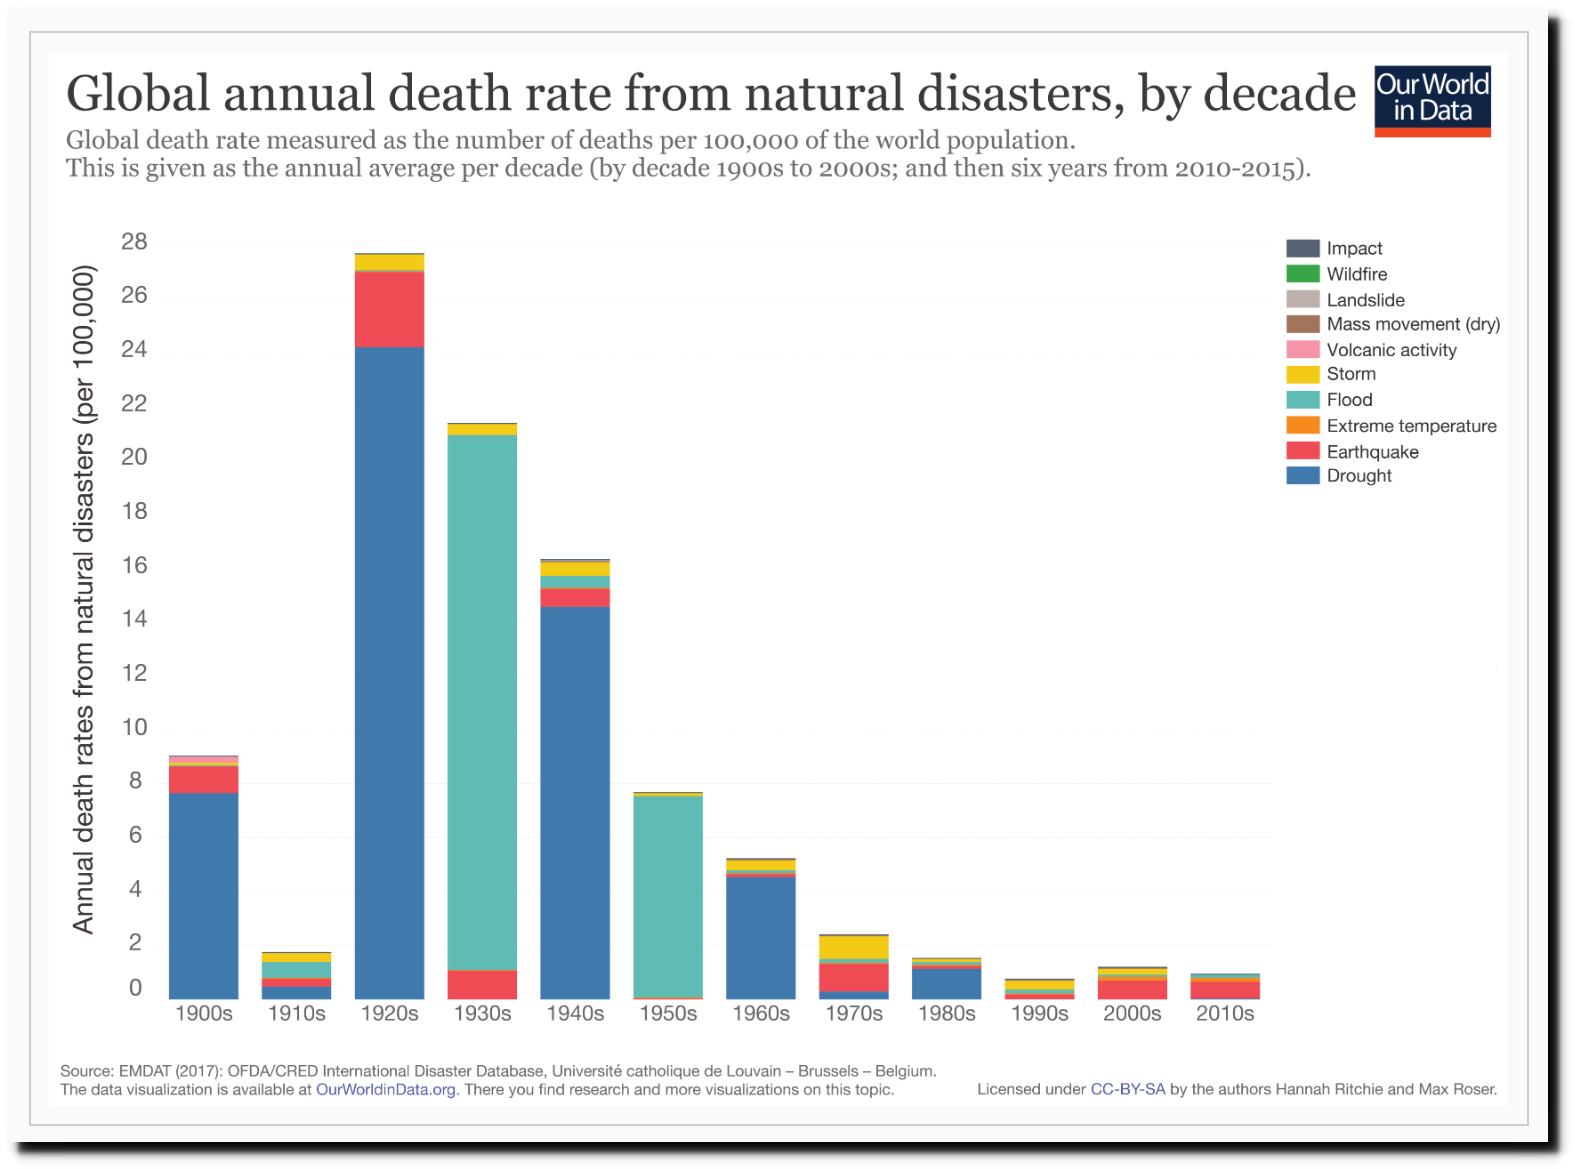
Oxford University shows a huge increase in reported natural disasters since 1900, including twelve in 1927.

Natural Disasters – Our World in Data
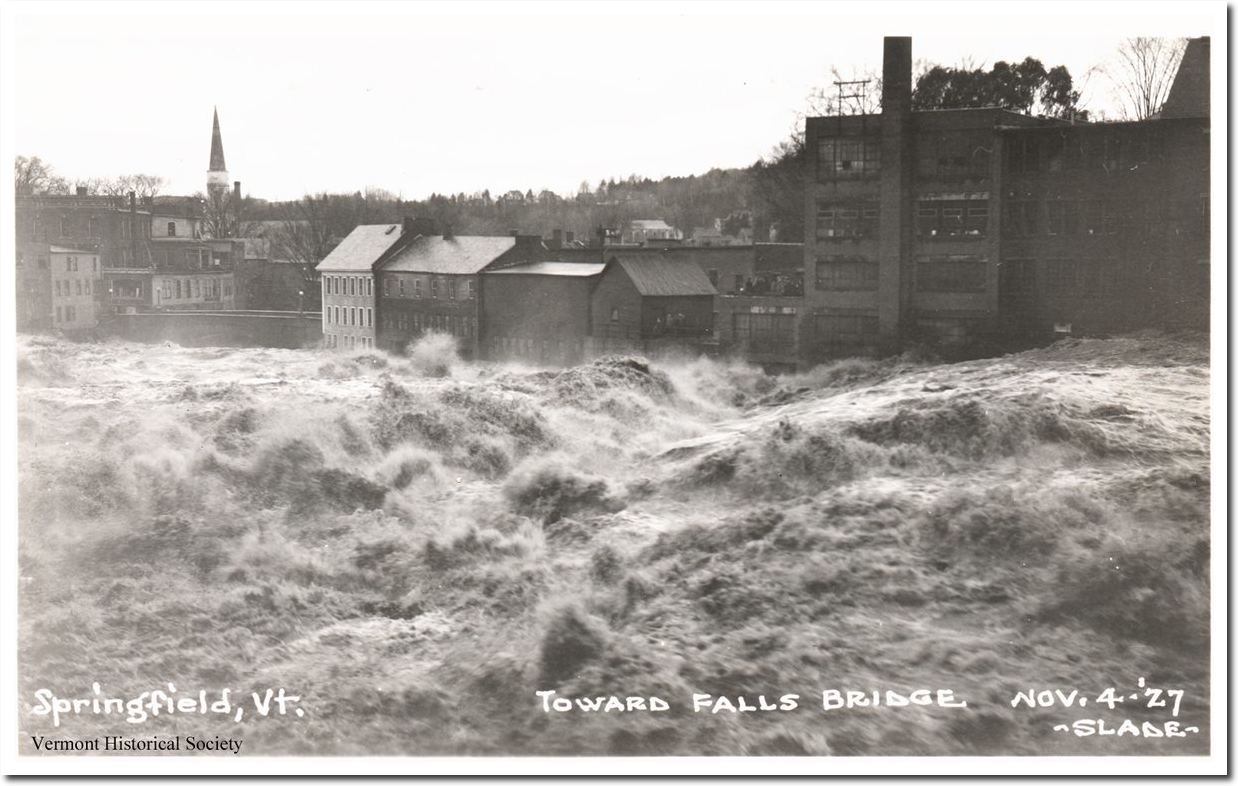
It took me about thirty seconds to research the accuracy of the graph. The Red Cross described 1927 as the worst year in history, reporting 111 disasters – including 29 tornadoes, 24 floods, 9 hurricanes and 23 fires. The worst floods in US history occurred that year. The Mississippi River was flooded for more than six months, forcing hundreds of thousands of people to abandon their homes permanently. Vermont’s worst flood also occurred in November, 1927.

25 Nov 1927, Page 7 – The News-Review at Newspapers.com

St. Louis was destroyed by a tornado.
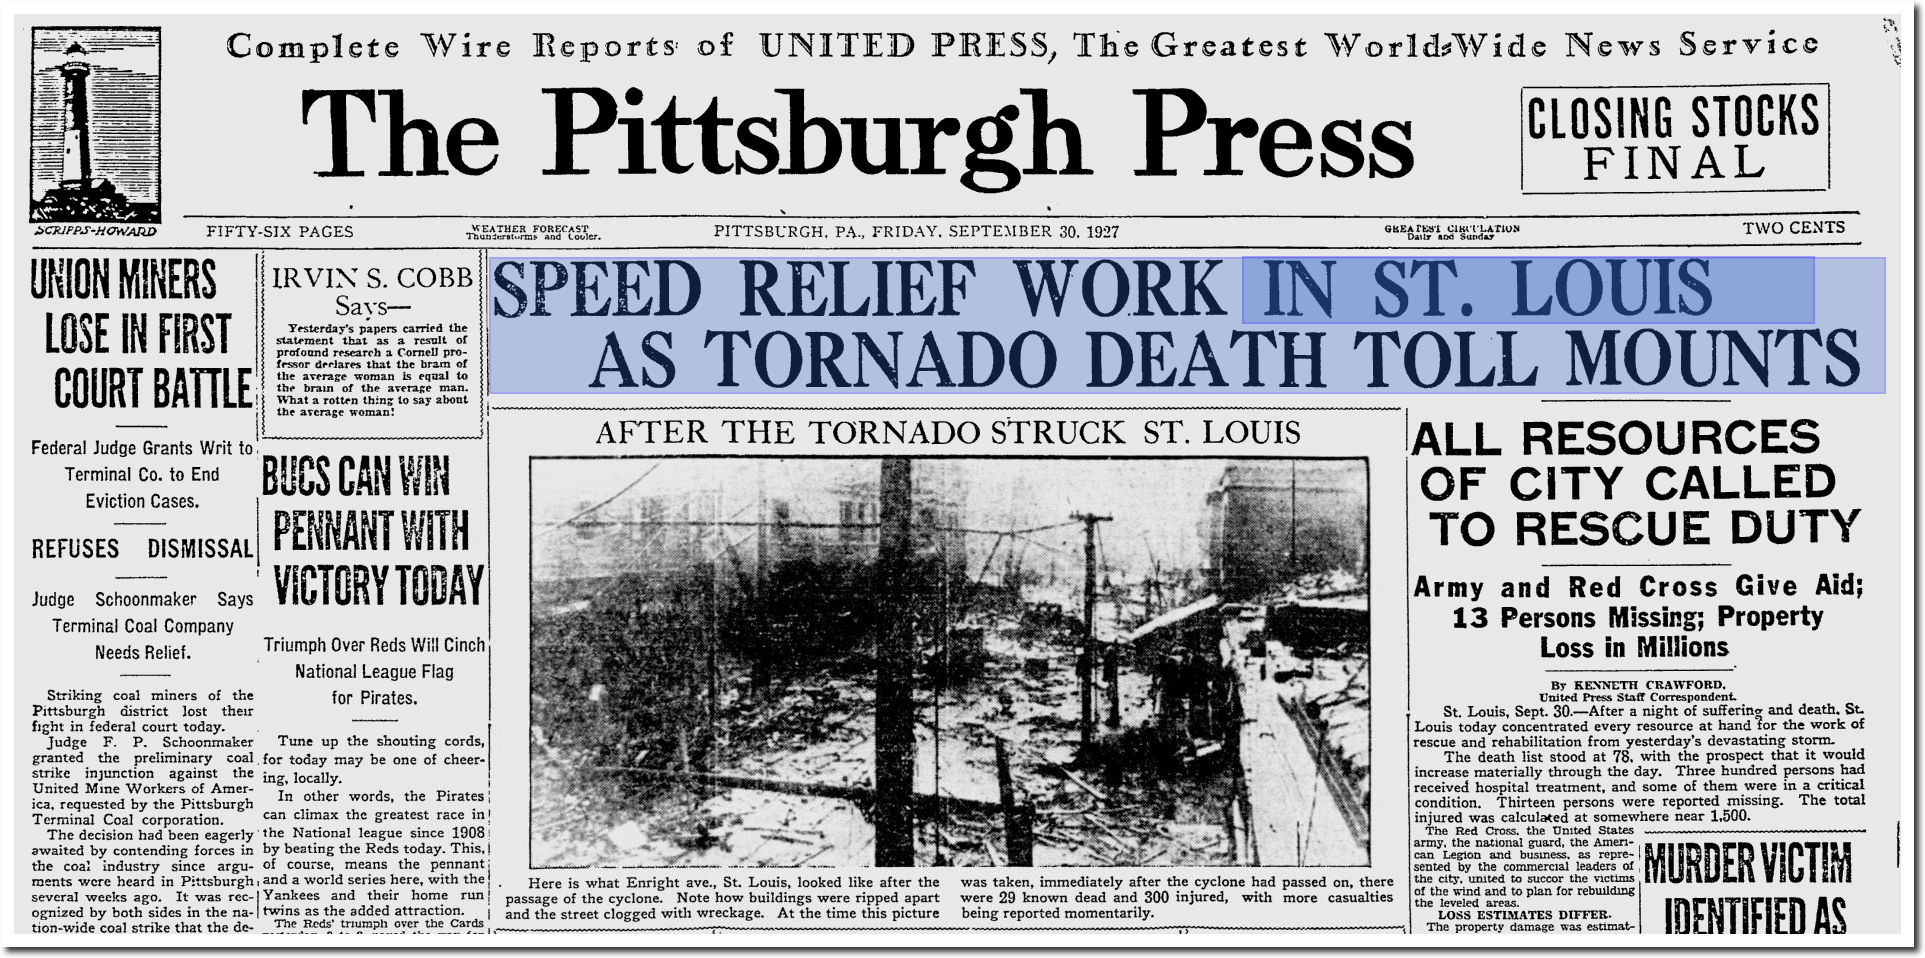
The Pittsburgh Press – Google News Archive Search
November flooding wiped out more than 1,000 bridges in Vermont, and drowned the Lieutenant Governor.
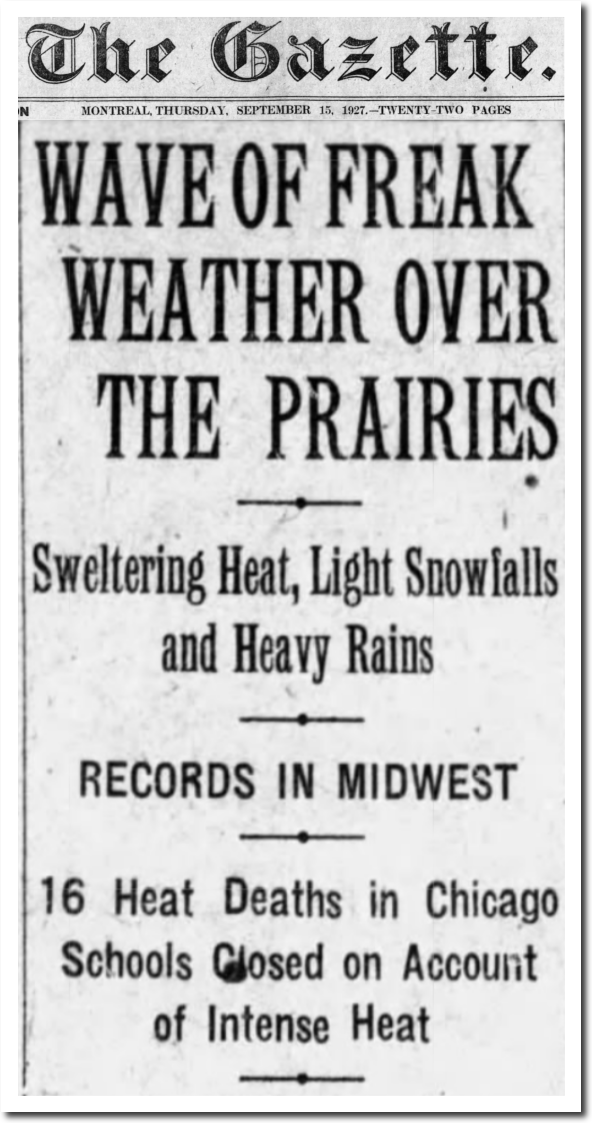
A number of record heatwaves occurred in 1927, including a protracted one in September and October, which killed scores of people.
15 Sep 1927, 1 – The Gazette at Newspapers.com
Warsaw Union – Google News Archive Search
Obviously the person who generated the graph didn’t do any research, and is simply making numbers up. Another graph from the same website shows death rates from natural disasters down 95% since the 1920s.