The press claims New Zealand will be underwater by 2050.
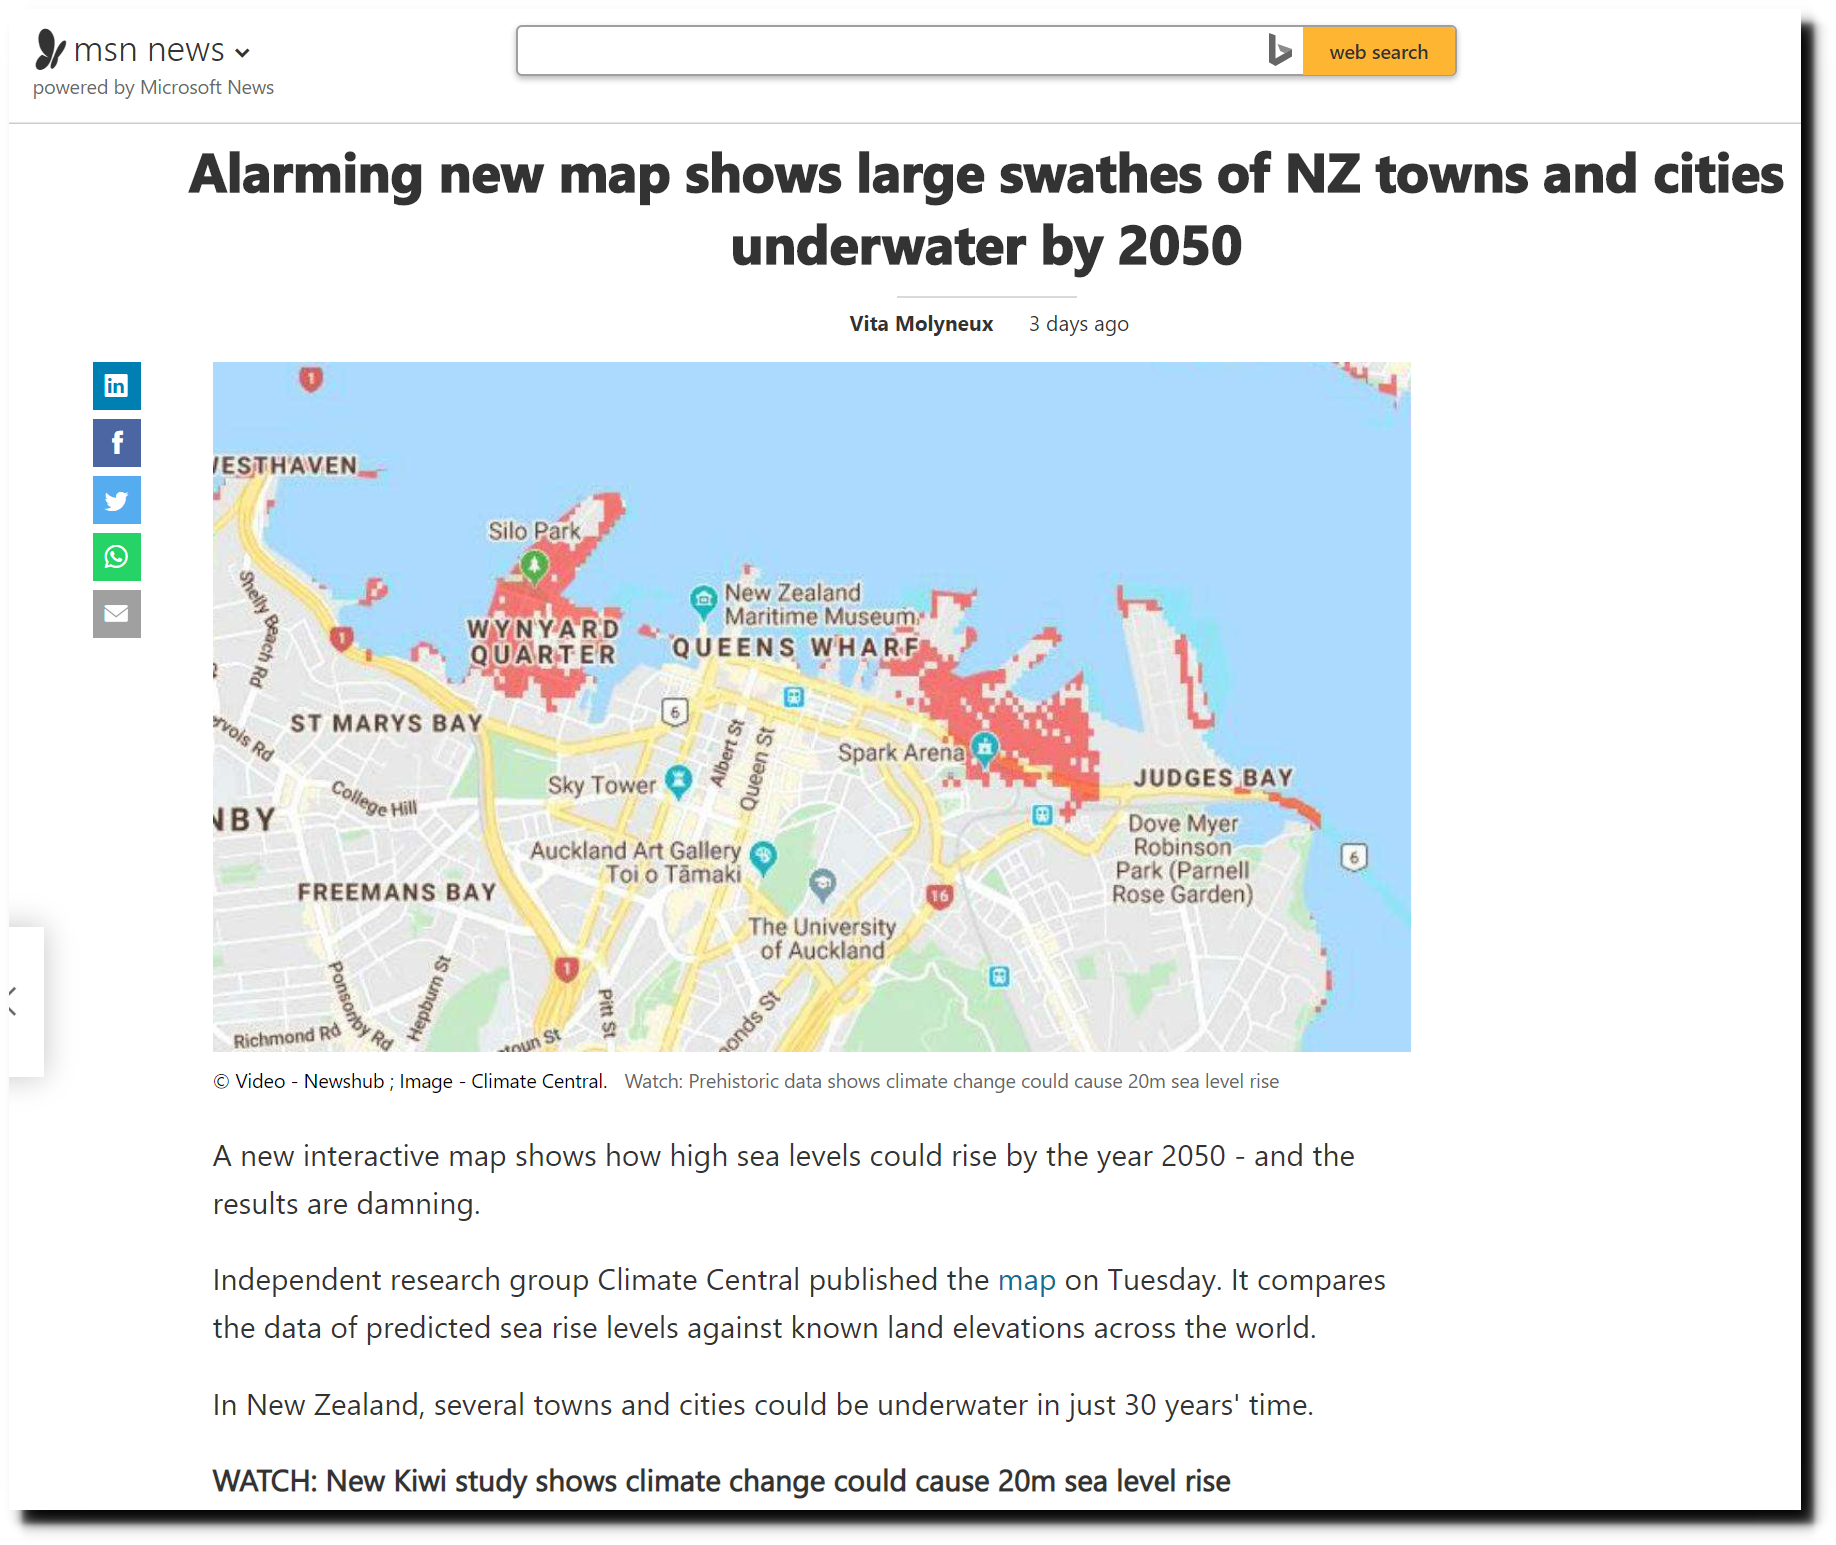
Alarming new map shows large swathes of NZ towns and cities underwater by 2050
Tide gauges show that sea level is barely rising.
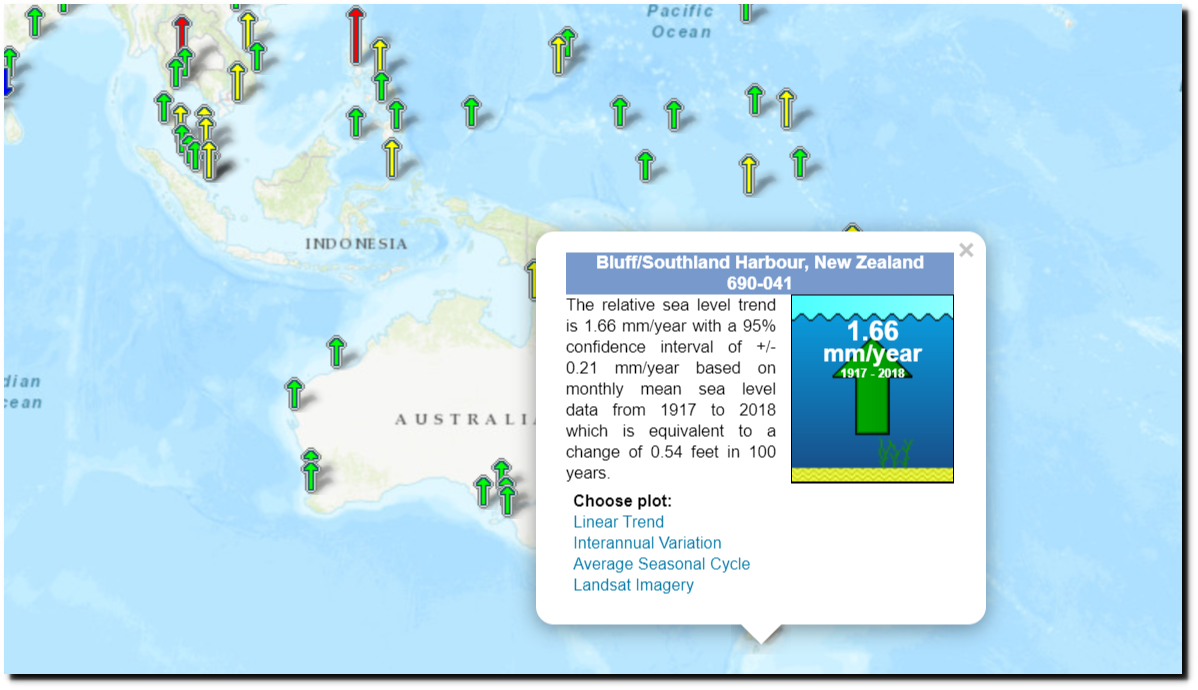
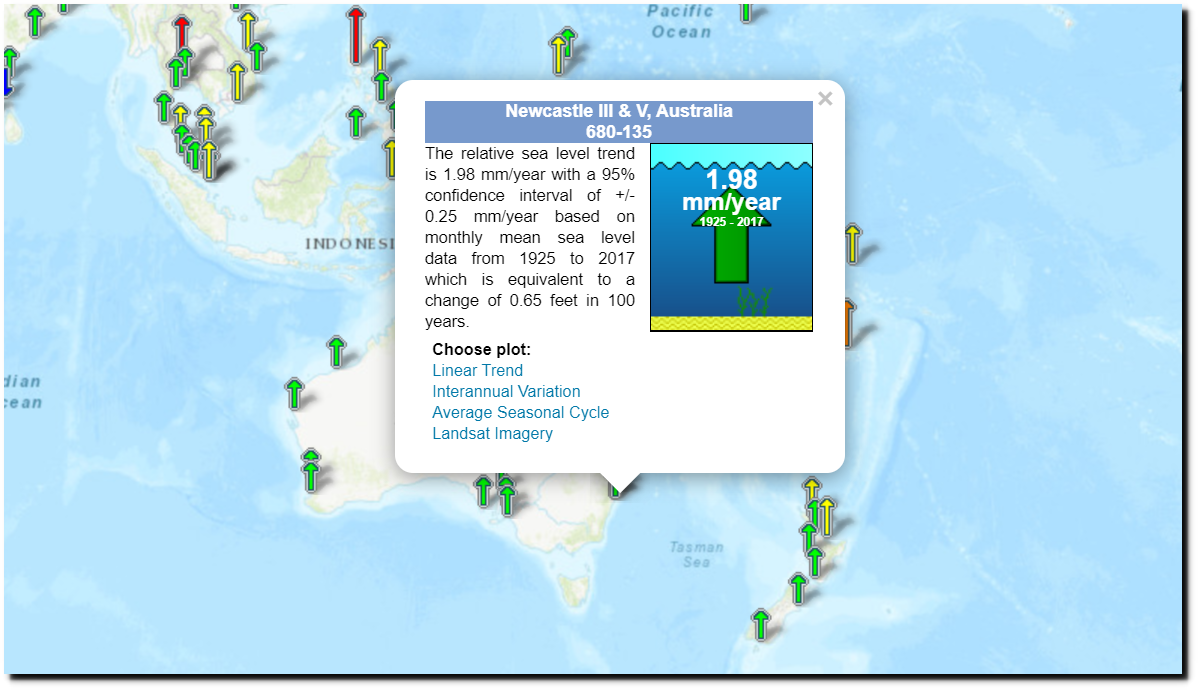
Sea Level Trends – NOAA Tides & Currents
From 1900 to 2000, the tide gauge at Auckland showed very little sea level rise, and almost all of that occurred before 1955.
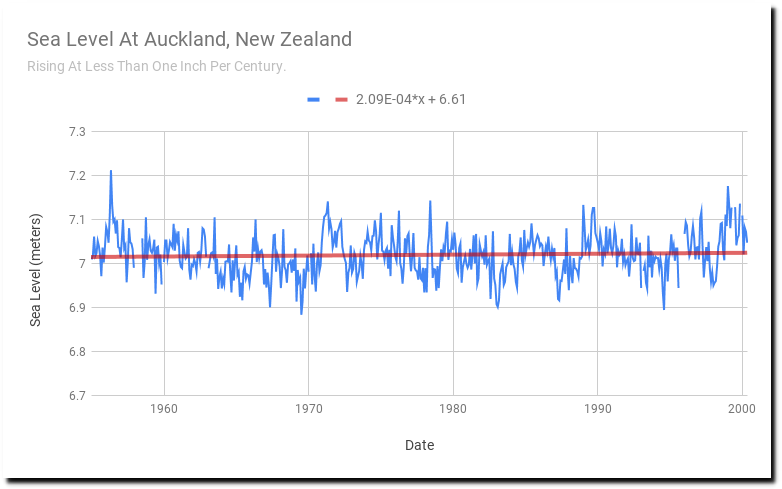
690-002 Auckland II, New Zealand
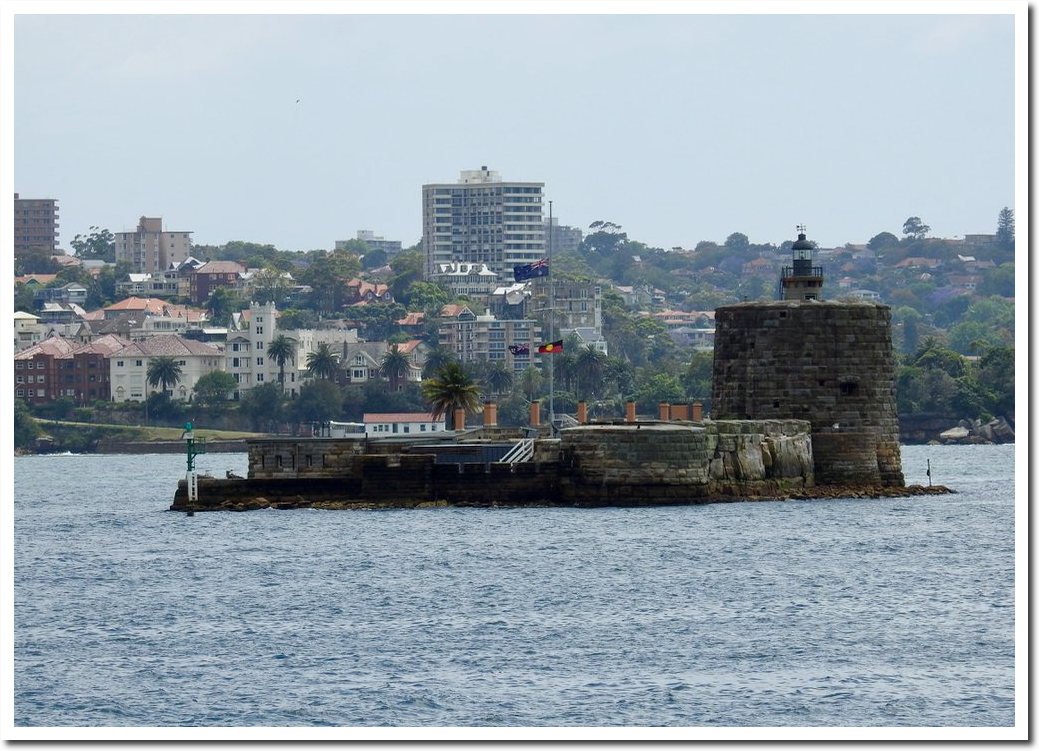
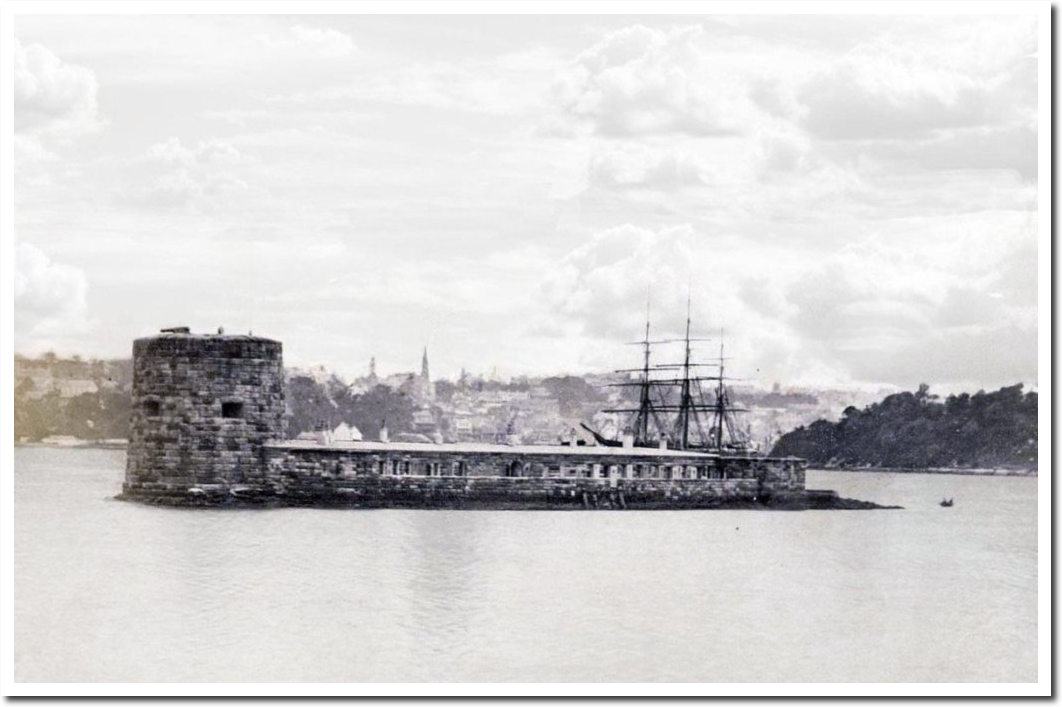
Sydney has the best long-term record in the region.
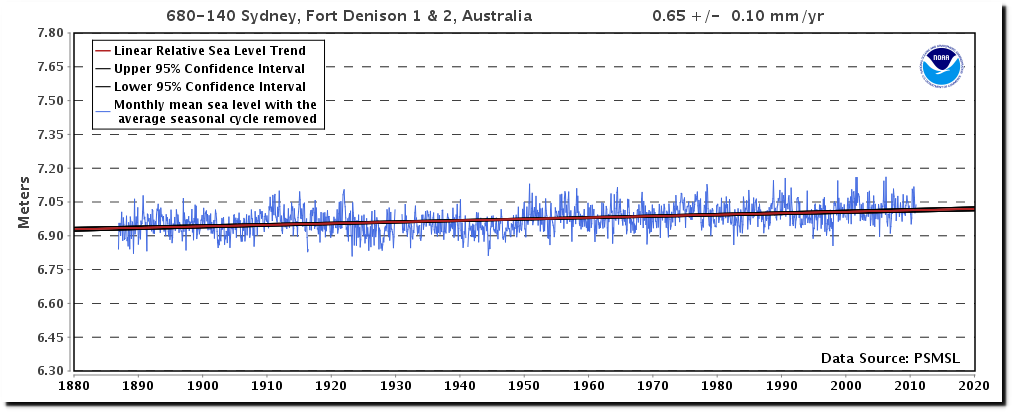
This is a way to show acceleration: Change in change!
https://tidesandcurrents.noaa.gov/sltrends/sltrends_station.shtml?id=690-002
https://tidesandcurrents.noaa.gov/sltrends/sltrends_station.shtml?plot=50yr&id=680-140
Periodic movement .
The best visual proof of sea level change has nothing new to tell us!
Thanks for these excellent plots. Interestingly, the second plot does show a slight upward trend, but OMG, each data point represents a 50 year period. So we’ll all have died of the usual (i.e., not-climate-related) natural causes before we can even tell whether the long-term trend turns out to be catastrophic in any sense.
The periodicity of the oscillation is about 60 years. I suppose it’s no surprise that the 60 year period is about the same as the length of the Pacific Decadal Oscillation in the 20th century, allowing for a phase shift: http://research.jisao.washington.edu/pdo/
I’m not a climate scientist but I sometimes pretend. I mean, why not? It doesn’t seem to take much. (The real ones, like Lindzen, Curry, Soon at al., excepted.)
They took the wrong beach to protest.
Tony
A good listen is the interview below regarding Fort Denison sea levels.
https://www.youtube.com/watch?v=9mjOmsqIibk
I was interested that the mean sea level has been moving around at Fort Denison Sydney for the past century. Another perspective here!
I have been going past Fort Denison since the late 1960s and there appears to be no visible change at all in the sea level here!
First sentence of the cited lead article reads, “A new interactive map shows how high sea levels could rise by the year 2050 – and the results are damning.” The article doesn’t realize that the “Independent research group Climate Central” is the party the article is sending to perdition, given Tony’s most excellent data exposition.
On the other hand, I suppose it IS technically possible that these areas “could be underwater by 2050”, say, because an asteroid strikes the area. Or something…
I keep sending articles like this to my alarmist friends, in the hope that they’ll be relieved by the good news, but inexplicably, information that should calm them just upsets them further.
Thanks once again Tony. Your work provides an oasis of sanity in an increasingly irrational world.
I like 1989 Bondi Beach the best.
Silly Season continues:
The first image/map, of downtown Auckland, highlights in orange areas RECLAIMED from the harbour and built upon, ie. wharves. Photos from 100 years ago show the port area has only GROWN in size. We may be ‘Downunder’ but we’re not going under!
Not too far north of Auckland city, friends and I still surf over a lava reef we used to surf back in the 1970s – at least when we skipped school we did something constructive by throwing ourselves in the ocean and learning to survive. The reef is still the same, no deeper, no shallower; the waves break exactly the same, perfect A-frames; five decades and not a drop of water out of place.
Then again, one nasty tsunami could flush the whole shebang out into the Pacific…
I have lived by the coast in NZ, North and South islands, for over 60 years and can assure you that nowhere has the sea risen – anywhere. The only movement has been because of earthquakes, Kaikoura being a classic example.
About 40 years ago I remember a yacht being strung up in Wellington to show where the sea would rise to. That yacht now seems to be gone and I can’t find any reference to it anywhere now. It was a big thing at the time and all over the newspapers. They must have taken it down – very quietly.
Updated Graphs for Fort Denison, and Bondi Pool pump inlet stilling structure
Showing min, max and average. (Numbers in metres.)
Around 1mm per year average on both.
Low tide trending faster than high tide.
https://i.postimg.cc/jd8Vv8bc/fort-denison.png
https://i.postimg.cc/RFx2qy7S/Bondi-Stilling-Pool.png
Oh so scary !!
how will we ever cope.
Below is the link to this article which is based on Antarctic Ice sheets melting and that the last time we were at 400 ppm CO2, 25000 years ago but with higher temperatures, sea levels were 25 metres higher than today. This is from a PhD student at Victoria University, Georgia Grant. I’m not a scientist but my understanding is that sea ice melting does not cause a sea level rise, or if so very small. And the last recorded level of CO2 over 400 ppm was as recently as 1942. In addition how can you just assume that circumstances of what happened 25000 years ago with 400ppm is the same as today. I live by the sea in NZ and I agree with the above information .. nothing changes
Solving the mysteries of climate change and sea-level rise _ Victoria University of Wellington.html