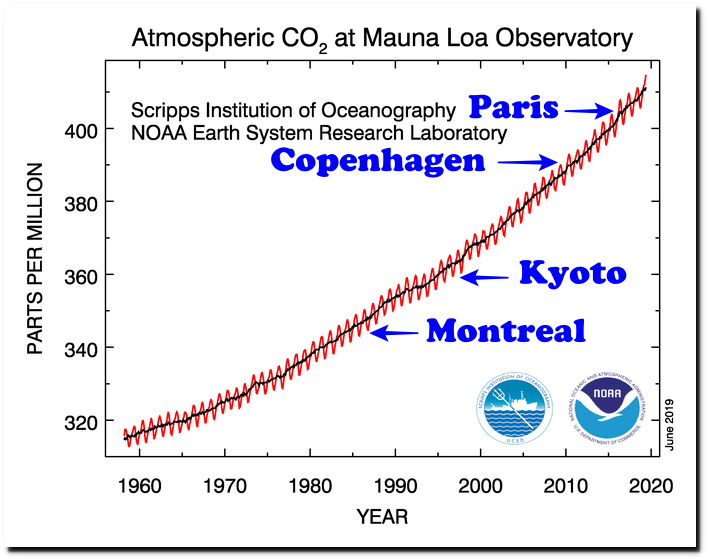
With the world locked down, and aviation and automobile travel at a near standstill, atmospheric CO2 has reached a record high 418 PPM.
Global Monitoring Laboratory – Global Greenhouse Gas Reference Network
There is no indication humans have the ability to control atmospheric CO2 via political decisions.
ESRL Global Monitoring Division – Global Greenhouse Gas Reference Network
Meanwhile, Weather Underground (named after Bill Ayers 1960’s terrorist organization) is celebrating the collapse of the economy.
The Mauna Loa readings are interesting. If oceans retain more CO2 when cold and release more when warm, why do the readings show the count going down in summer months and gong up in winter months? It seems it should be the reverse. Hawaii is in the northern hemisphere. Does this have something to do with the southern hemisphere having a larger percentage of oceans than land?
Why down in the summer. Because plant live across the huge northern hemisphere continent suck in all that CO2, and turn it into animal food.
Just like the 100 kyr ice age cycle, the annual CO2 cycle is driven by the northern hemisphere, not the southern hemisphere.
R
Plant absorption?
The claim is that vegetation blooms in summer, using up CO2 to grow.
The same effect, although smaller, is seen in the southern hemisphere.
Plants consume more CO2 in the summer than is released by decomposition in winter.
The CO 2 is good news for the plants.
Increasing temps are bad news. Overall, deserts will grow faster than summer Arctic greening
Well, Jan, that runs contrary to what happened in the 1920’s into the 1930’s.
Just as I suspected since most CO2 going into the atmosphere is coming from the oceans 800 years after the MWP, just as the Vostok Ice Core studies showed us – the actual studies, not the fake representation of them presented by psychopath Gore.
ELI or ICE?
This exposes another part of the Big Lie. As our oceans continue to warm out of the LIA, they continue to outgas CO2. And what the doomers call “historic CO2 levels”, are just more cherry picks. CAGW is a house of cards, and marked cards at that.
+1000
Tinier travel trade transport. Trips, tabs, table tips. Tearful Tunberg test takes tremendous tumble: Covid casualty chaos countervails current climate change catastrophe circus.
Looking at the hourly chart. There is huge variations so the average looks odd. Looking at the daily average chart for the year, the average has large swings from February to May. Northern hemisphere plants must be erratic starting up for the growing season.
The variations are only on the order of a ppm. On a percentage basis, that’s not large, <<1% relative. On an absolute scale, the stability is actually quite remarkable.
The variability only appears large because of scaling.
Mauna Loa is belching.
GW:
The summer decrease in CO2 is due uptake by plants.
There is more land surface in the NH but CO2 mixes well enough so apparently
there is not much difference in concentration in NH vs SH.
Henry’s law at work :
– should human’s desappear, Henry’s law (and other CO2 sources) would compensate in
a snap.
As shown by Prof Murry Salby, human’s impact on atmospheric CO2 concentration is almost not detectable :
https://www.youtube.com/watch?v=b1cGqL9y548
So much for the CAGW pseudo-“science”, destroyed one more time by Mother Nature … in a snap.
Salby’s work in this regard has not been accepted. I’m not saying it’s wrong, but fossil fuels do emit CO2 upon combustion, probably around 4% of natural emissions. The question is to what extent is the rise in CO2 is due to fossil fuel combustion?
But “The Guardian”, that bastion of morality tells us otherwise.
https://www.theguardian.com/environment/2020/apr/11/positively-alpine-disbelief-air-pollution-falls-lockdown-coronavirus
I wonder who to trust….?
Wow! A whole, two parts per million increase, over twelve months. Truly shocking.
Which part was man made and which was natural?
That’s the question. At this rate, we could be in for real trouble in 5000 years or so.
The question is to what extent is the rise in CO2 is due to fossil fuel combustion?
As I recall, the human contribution of CO2 roughly is ~4 to ~6%.
Some alarmunists have made outrageous claims that it’s closer to 30%, taking into account the rise in atmospheric CO2 over the last two centuries, and not attributing any of the rise from the starvation level of 280 ppm to today’s ~418 ppm to the process of natural outgassing from the oceans, lakes, volcanoes and the ground.
The hyped-pothesis of man-made GW is built on deceptive nitpicking.
Pandemic deindustrialisation MUST lower CO2 to the Guardian newspaper’s safe level of 350ppm or we are doomed.