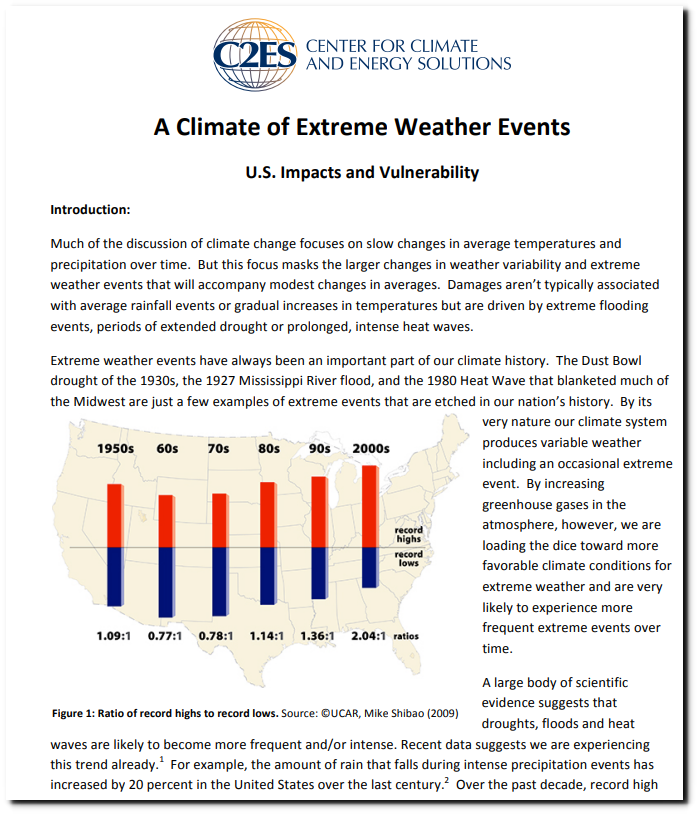
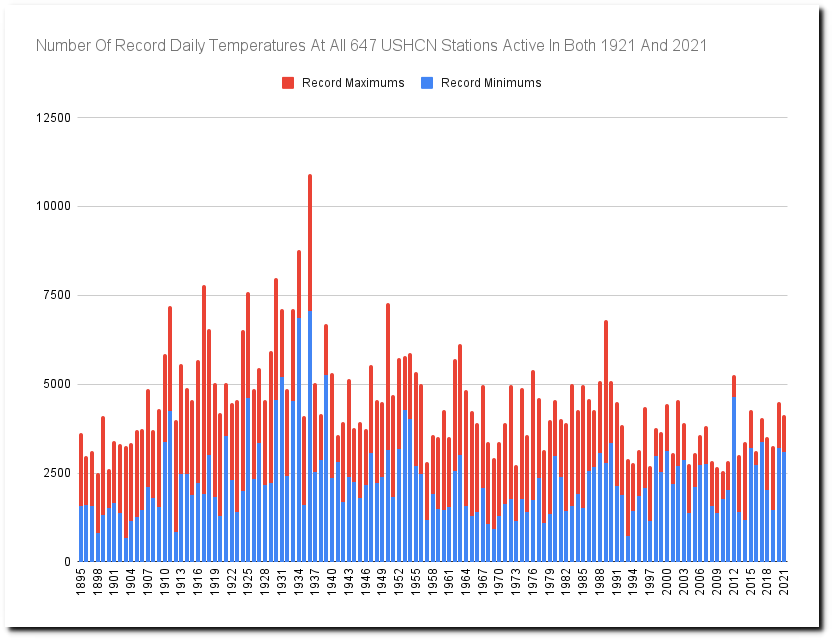
They started their graph in the 1950s. Had they used a complete data set the trend would be opposite.
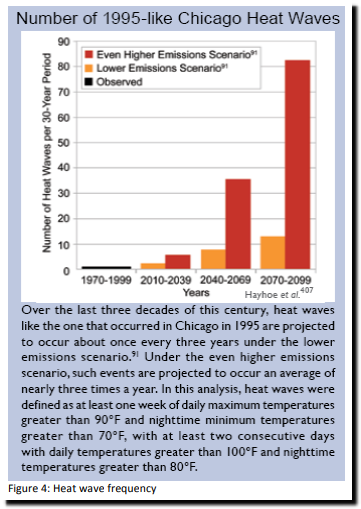
They started their Illinois graph in the 1970s.
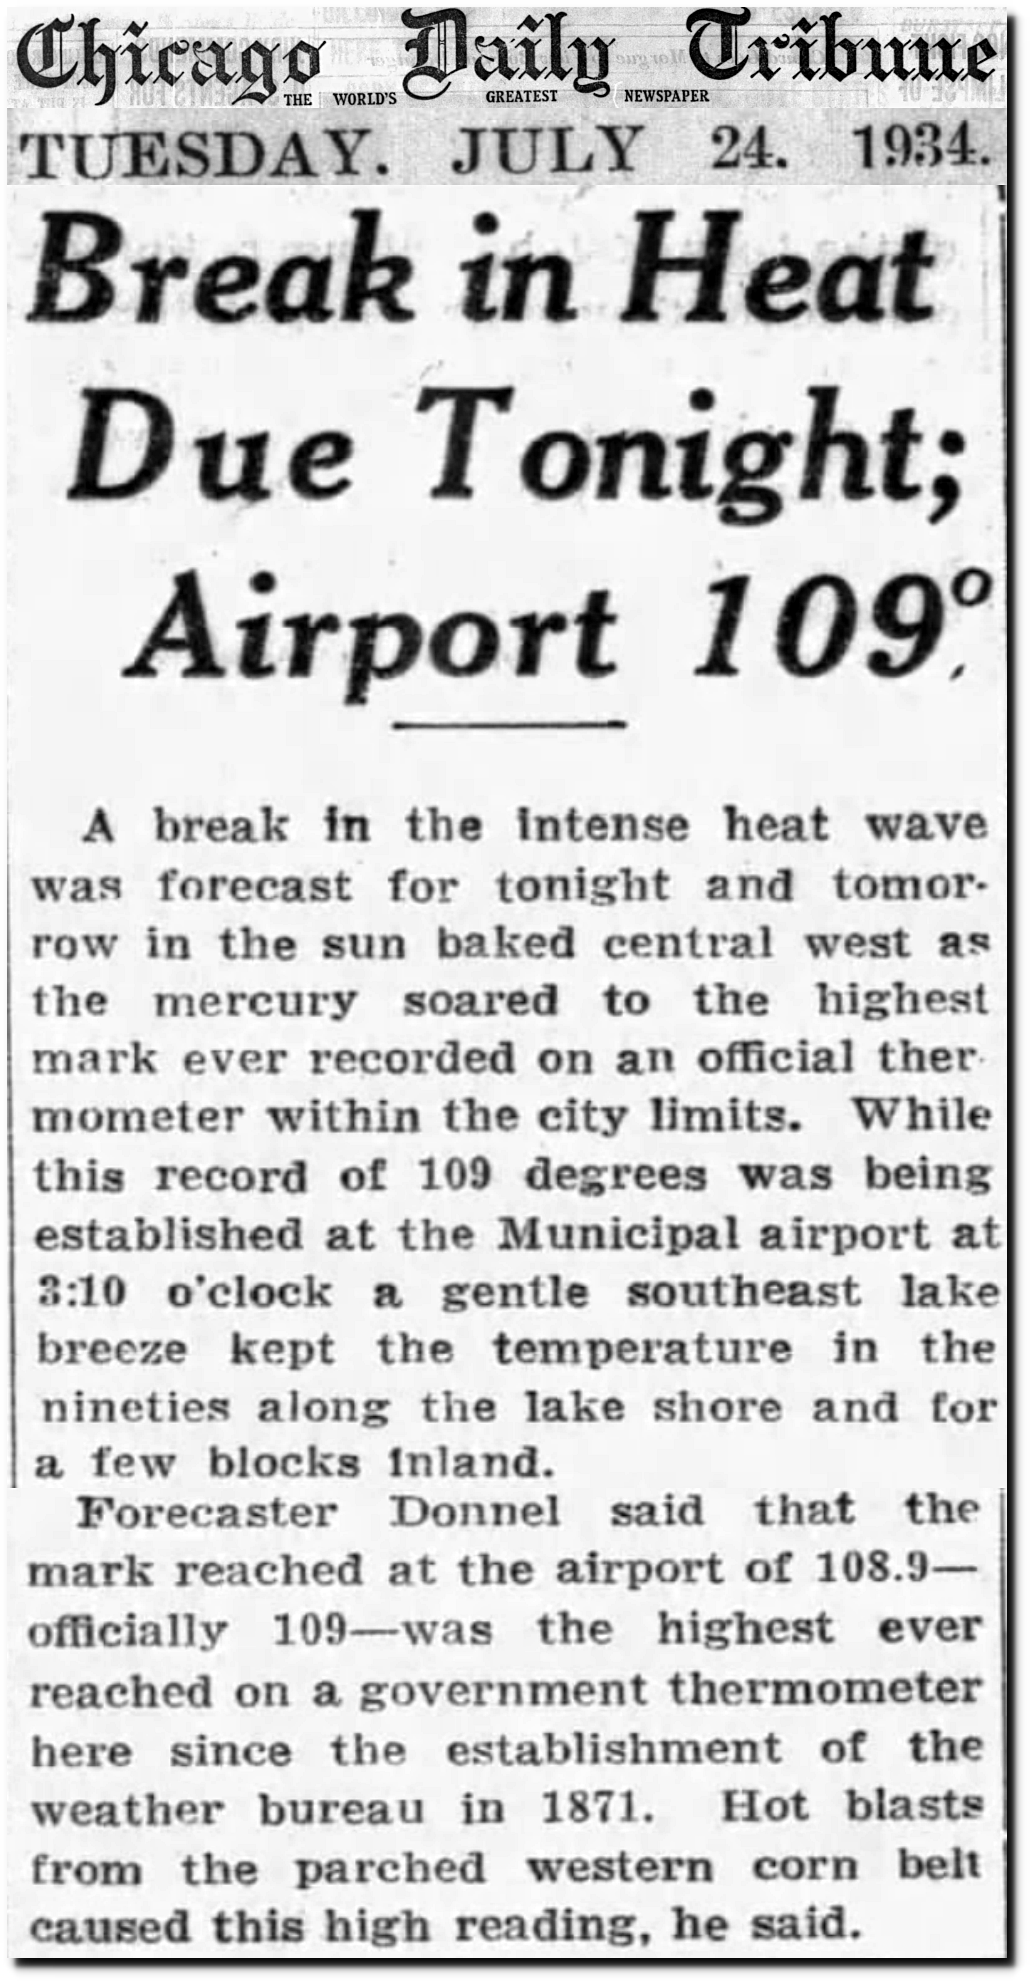
24 Jul 1934, 1 – Chicago Tribune at Newspapers.com
During the summer of 1936, Detroit had 275 heat deaths in six days, averaging one every ten minutes.
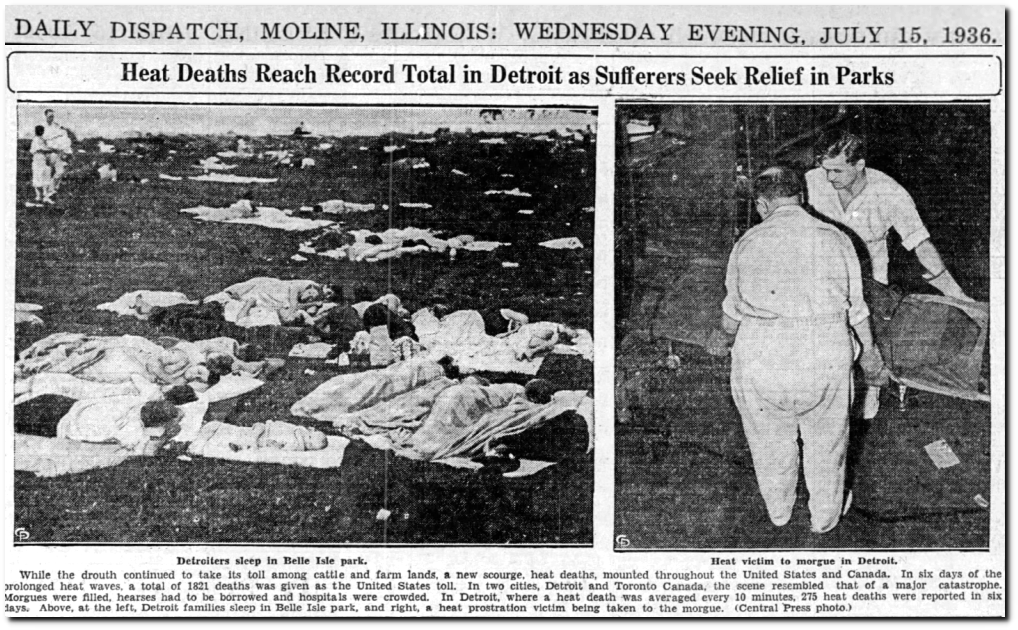
15 Jul 1936, 15 – The Dispatch at Newspapers.com
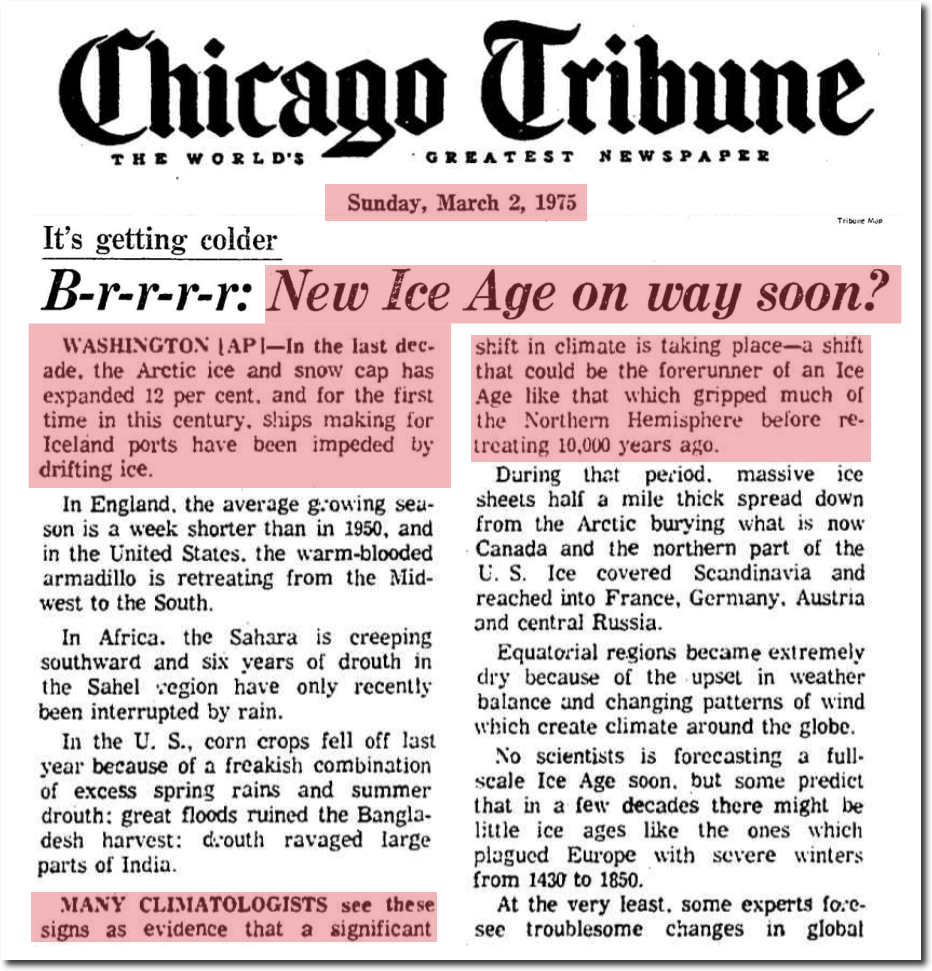
March 2, 1975 – B-r-r-r-r: New Ice Age on way soon? | Chicago Tribune Archive