My previous analysis of Australia was incorrect. I wasn’t properly differentiating between stations with only precipitation data, and those with temperature data. That caused me to include stations with no temperature data in 1895.
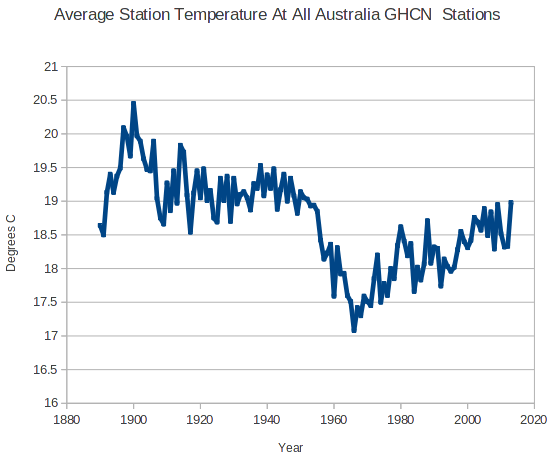
The graph below shows the average station temperature at all 1650 Australia GHCN stations with temperature data. It creates the impression that Australia has cooled dramatically
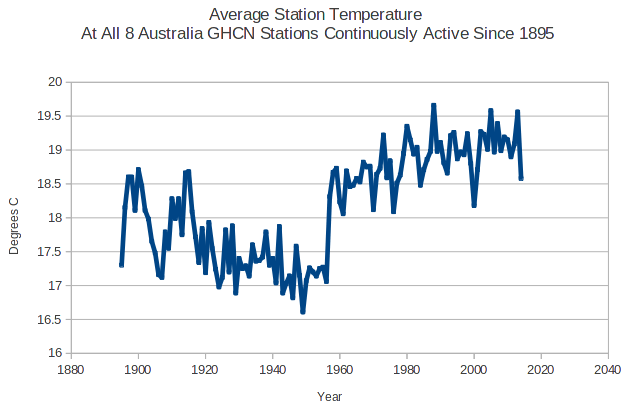
But if I look at only the eight stations which have temperature records from both 1895 and 2014, it looks completely different. A large discontinuity around 1960.
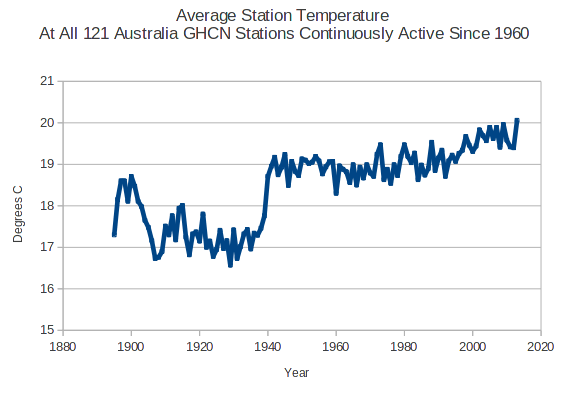
I see a different discontinuity (at 1940) if I filter by stations active since 1960.
The only thing I can infer from this is that Australia cooled after the 1890s and has warmed recently. I doubt that there is a valid way to make sense out of this data set. You could probably come to any conclusion you want by picking the right set of stations.


Hi Steve see this gem.. Laurel aka ozspeaksup 🙂
No, the Bureau of Meteorology is not fiddling its weather data Lisa Alexander & Andy Pitman Australia is a leader in the complex data-adjustment techniques needed to correct historical temperature records and our bureau’s overall changes have, in fact, tended towards less warming.
Can you be a bit more explicit? Do you mean less warming as a trend? I don’t see any of this in the graphs on this page, however I see impossible discontinuities.
“impossible discontinuities”? Maybe not. But totally implausible.
thanks for the correction.
Albany is oldest continuous set of met records for Western Australia.
Newcastle Nobby’s Lighthouse is second oldest for NSW after Sydney Observatory.
In 2009 neither showed any warming as there is minimal UHI effect.
Now they do in BOM and GISS websites post ACORN adjustments.
Any chance of selecting those two out of your unadjusted data sets and charting those?
Great job Tony … I appreciate the mess u are trying to sort out and unravel.
Just goes to show that the temperature networks were never designed to measure subtle temperature variations over long periods of time.
Jo Nova has several threads on the Australian temperature record. One point that stood out is the temps were TRUNCATED to the nearest whole degree….
http://joannenova.com.au/2012/03/australian-temperature-records-shoddy-inaccurate-unreliable-surprise/
There are probably only a half dozen stations worldwide that are suitable for measuring changes in climate. Suitable stations are 1) rural, 2) no nearby urban development, 3) no major land use changes, 4) no changes in location of any kind, and 5) have a century of measurements with little, if any, missing observations.
Climatologists should look for those type of stations and use them to infer regional climate variations. A single good station is better than 200 poor stations that have been homogenized somehow. Getting a global temperature record is beyond the capabilities of the present and past networks.
And yet the scientific community seems to have no problem pinpointing global temperatures going back thousands and tens of thousands of years. Yes, I know there are ways of getting estimates, but they sure weren’t relying on any humans with a thermometer in their backyard taking daily readings. 🙂
As a laymen it seems to me that the whole academic field of climatology (which I understand is one of the newest academic disciplines) has a lot of maturing to do before we start taking anything they say at face value, especially a revolutionary new unproven hypothesis about the influence of CO2 on global temperatures.
The cart is leading the horse in climatology, I think, and it’s time to start appllying the scientific method more seriously in the field.
Frank Lansner and Nicolai Skjoldby have been literally digging in the old temperature records (physically looking at the old logs)
WUWT article on Frank’s The Original Temperatures Project
^^^^^^^^^
READ!
Als read Jo Nova’s Article on Frank’s work Have you wondered what the global raw rural data tells us? Messages from the global raw rural data. Warnings, gotcha’s and tree ring divergence explained!
You may also want to take a good look at their site – lots of info.
http://hidethedecline.eu/
(I tripped over this old post at Jo’s that looks mighty interesting. THAT famous email explained and the first Volunteer Global Warming Skeptic.)
I used to have a pointer to a “rural temperature” ” interactive map”
(John Daly maybe?) I can not get this page to load to check
(wwwDOT)ohn-daly.com/stations/stations.htm
“4) no changes in location of any kind”
That’s a problem. Without serious investigation of every single station’s history, there is no way to know if it has been moved. Has Goomalling moved? Who would know?
Tony
Take the eight stations, and see if they all have the same uptick.
My experience of looking at the longer running stations is that the 1890’s were at least as warm as now,
This leads us onto the next question – are the GHCN numbers the same as the raw ones you can get (?) from BOM? And are they raw GHCN or adj GHCN?
I would guess that you are dealing with too much corrupt data.
No chance until you start looking at individual records and dealing with them.
SG:I reckon you and JM could do an interesting combination analysis of just a few reliable rural Aussie stations just like CET (which is reliable and shows nothing (no warming to this date anyway)
My guess is you are already doing this?LOL. This could really affect BOM and the VERY few fraudsters there (my guess 1 to 3 persons in charge, at most). Most are just following orders like the Waffen SS did in Germany.
Seems its been done Jo Nova’s site and yes it shows warming bias for 17 stations.
Thank you, Steven aka Tony, for your efforts to catch the “greased pig” of pseudo-science.
It is almost impossible to distinguish reality from consensus propaganda in post-normal science:
Stars generate or consume hydrogen
Neutrons attract or repel neutrons
The universe fragments or collapses
Two great scientists who witnessed abrupt changes in science at the end of WWII – Astronomer Fred Hoyle and Nuclear Geochemist Paul Kazuo Kuroda – left hints in their personal autobiographies that science went suddenly astray immediately after WWII, about the time George Orwell started writing Nineteen Eighty-Four.
What happened? Frightened world leaders tried to save the world from annihilation by taking totalitarian control of society and hiding the source of energy that destroyed Hiroshima and Nagasaki.
But that is the same source of energy that powers the Sun:
https://dl.dropboxusercontent.com/u/10640850/Solar_Energy.pdf
It took several decades to figure out what happened because of a black-out of key information:
1. Stalin’s troops captured Japan’s atomic bomb plant at Konan, Korea in late August 1945, and
2. Unreported CHAOS and FEAR of nuclear annihilation convinced world leaders, we are “BETTER RED THAN DEAD!”
One, simple, easy word describes this, rather well…FUBAR.