
One of the things which makes alarmists stupid is that several climate monitoring satellites were launched in 1979 – the coldest year on record in the US and the much of the Arctic. Then these geniuses draw straight lines beginning in 1979, and come to idiotic conclusions which would fail a middle school science exam.

Alarmists aren’t stupid, they’re motivated by ideology. The truth is irrelevant.
I notice whenever I reference actual temperatures when commenting on the NY Times, my comments are not approved. I also noticed they only approve 1 out of 5 comments even though my comments are respectful and relevant. They must want to reinforce the impression that support for climate change alarmism is overwhelming.
Correct. It’s like any form of religion – the feeble-minded find it attractive because it offers apparently simple solutions to complex problems. That and the fact that it provides the opportunity to rub shoulders with other feeble-minded people.
… the fact that it provides the opportunity to rub shoulders with other feeble-minded people.
Hence the Climate March!
CFACT reported:
No wonder they got a lot of college kids to march. A free bus trip with your buddies to party in the Big Apple [GIRLS!!] No wonder most had no idea of what was actuallybeing protested. No wonder they left a trail of trash in their wake.
Can you say ASTROTURF!
The ideology of money.
Unlimited power.
Well, they can be stupid and/or motivated by ideology. The two aren’t mutually exclusive. By definition, 50% of the population are of below average intelligence. Overwhelmingly, those stupid, gullible individuals believe whatever they are told by the media favourites.
Some climate scientists, such as Mann and Jones are criminals – pure and simple. Others, such as Hansen, Gleick and Nuticcelli are simply below average intelligence fools.
Every generation has a fight between the rational and the irrational. The subject matter changes, but human nature does not.
Yes, truth to them is irrelevant. One blog he said NASA confirms loss of ice and I said that contradicts what an NASA said.
One NASA said to the other ASA…..
Cherry picking is only for deniers. Alarmists have *cough* really good reasons for starting everything from 1979, something someone called “the mother of all cherry picks”.
How about a gif animation showing the real trend line vs. the cherry picked 1979 trend line on the graph?
That is part of the problem. There is no “real trend” line — there are only specific trend lines based on specific choices. For instance, should the “real” trend start in 2000? or in 1980? How about 1000 years ago? 10,000 years ago? Is the “real” trend linear? Or logarithmic? Maybe it is some asymptotic line? Or is it a cycle? All of those are possibilities, and some of them are even useful, as long as we remember that the process of choosing has constrained them in very important ways.
Even with all those caveats in mind, we need to remember that while there is no single “real” trend, there are some choices that are very likely worse than others. Starting or ending a trend line on what appears to be an outlier (such as 1979 being the largest Arctic area in recent decades) can certainly give us a lopsided view. Additionally, trying to place a linear trend on something that we know is most likely cyclical (especially when the data set in question is shorter than a couple cycles!) is equally dangerous. The CAGW crowd have outdone themselves by using both outliers and inappropriate linear trends in the same graphs!
In reality, it is “none of the above”.
In short sections it may look sort-of linear, and in the longer term shows some cyclical nature (if one discounts the massive adjustments which were intended to make it mostly linear from about 1930-2000)
Basically, a better description would be a chaotic cyclical system with “events”. These “events” are driven by changes in ocean currents, solar input etc.
Attempting to analyse with any particular “type” in mind, is almost bound to be a failure.
Looking at trends in temperature averages is like looking for directional trends of a car running in the Le Mans. You cannot say how fast or what direction the car is going unless you also say “Over how long a time period? Starting when? Ending when? Is it on a curve? Is it on a straightaway? Accelerating? Braking?”
Additionally, even if you point out all the needed parameters that define a particular analysis, you might still end up with a trend that is elegant and pretty, but functionally useless for predictions in cyclic or chaotic systems.
Details don’t matter much in propaganda — but they sure do in science!
ps.. Bob Tisdale recognises these “events'”, particularly the El Nino ones, which, under a strong solar output seems to cause a step up in the temperatures (a fact which the alarmists almost always rely on to create their linear trend. The go linear across the step event of the 1998 El Nino. DOH !!!
One should note that the La Nina/El Nino around 2010 did not cause a step up, the temperature settled back to a fraction lower than before the event. I suspect this is because of the much lower solar output.
Good point, I should be more careful about discussing “real” trend lines, at the end of the day it really is a subjective thing.
After I posted this, I thought back to something I saw a few days ago.
http://www.skepticalscience.com/graphics.php?g=47
Those discussing and debating how to visualize and interpret this kind of data DO seem to approach it in this way. So although your point about there being no “real” trend line is valid, I think there is still value in using subjective trend lines to debunk things like cherry picking 1979 as a starting point for mainstream climate analysis.
Hey KTM! “I think there is still value in using subjective trend lines to debunk things like cherry picking 1979 as a starting point for mainstream climate analysis.”
Absolutely! I think you are very much correct. As long as people state clearly what criteria they are using for finding any given trend, and as long as they remember the limitations that those criteria impose, trend lines can be very useful! Unfortunately, a lot of people think that a trend line is some sort of absolute truth. They forget that any trend is only one way of looking at the data, and that it only describes a certain portion of the data. Absolutely, trends are useful — but only insofar as we remember what those trends purport to cover.
For a silly example, the next time someone tells you that the world is warming up, tell them that no, it is definitely cooling. How do you know? Just extend that temperature trend back 13.8 billion years and everything is cooling since then… A CAGW supporter may think that using such a trend is silly, but a cosmologist would say that the same trend is very useful. (Of course a real climatologist would think that a 35 year trend from 1979 is silly when there are known cycles of 60 or 70 years.)
A simple case.
If you throw a ball, up in the air…. 2/3 of the way through its flight, it is still trending upwards from its starting point.
Yet this is the way climate science does trends 🙂
Desperation.
It if is warmer than the coldest year on record, that proves global warming. Right!
Sure! In fact, if it is warmer than the coldest year, that proves it is still warming, even as we speak!
🙂
Perth Australia
Thursday Max Temp 21 C
Friday Max Temp 22 C
By December we will hit 40 C
There it is. In black and white.
Proof the world is warming out of control and the planet is beyond saving.
Alarmists need to give all their money to me as they are doomed anyway.
I will then hop on the next Indian rocket to Mars and escape the horror of a cooked earth.
Or I will go to the Maldives and await the sea level rise in a 5 star hotel.
My a/c number is 555-2798-643 under the name A Sucker.
Ha! Wow, Andy! I am really sorry about Australia burning up, but look on the bright side. There is now no need to mine all that coal for your power plants. Just move the boiler out into the sunshine and you will soon get steam for free. What a great country you have!
🙂
Maybe the public should demand (vote for) politicians with some science or engineering background, along with whatever legal or other education they may have. It may be smart for political parties to nominate such candidates.
Engineers with MBAs make great managers.
What ???, hold on there for just one second;
“Engineers with MBAs make great managers.”
Not in the many cases I’ve seen, engineers that get MBA’s are usually not that good at engineering, that’s why they are not in much demand and have enough time to pursue an MBA. Seems like they lose 20 IQ points as soon as they get the MBA.
Just my observations after several decades in a now bankrupt multinational corporation. The former engineers with an MBA helped kill it, no technical vision, no realization of the possibilities a new technology provided. Just the ability to figure out the “ROI” over the next 4 quarters…..
Watson at IBM said “I only see a market for perhaps 5 electronic computers (1950’s)”.
Good thing Jobs (et al) ignored him.
MBA’s are great at calculating the “cash flow”, but they can hardly tell which end of the cash cow the udders are located on.
I apologize in advance to all the MBA holders I have just insulted, but that’s my opinion. And I’m sure there are exceptions (Great MBA’s that can also design bleeding edge products) but they are few and far between.
Cheers, Kevin.
My experience has been with local government, where the engineering background has brought practicality to the table.
In my experience, some of the most entrenched linear thinkers … and I use the term “thinkers” loosely. Mind you when the top IQ’s in LG don’t get to 3 digits anything in double digits looks promising.
Ah, but Kevin they are masters of the ‘process’ … ticking the boxes, that there was no attainment of the business objectives is not important. I see this everyday in my profession … these linear thinkers.
My husband and I have a saying to discribe a very bady managed company. “They have been Harvard Business Schooled.”
Often a recent Harvard Business School Manager would come into a small company, refuse to authorize any routine maintenance or needed research. The bottom line looked great for the two or three years he was there and he would use that to bootstrap himself into a bigger company.
Of course a year or two later all the maintenance problems and lack of inovation would come home to roost but who cares if the company goes bankrupt then. The Harvard Business School Manager is off to trash yet another company on his way up the ladder to sucess.
(Two of the companies I worked for got Harvard Business Schooled.)
Ran across this several times. Companies using “bubble gum and bailing wire” to keep manufacturing because some bean counter is looking to make a name for himself. One can only fault the upper management of the Corporation when they allow this to happen at plants that are intended to be an on going concern.
I learned to ferret such plants out by research and not waste my time soliciting their business for my products which would increase the performance life of pneumatic or slurry material transport systems.
Other mostly large companies I learned to avoid were those which were entrenched with the OEMs. Had to learn that the hard way when customers took my proposals to the OEMs who then implemented them. One even used a drawing of mine to go out for quotes.
I learned a shorter version of that concept:
Tony! I almost forgot to answer your question, “What Makes Alarmists So Stupid?”
The answer? Practice. Practice. Practice. Years and years of unrelieved, unstinting, practice.
All we know for sure is that atmospheric CO2 is increasing at alarming rates. It is holding all the excess heat (called the “greenhouse effect”) that the deep oceans can no longer hold. At some (tipping) point, the atmosphere will explode, causing the entire planet to explode. We won’t even hear the shock wave!
Sleep well….
s/
An unfortunate byproduct of their stupidity is the number of folks they can take down hard in a rather harsh fashion:
http://northwestpassage2014.blogspot.com/2014/09/norwegian-hull-club-warns-on-arctic.html
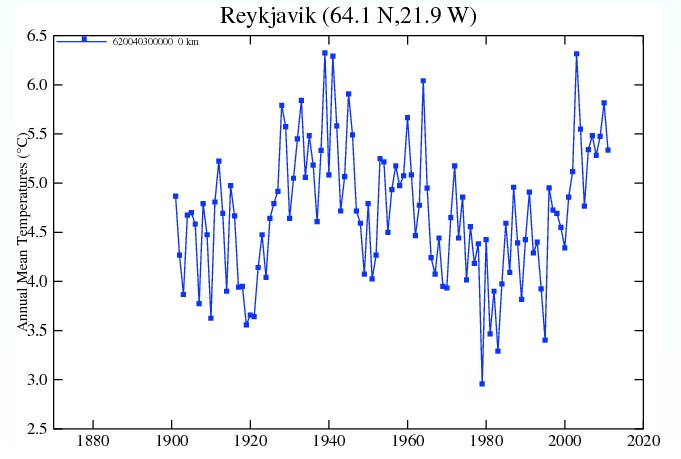
I always liked to show the temperature trend for Reykjavik until they messed with it. The (almost) perfect temperature site, and they messed with it. A temperature record that showed no AGW until they messed with it.
I don’t know where the Reykjavik temperature is measured but there is likely some UHI in the measurement since the 1970’s. Modern Reykjavik bears no resemblance to the small town that existed in the 70’s. I went there earlier this year; I was last there in 1974.
Stupid or diabolical?
To Serve and Protect
http://www.foxnews.com/us/2014/09/25/woman-punched-on-film-by-california-highway-patrol-officer-reaches-15m/
FBI Says No One Killed at Sandy Hook
http://hw.infowars.com/wp-content/uploads/2014/09/larger-conn-report.jpg
They use 1979 to show an upward trend, but they should be using 1945 because that’s when CO2 levels started rising. Look what would happen if you used 1945!
Hey Morgan, yeah, it is the darndest thing.
They can tell us global temperatures from a thousand years ago, based on the rings of a handful of trees in Siberia… but for some reason, they can’t estimate Arctic ice from 50 or 100 years back when they have the written records of people who observed it.
What Makes Alarmists So Stupid?
Because they’re fed a steady diet of crap like this and believe it: http://www.breitbart.com/Breitbart-TV/2014/09/24/MSNBC-Guest-Global-Warming-to-Cause-the-Oceans-to-Shut-Down-in-20-Years
keep them rolling steve,you have been on top form for a long time now . i hope the site traffic reflects your direct style, it is a winner in my book. to answer the question,piss poor politically correct education is the beginning of the stupidity,and then,as jason calley states,they practice real hard.
114 years latter and some can see the connection between land and ocean temps. AMO is calculated by this, Use the Kaplan SST dataset (5×5). http://www.esrl.noaa.gov/psd/data/gridded/data.kaplan_sst.html
0 to 70N.
https://twitter.com/NJSnowFan/status/515176695083835393/photo/1
Do you have a link to your chart/data or did you make the chart off the data Tony.
Thanks.