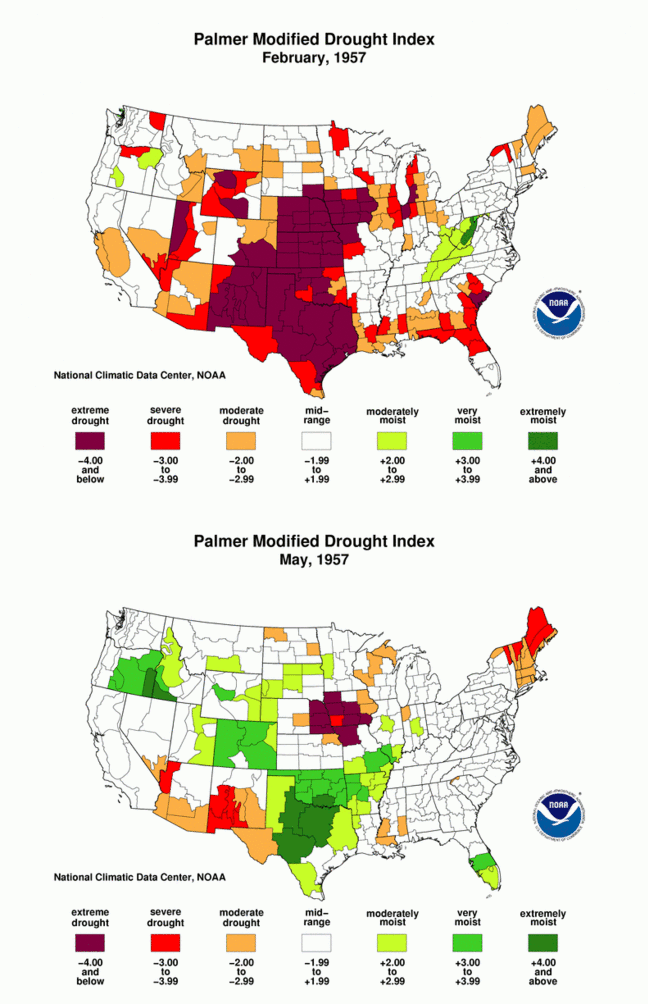
Drought is not increasing in Texas
Between February and May 1957, Texas went from extreme drought to flood. Just like it did this year.
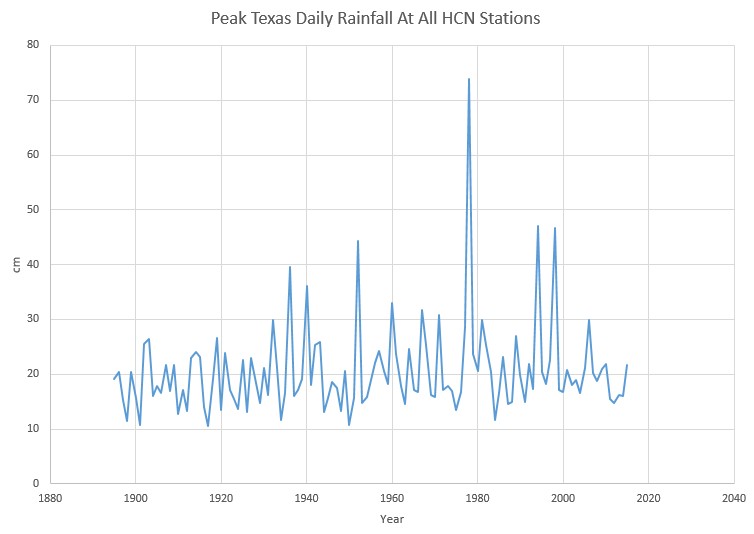
Peak Texas rainfall is not increasing
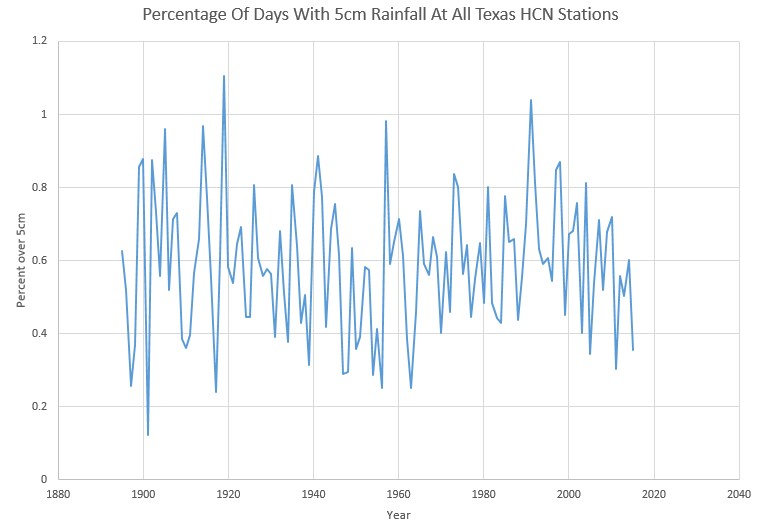
Frequency of heavy rainfalls is not increasing
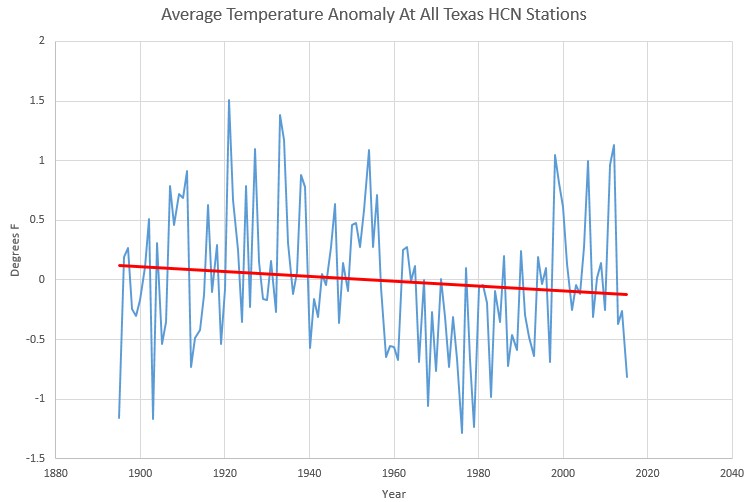
Temperatures are not increasing in Texas
Every single claim being made about Texas climate by “experts” – is patently false.


For a place prone to such drought, you would think they would go to more trouble to capture the water they get in these big events.
If its anything like it is in Australia (similar drought or plenty climate), the Green anti-environmentalists will fight tooth and nail to forbid any new dams.
They will also be the first to bitch when the water runs out.
We usually have a few hundred who capture it in their cars on I-10.
Hey NoMoreGore! I think that Texas actually does have an ongoing program that recaptures much of the water. Wherever practical, excess rain water is channeled to run into sinkholes and drainage areas where it will percolate back into the Edwards aquifer and replace the water that has already been pumped out. Good idea, in my opinion.
Someone please correct me if I am mistaken about that, but that is my understanding of the process.
Perth (Western Australia) tries to do that too. They even treat waste water to very high standards and recharge the aquifers with that.
Perth is the one place in Australia that desal plants makes sense over dams. (low rainfall, and flat porous terrain)
“….Climate change now under politicians’ control,
Man made of course, Mother Nature’s no role.
Pre-1970 climate and weather amnesia persists,
It’s the basis on which this pseudo-science exists…..”
Read more: http://wp.me/p3KQlH-8d
The US National Academy of Sciences betrayed the American public after frightened world leaders agreed to unite nations (UN) and national academies of science (NAS) into a gigantic, worldwide “Orwellian Ministry of Scientific Truths” on 24 Oct 1945.
Every federal research agency – NSF, NASA, DOE, EPA, etc. – was forced to go along with the deception. The US National Academy of Sciences reviewed the budgets of all these agencies for Congress.
Our political groups are starting to awaken to the NAS betrayal of the American people.
https://reclaimourrepublic.wordpress.com/2015/05/27/one-nation-under-surveillance-the-nsas-technotyranny/
http://www.weatherplaza.com/en-US/sat/?region=usa.vis
Warmunists are harping about the heatwave in India… which happens every year… kills people every year…
https://m.facebook.com/groups/climate.discussion/454171724750992/?ref=notif¬if_t=like
El Niño stops the wind at the equator. The monsoon is delayed about a week.
http://www.sat24.com/homepage.aspx?page=io
Very powerful posting me thinks. This site, Homewood ect are really the only ones dealing with the problem in a coherent way these days.
Every time the “experts” say the climate is changing, it’s usually relative to about 30 years ago, which coincides with the WMO definition of “normality”.
They rarely look further back than that, which would tell them that current weather is not unusual.
This is either deliberate lying or extreme stupidity and surely the “experts” can’t be that stupid?
Let’s suppose you say that around 1940 was a local peak temperature for the Northern Hemisphere, and the unadjusted temperature scale shows as much. Then 1957 would be 17 years after the peak.
Let’s suppose perhaps 1998 was our recent peak warming, and it’s been cooling since then (which is indeed what unadjusted thermometers are saying) then it’s been ohhh about 17 years after the peak I suppose. Probably complete coincidence, but it would fit the pattern.
The suggestion would be that we can expect a total of 35 years of cooling, out of which 17 are already passed, putting the next low point at around 2033 (previous low point was 1975). I doubt those warmists can keep their propaganda going long enough… Surprisingly enough, this time scale would almost exactly match David Evans article from 2009.
http://joannenova.com.au/2009/04/climate-bull-or-bear-trend/
Then again there was this guy called Eduard Brückner who found 35 year periods in all sorts of historic data. He was onto the idea even earlier than David Evans.
https://stevengoddard.wordpress.com/2012/06/06/1904-bruckners-law/
Astounding that from May 1957 to May 2017 is indeed a neat 70 years = ( 35 + 35 ) years.
All those bits of data the modern climate scientists have been unable to erase… they just keep right on popping up, here, there, everywhere.
Crap, no 60 years. Doesn’t quite fit.
To restore constitutional governments, we must first restore integrity to scientific research.
1. AGW is false: The Sun controls Earth’s climate
2. SSM is a lie: Stars make and discard hydrogen
3. BBC is false: The universe has no known limits
4. SNM is a lie: Each neutron repels other neutrons
Mainstream scientific literature evolved into scientific rubbish after nations and formerly independent national academies of science were united into an Orwellian Ministry of Consensus Science Truths on 24 Oct 1945.
References:
1. “Solar Energy,” Adv. Astron. (submitted 1 Sept 2104; published privately 17 Mar 2015)
https://dl.dropboxusercontent.com/u/10640850/Solar_Energy.pdf
2. “Supplement for Teachers” (privately 30 Mar 2015) https://dl.dropboxusercontent.com/u/10640850/Supplement.pdf
3. “Intro: Science for Teachers” (published 23 May 2015)
https://dl.dropboxusercontent.com/u/10640850/Introduction.pdf
If any of you guys are interested, there is free, university sponsored, online course about monitoring climate from outer-space, here.
https://www.futurelearn.com/courses/climate-from-space/welcome
I’ve taken courses with them before and there is a chance in the comments section, after the end of each lesson, to make your thoughts known. It starts on the 8th June, for 6 weeks and each lesson lasts for 3 hours, which you can complete at your leisure. I’m not sure what their bias is on climate change, I suspect it may be contrary to ours, so if it is, it would be good to have people participating in it, who are knowledgeable enough to challenge them. ( I assume it accessible from outside the UK?)
But even in the normal cycle of things it seems that mostly dry West Texas may have a truly exceptionally wet year. http://www.currentresults.com/Weather/Texas/average-yearly-precipitation.php
Average Annual Precipitation for Texas
West Texas
Annual precipitation totals
Days Place Inches Millimetres
69 Abilene 24.8 630
72 Amarillo 20.4 517
61 Del Rio 19.5 496
53 El Paso 9.7 247
69 Guadalupe Mountains Park 18.0 456
36 Lajitas, Big Bend Park 10.9 276
66 Lubbock 19.1 486
62 San Angelo 21.3 540
Reference
National Climatic Data Center. NOAA’s 1981-2010 Climate Normals.
The ever predictable Hayhoe was on CNN tonight explaining Texas flooding as due to AGW. Only reason I saw it was that I was in a hotel. Really creepy stuff. She has a very creative imagination.