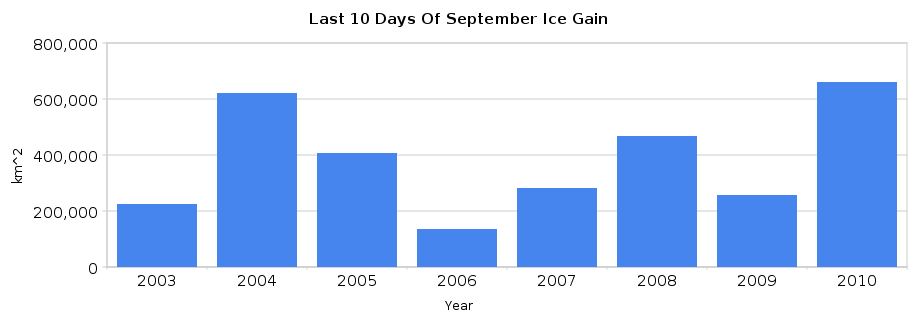
It”s official. From September 20-30, JAXA gained 661,250 km² of ice. That is more than 11,000 Manhattans, and is the fastest start to winter in the JAXA database.
Obama’s top science adviser – John Holdren – claimed that we are headed towards ice free winters, but apparently he has no clue what he is talking about.


Steve,
I alway enjoy reading your post at Wattsupwiththat website. there, you explain something is clear to me. but here, on your own blog, is much different. I’m a little disappointed. Why don’t you write the same way as you did on Wattsupwiththat?
What is it that isn’t clear?
not clear?
compare your posts on Watts site and here on your own website.
I think, lots readers like your posts on Watts site. here you have not many readers. why? you think about.
I have lots of readers here and rising fast. Not a lot of posters yet though.
This blog was #82 out of 350,000 on WordPress earlier this week.
Well, I for one like the site Steven! Quick fire articles, it’s great.
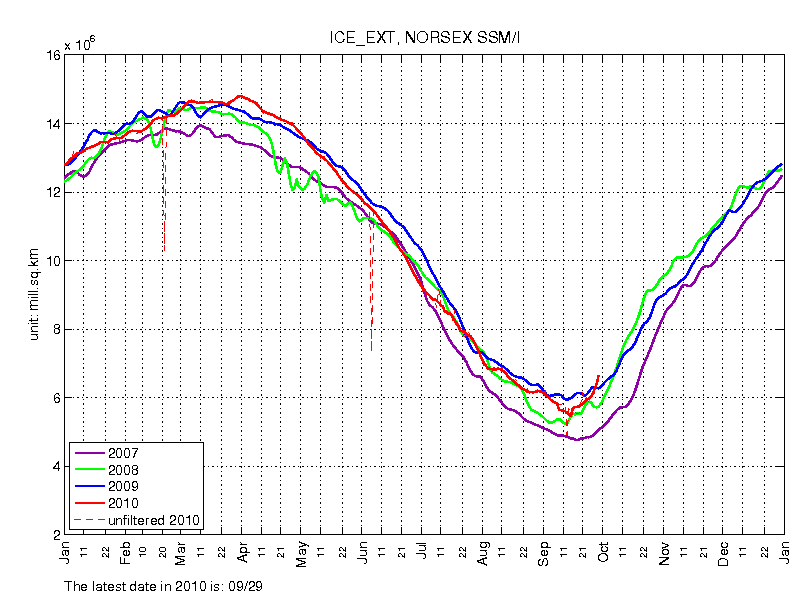
This graph looks good on the freeze up!
http://arctic-roos.org/observations/satellite-data/sea-ice/observation_images/ssmi1_ice_ext.png
Thanks, I added it to the article.
Well, what is different is the WUWT articles were longer. But Steve was not writing all the content on that site. Maintaining a site like this is a huge task. Generating a high volume of content has to be difficult. So I think we see more overall content from Steve here, but in more frequent, yet shorter articles. I like semi-long articles also. But variety means everything. I just appreciate that you are providing this information, Steve. Thanks!
Going. Up. Like. A. Rocket.
Pingback: Beaufort Sea Freezing Very Quickly | Real Science
Good to see that you have lots of traffic. Yes the articles are shorter but if I need to, I ask for more info (as above). I usually don’t comment unless I have something specific to say, or a smiley face one liner.
The more sites that question the conventional wisdom (crap), the better.
I like the rapid fire style to get ideas and facts out there. Maybe longer essay type posts could be put in a seperate category when appropriate?
And the ice extent in the Antarctic has not yet started decreasing and has even been increasing over the last few days.
http://nsidc.org/data/seaice_index/images/daily_images/S_stddev_timeseries.png
When I resided in Eureka, I was amazed at how quickly the ENTIRE fjord froze, IE in 1 day! Temperatures dropped to -10> -15 and it was covered in ice the next day. didn’t take long before we walked out onto the ice (before perpetual darkness took over) and we didn’t venture out very much after that, due to cold, dark, and for fear of running into the cute cuddly polar bear. Thankfully we had some dogs around to warn us in that event.
thanks for the update Steve.
It’s tremendously exciting to watch that red line moving upwards. Do you have any predicitions, Steve, about this winter’s maximum?
Steve, I think your blog is excellent. The format of numerous short postings that focus on presentation of data or analysis of same is perfect. Keep up the great work!
I hope you will also continue to send posts to Anthony at WUWT as time permits.
Environment Canada shows that this is the second lowest coverage for September 27th in Eastern Arctic, third lowest for Western Arctic, and by far the lowest for that date in the Hudson Bay. Graphs are in order stated:
http://ice-glaces.ec.gc.ca/prods/CVCHACTEA/20100927180000_CVCHACTEA_0005215235.gif
http://ice-glaces.ec.gc.ca/prods/CVCHACTWA/20100927180000_CVCHACTWA_0005215190.gif
http://ice-glaces.ec.gc.ca/prods/CVCHACTHB/20100927180000_CVCHACTHB_0005214589.gif
The ice extent is from 10 days to two weeks late right now by EV’s forecast, and from experience I would agree with them.
I’d say that we are headed for an over all record high. what is now open water will not be shortly. I a gree with Bastardi’s “Two Steps forward one back” on recovery.
Don’t change your current style.
Short to the point stories. No bla bla bla.
I love it.
Love the site and the blog. Keep up the enlightening work!
Thanks!
Thank you for this insightful blog. In terms of the “refreeze” and how it will affect next year’s ice, have you ever come across any information regarding November 2006 and how it might have affected the 2007 Arctic ice minimum? That one month saw little or no ice accumulation, but I have not seen any info on whether this was due to “rotten ice”, unusually warm currents, strong winds, or errors in data collection/processing (or perhaps a combination of any/all of these.)
I wish I had the chops to sort out this information, but I haven’t been able to find any good leads. It seems kinda fishy that the 2007 minimum is so often used by warmists as proof of AGW, while the 11/06 anomaly is seemingly ignored.
Gore does notmention that the Arctic has been cooling over the past 60 years, and is now one degree Celsius cooler than it was in the 1940s. There was a record amount of snow cover in the Northern Hemisphere in 2001. Several vessels were icebound in the Arctic in the spring of 2007, but few newspapers reported this. The newspapers reported that the North-West Passage was free of ice in 2007, and said that this was for the first time since records began: but the records, taken by satellites, had only begun 29 years previously. The North-West Passage had also been open for shipping in 1945, and, in 1903, the great Norwegian explorer Amundsen had passed through it in a sailing ship.
Not so fast now, is it Stevie boy.
http://www.ijis.iarc.uaf.edu/seaice/extent/AMSRE_Sea_Ice_Extent_L.png
Pretty bloody cold though! http://ocean.dmi.dk/arctic/meant80n.uk.php