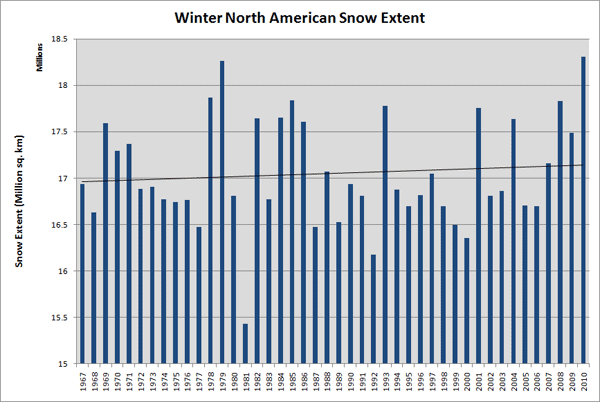
The EPA claims that North American snow cover is decreasing, when in fact winter snow cover is increasing. The past winter had the greatest snow cover on record according to Rutgers University.

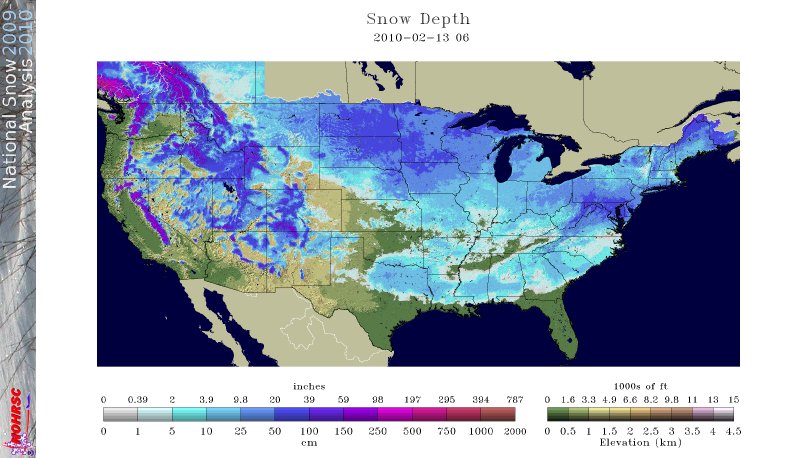
February 13, 2010 – Snowcover in at least 49 states, possibly all 50.
I remember how happy I was the day the Berlin Wall fell down. Little did I realize that it was just moving west by 4,000 miles.


Hi Steve;
The EPA graph of NA winter snow cover is dramatically different from the graph that you show. I note that their data is in millions of square miles and the data in this article is in millions of square kilometres (if I’m reading correctly).
As an example: at a quick glance the EPA data for 1978 shows about 3.75 million square miles of snow cover.
The chart in this article shows approximately 17.8 million square kilometres of snow cover. Using 1.6 km = 1 mile then 3.75 million square miles would equal 6 million square kilometres of snow cover (I think).
So for these years the data differs by a factor of 3. If I’m `not just being stupid’, then we need a reference for the data that you give as the values dramatically differ. Is their a different methodology, etc in the data collection. I am not at all questioning what you are saying, just some additional explanation and clarity is needed.
Thanks for putting up with my questions.
Philip
Do you have a reference for the EPA graph? The graph I included is the the Rutgers University graph, which I think is the most commonly used standard.
Holy crap! When I opened the publication you linked to, went to the snow and ice page, they showed the graph and said it was from the Rutgers University graph! It’s probably well worth checking out ….perhaps they homogenized their data? Could make a good post.
I assume you would prefer 49 states to be covered in crude oil.
I live near an oil field and have not noticed anything covered with crude.
I’ll bet you don’t drive a car, or use any products dependent on fossil fuels. Like food or a computer.
Shallow Hal!!
Mystery solved. They are taking the yearly average by week of area after converting km^2 to mile^2 (NA w/o Greenland).
Year Miles^2 Avg Area
1972 3398466.62801896
1973 3304521.08742886
1974 3303639.84142784
1975 3395082.70000336
1976 3275434.78919124
1977 3247550.9739503
1978 3641620.51110914
1979 3364528.57006081
1980 3187625.08757446
1981 3192534.60174284
1982 3333549.79209454
1983 3295939.67738519
1984 3171074.33593349
1985 3587948.61096705
1986 3328981.14178153
1987 3042938.45179999
1988 3066195.15442613
1989 3193544.41976255
1990 3036104.60447491
1991 3168247.2959308
1992 3224172.6813195
1993 3166354.01182265
1994 3124860.93205817
1995 3221748.15281678
1996 3363519.42771987
1997 3387544.666692
1998 3027734.93928986
1999 3034537.44798976
2000 3249022.47362574
2001 3240346.951181
2002 3334801.92139373
2003 3291399.1160042
2004 3268791.32240535
2005 3115889.07620697
2006 3093593.02792573
2007 3204363.22746291
2008 3278591.72131297
2009 3262269.79955112
I just did a linear fit through that data and it is increasing , not decreasing.
Final set of parameters Asymptotic Standard Error
======================= ==========================
a = 1631.55 +/- 2167 (132.8%)
b = 69.9804 +/- 4.313e+006 (6.164e+006%)
Steven,
I believe your analysis is in error. Just looking at the data, one can see a very tiny downwards slope. I am assuming that are using a slope times (x) function which will always come out positive if (x) is positive (time series in this case).
---------------------------------------------------------------------------------------[10/1/10 3:44 PM Plot: ''Graph1'']
Linear Regression of dataset: Table1_2, using function: A*x
Weighting Method: No weighting
From x = 1.972000000000000e+03 to x = 2.009000000000000e+03
A (slope) = 1.631588210518266e+03 +/- 1.177534253223456e+01
--------------------------------------------------------------------------------------
Chi^2/doF = 2.087700712620697e+10
R^2 = -0.107016561903376
Adjusted R^2 = -0.137767021956248
RMSE (Root Mean Squared Error) = 144,488.778547702
RSS (Residual Sum of Squares) = 772,449,263,669.658
---------------------------------------------------------------------------------------
With slope times (x) plus intercept, it does show a ever so slight decline in the yearly average:
[10/1/10 3:30 PM Plot: ''Graph1'']Linear Regression of dataset: Table1_2, using function: A*x+B
Weighting Method: No weighting
From x = 1.972000000000000e+03 to x = 2.009000000000000e+03
B (y-intercept) = 1.159183198494020e+07 +/- 3.856522934080974e+06
A (slope) = -4.191813036342162e+03 +/- 1.937435022559441e+03
--------------------------------------------------------------------------------------
Chi^2/doF = 1.715232408531104e+10
R^2 = 0.115068551033047
Adjusted R^2 = 0.0645010396635071
RMSE (Root Mean Squared Error) = 130,966.881635439
RSS (Residual Sum of Squares) = 617,483,667,071.197
I am sure it was an auto-function in your stats package.