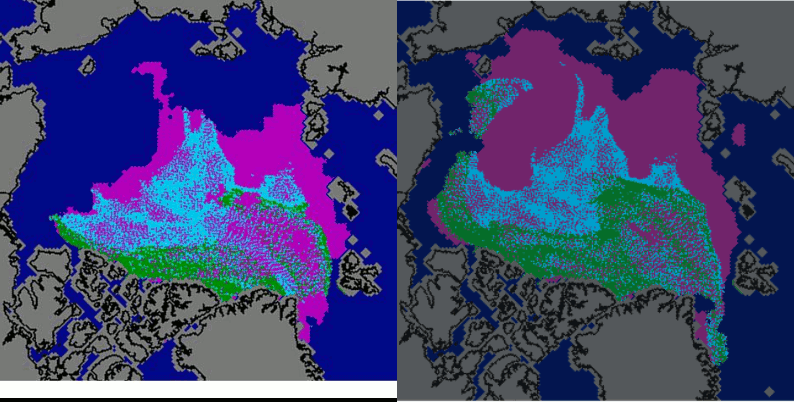
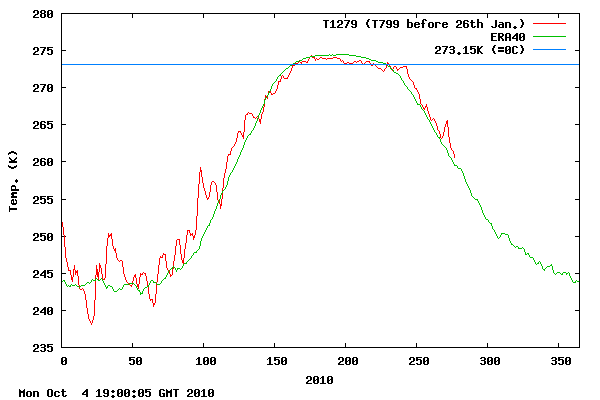
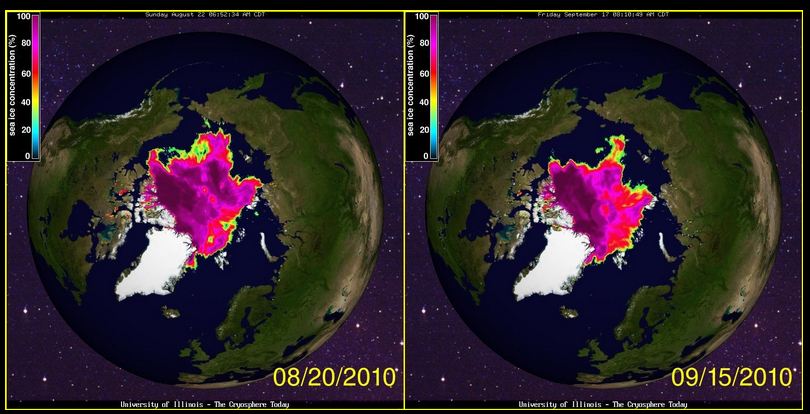
Any theories about this? NSIDC shows a huge loss of multi-year ice (green) around the pole, Greenland, and the Canadian Archipelago since the end of July. Given that temperatures in those regions have been quite cold since the end of July, I’m having a really tough time understanding what happened.
Much of that region has been below freezing for essentially the entire period.
Satellite data showed essentially no ice loss in that region since the end of July, much less loss of thick multi-year ice. Multiyear ice doesn’t just disappear without open water appearing. There was never any open water in most of the affected areas.
What their maps show is that the ice got younger, not melted. How does ice get younger?
There was never any open water along the coast of Greenland or The Canadian Archipelago this summer. How could the MYI have disappeared? This makes no sense.


Steve, do you have water temp stats?
http://nsidc.org/arcticseaicenews/
So they are suggesting that it melted below the freezing point, since the end of July? We are talking about regions near the pole.
The ice is sitting on water that is above freezing, hence my question about data for the water temp. If the water is melting ice at a greater rate than the air can freeze, then you get a net loss of ice.
There is no indication from satellite data that there was any ice loss in that region, much less loss of thick multi-year ice.
What satellite data would that be?
And I take it from your response that you don’t have water temp data?
There was never any open water in those regions this summer. Think about that.
Brendon: “The ice is sitting on water that is above freezing, hence my question about data for the water temp.”
Steve: “There was never any open water in those regions this summer. Think about that.”
OK, I thought about it. Your response doesn’t make any sense. He was talking about water under the ice, not “open water.”
How does multiyear ice disappear without melting away? Their maps show that the ice got younger. It went from MYI to 1-2 years old.
The ice at the bottom that is in contact with the water melts, the thickness decreases. The MYI loses the lower layers of ice and only the more recent years are left.
That theoretically makes sense, but doesn’t seem plausible in this case.
All of the younger ice (pink) in those regions from July survived, but the MYI disappeared? The areas of only first year ice would have melted out long before the MYI did..
Pink survives, but green doesn’t? I’m not buying that.
No indication other than the way it dropped to ~50-60% concentration and looked like a Swiss cheese on the MODIS images, you mean?
http://rapidfire.sci.gsfc.nasa.gov/subsets/?subset=Arctic_r04c04.2010247.terra.1km
North Pole is at the bottom left. The dark stuff is open water. That was multi-year ice that melted out and is now covered by a new skim of this year’s ice.
You are looking in the wrong quadrant. Most of the ice loss is shown in the SE and SW quadrants from the pole, where there was no open water.
Besides, those regions you are showing opened up due to tensile stress, not melting.
Oh sorry, I was answering the “around the Pole” part of your post.
The stuff in the Canadian Archipelago is a different process (and I pointed it out at the time) – the ice bridges between the island broke, and the old multiyear ice got flushed between the islands through a myriad of small channels, where it melted in the warm waters (!) of the main Northwest Passage. All the time through this summer where you were pointing out that the NW passage still had chunks of ice in it and hadn’t melted out yet – that was the old perennial flowing southwards through channels that are normally frozen solidly closed.
If you go and look at Nares strait over the last few days you can watch it happening right now, as the sea ice in the Lincoln Sea fragments and drains through it.
Nice theory, but that isn’t what happened. Those regions were never ice free this summer.
NSIDC´s sea ice age maps for the end of july and the minimum of september compared with AMSR-E concentration maps for july 21 and september 10:
http://img138.imageshack.us/img138/9216/image013.png
Multiyear ice lost in that area? Yes
But maybe not so much as is showed in the second ice age map.
MODIS images, same data:
http://img839.imageshack.us/img839/7474/image015q.png
Brendon,
Does the NSIDC have the water temperature data?
Well, even if the water temps are higher, wouldn’t heat loss be occurring?
I mean, Heat rises, through ice?
AGW physics escape me. Must work on Bizzaro’s world.
Pingback: Cross Section Through The NSIDC Ice Maps | Real Science
So warmer water below the ice can melt multi-year ice and leave first year ice behind? Pretty talented that warm water is.
This looks like an adjustment after the fact.
Next we will get the black smoker theory of selective ice loss in the arctic. “Heat vents target multi-year ice, but the leave first year ice behind.”
How is ice determined to be MYI? Is it based on thickness? Could MYI melt a little bit, become thinner and be classed as 2yr or 1yr ice by default?
Could you put together a blinker with 2 week increments so the progression of the loss of MYI is revealed?
These are the only maps available.
Fowler, Maslanik, Tschudi et al. follow the individual ice floes along the time using a variety of instruments: MODIS, RADARSAT, etc. That is the way to determine the ice age in that map.
I forgot to say that they use a treshold of 40% ice concentration.
The pink hole in the North Pole could be the area of open water seen in the right side of this MODIS image (september 7) : http://rapidfire.sci.gsfc.nasa.gov/subsets/?subset=Arctic_r04c03.2010250.terra
Do you think the ice melted there? I don’t see any indication of melt. That hole looks like it formed from tensile stress.
I don´t say it has melted. But the open water is there. And, with the refreeze, it will be covered by first year ice.
But I am in overall agreement with you, I think the september ice age map provided by the NSIDC looks very strange.
The color change from green to blue and pink at the north of the Canadian Archipelago has no sense for me.
I’ll ask the question again, but this time to anyone:
Does the NSIDC have data on temperature data for the water under Arctic ice?
A second question:
Does the NSIDC base their multiyear ice map on actual water temperature data or on computer models?
A third question:
Does the NSIDC base their multiyear ice map on actual measurements of the ice or on computer models?
Amino @ October 6, 2010 at 12:57 am says:
I’ll ask the question again, but this time to anyone:
Does the NSIDC have data on temperature data for the water under Arctic ice?
I don’t know if NSIDC has the data, although I am sure they do, but you can get the temperatures, updated daily on the bottom of this page:
http://www.weatheroffice.gc.ca/analysis/index_e.html
Also you can get the water and air temperatures from some of the ships operating in the area from Sail WX:
http://www.sailwx.info/shiptrack/shiplocations.phtml
A third question:
Does the NSIDC base their multiyear ice map on actual measurements of the ice or on computer models?
Probabily a bit of both. Ice in the shipping lanes are recorded daily from a combination of satellites, ships, and onshore inspection. Up by the poles they can not measure it except for a small window in spring, but the area is so big that it will not give much information.
A lot of your question could be answered in this manual:
http://www.ec.gc.ca/glaces-ice/default.asp?lang=En&n=4FF82CBD-1
There are definate differences for second and MYI. See 1.2.5 Old Ice in above manual.
Pingback: Más sobre las inconsistencias en los datos de hielo multianual | Banquisa en el Ártico: el blog del hielo marino
This is an old thread, but deserves a few comments.
First off, there isn’t enough data here to establish what happened to the multiyear ice. Anything that anyone says regarding 2 images is purely speculation.
The maps that you’re looking at are based on satellite observations. You haven’t provided a link to the original source of the graphics. There’s probably an explanation there for how the maps were created. I suspect that they’re passive microwave images. Those are pretty low-res images. That is to say that they average the properties of the ice over a fairly large footprint. Thickness is one property of old ice, but so is salinity and the presence of brine tubes.
Ice is in constant motion, driven by wind and currents. I know that in some years, a lot of ice is flushed through Nares Strait into Bafin Bay, where it melts. It could also get flushed into the Beaufort and Chukchi Seas and melt there. And the ice can melt in place. Sunlight striking the ice surface can actually penetrate the ice and warm the water beneath, causing melting from below.
If you really want to find out what happened to the ice, you’ll need to do more investigating. You might start with ice analyses from the national ice center (google it). They have an archive of weekly ice analyses. You’ll need to interpret the “egg code”, but there is an explanation available.