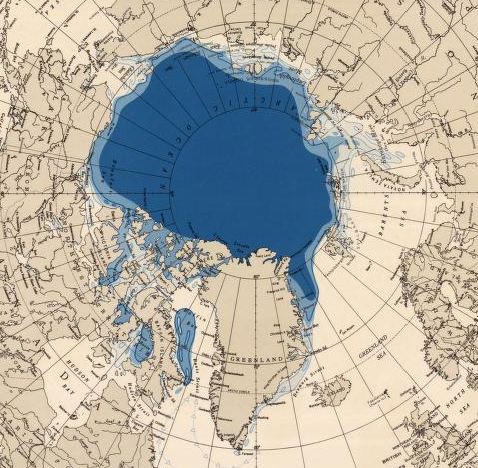
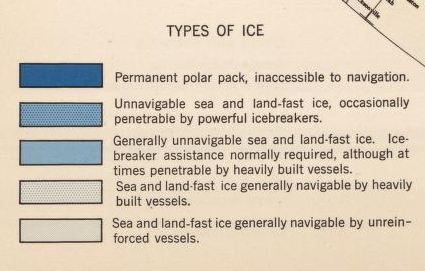
Reader Gary Boden forwarded me a nice collection of online Arctic ice maps made by the US Navy in the 1940s. The map below is from September, 1946.
David Rumsey Collection : September 1946
As you can see, there was a lot more summer ice in 1946, particularly thick “permanent” ice.
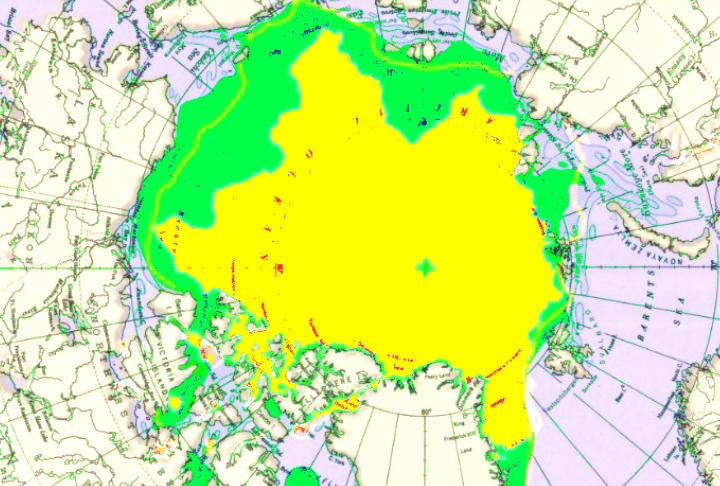
The map below compares NSIDC end of September extent (yellow) vs. the Navy map (green.)
This map supports Julienne’s assertion that the ice pack has been declining since the 1950s.


Well, yes. But the question is: why?
Clouds effect the temperature in the arctic, it depends how much clouds form…
http://earthobservatory.nasa.gov/Features/ArcticReflector/arctic_reflector4.php
Looks like science is settled on the other side of the earth though
http://geology.gsapubs.org/content/38/7/635.abstract
“Moreover, the data indicate that present reduced ice extent on the western Antarctic Peninsula is not unprecedented and is similar to that experienced during at least three periods in the last 5600 yr. “
This study supports that Arctic ice has been increasing over the last 1000 years:
http://wattsupwiththat.com/2010/09/23/surprise-peer-reviewed-study-says-current-arctic-sea-ice-is-more-extensive-than-most-of-the-past-9000-years/
I’m still waiting for evidence that what’s currently happening in Arctic ice has not happened before.
What’s happening at the arctic now has happened before.
But if we wait another 400 million years the warmists will get it right.
That’s when our sun is going to expand and scorch our planet.
Every penny we spend on our climate and alternative energy is a waste of money.
If you want to hear more about the core of the climate fraud watch these video’s with Dr. Timothy Ball:
http://australianconservative.com/2010/10/michael-coren-with-dr-tim-ball/
If we’re into using anecdotal data for determining ice extent; what would the Arctic ice extent be interpreted as for the picture of the three nuclear subs surfacing at the north pole surrounded by water during the 50’s?
For me, the story is in the temperature record of the offset Greenland sites.