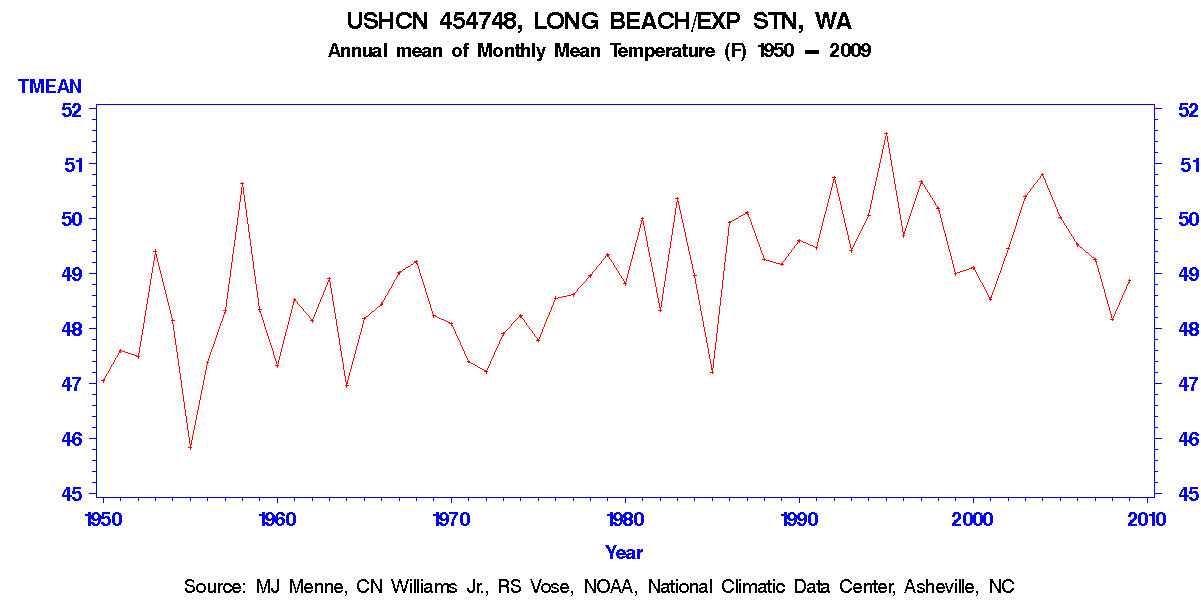
From the looks of the USHCN graph above, you would think that temperatures at Long Beach, Washington were getting a lot warmer. More than a degree warmer since 1950.
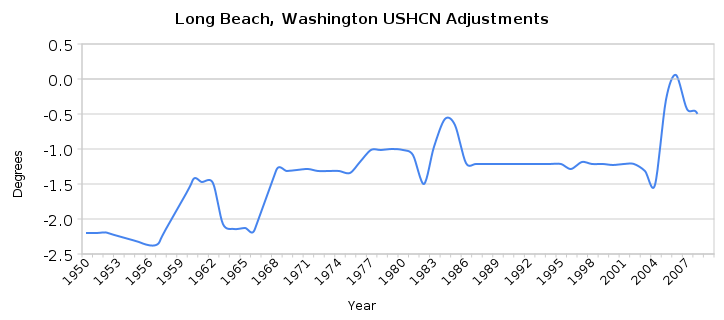
Whether or not the temperatures are getting warmer, one thing for sure, the trend we see is due to adjustments. The plot below shows USHCN final temperatures minus measured temperatures.
In the 1950s, they subtracted about 2.2 degrees from the thermometer readings. Starting in the late 1960s, they subtracted 1.2 degrees from the thermometers, and in recent years they have subtracted between 0 and 0.5 degrees from the thermometer readings.
By making the past progressively cooler, they have made the present appear to be getting warmer.
Here is their explanation for why they do it.
Here is the spreadsheet with my calculations.


So which adjustment did they make that you disagree with and why? (apart from the fact it doesn’t go the direction you want it to).
No point getting all mad about an adjustment if there is a legitimate reason for it.
I’m just pointing things out. Are you getting mad?
Brendon just wants to save us all from certain doom. He knows, as only a true believer can, that we will suffer not a Biblical apocalypse, but a man-made one. We will bake, sizzle and drown because we refused to pay carbon tax.
Poor Brendon… Things are not breaking his way, lately.
On the other hand, yay us!!
No I’m not mad, I’m saying what’s the point in highlighting an adjustment unless there’s something specifically wrong about it.
If they have a justifiable reason for it – so be it.
You seem never to go out of your way to show adjustments like this.
http://tamino.wordpress.com/2010/10/13/the-great-conspiracy-to-destroy-freedom-sabotage-the-usa-increase-taxes-undermine-the-economy-institute-world-government-based-on-socialism-with-al-gore-as-dictator-and-of-course-drive-us-all/
No point getting all mad about an adjustment if there is a legitimate reason for it.
Explain the reason.
You have this backwards. It’s Steve who should be able to explain his post. Someone who makes a claim should be prepared to defend it.
All he’s really said here is, “Long Beach has been adjusted.”
So? There are reasons, and NASA provides them in some detail. If Steve has some specific reason why the adjustments were invalid, he should be able to explain them. Otherwise the post is pointless.
Brendon says:
October 17, 2010 at 1:34 pm
So which adjustment did they make that you disagree with and why? (apart from the fact it doesn’t go the direction you want it to).
The adjustment goes in the way of producing warming. That’s what you like.
Brendon,
what do you think of the UHI adjustment that WARMS the alledgedly Urban stations that are used to compare the Urban station against??
Brendon,
what do you think of using a station over 50 miles, and in many cases over a hundred miles, from a station to infill data??
Brendon,
what do you think of doing a study on a couple of stations and determining an appropriate method of adjusting for issues then applying that CUSTOM adjustment process to ALL stations? Did you check to see whether the stations used to determine thos CUSTOM adjustments were higher or lower temp or trend than average??
I do not see how to reconcile the roughly 2 degrees C, or about 3 degrees F, cumulative adjustment shown in the graph with the 0.5 degree F cumulative adjustment total since the 1940s claimed in the actual text.
Could someone please help?
Here is the spreadsheet with my calculations.
https://spreadsheets.google.com/pub?key=0AnKz9p_7fMvBdGc4bU8zSzlFMzczUXR3SVFRRVIxaWc&output=html
Here is the USHCN data.
http://cdiac.esd.ornl.gov/sasserv/WA454748_9805.csv
Hmm, I’m not sure you’re viewing this correctly. He’s not claiming 0.5 total adjustment, but the 0.5 is the more recent adjustment they’re using.
The average adjustment made since 1950 is -1.195689655, but the larger adjustments were made closer to 1950(2.2)….. the most recent adjustments were less. The result is to make the past look warmer, when in fact they’ve no proof that it was.
Should read “making the past look cooler.”…….
The very first item they list for adjustments…..”A quality control procedure is performed that uses trimmed means and standard deviations in comparison with surrounding stations to identify suspects (> 3.5 standard deviations away from the mean) and outliers (> 5.0 standard deviations). Until recently these suspects and outliers were hand-verified with the original records. However, with the development at the NCDC of more sophisticated QC procedures this has been found to be unnecessary. ”
Nice, what they’re saying, is they’re adjusting without even to bother to look at the records. They’ve simply produced an algorithm to auto-adjust.
This is probably why we’ve seen this all-too-familiar pattern in their temp manipulations.
In other words, the entire trend is an artifact of the adjustments. If these adjustments were warranted, you would think that charts of all time highs for the same location would bear them out. I doubt this would occur.
Thank you for the backup data summary.
The USHCN paper is actually quite dishonest. The final sentence of the USHCN document is:
The cumulative effect of all adjustments is approximately a one-half degree Fahrenheit warming in the annual time series over a 50-year period from the 1940’s until the last decade of the century.
This is untrue. The half degree warming is for the most recent record, prior years are adjusted much more, several times as much in the 1950s. In the financial industry that I worked in, such phrasemaking would have been red penciled by our lawyers as actionably misleading.
At a minimum, the cumulative effect should be the annual average of the adjustments, which looks to be about 1.5 degrees F.
My head hurts. I just reread the warmist explanatins for making their “adjustments”. Has anyone else noticed they keep adding excuses? And for God’s sake, are we really supposed to believe that different kinds of scientific quality thermometers give different readings?
Got to find some aspirin.
That’s another good one. Extrapolate backwards as the good climate modellers do and we get glaciers around about 800 AD (I’m charitably thinking the scale is in F, as C would mean Columbus missed an iceberg by this much).
Next year in congress I want Rep. Barton’s climate hearings to review the retroactive effects of anthropogenic CO2 on past climate records.
When you have this many adjustments it leaves plenty of chance to steer the data the way you want to. If the original data is that suspect then it shouldn’t be used at all.
Why is the UHI effect only 0.1°C for the last 50 years, while urban centers grew the fastest, and yet to compensate for the fact the older records were downtown they cool it by even more.
Figures Lie, and liars figure.
Figures DON’T lie, BUT, LIARS FIGURE!!!
In other words the math is correct. The assumptions behind the math is where the lying happens.
Why the varied adjustment? Using the same equipment in one place will produce the same errors. A collection of that equipment will have varying errors which is why each one should be calibrated against a known, and agreed, standard. Positional errors should remain fairly constant so final data sets should be accurate and no such large adjustments will be necessary.
Why the varied adjustment? Using the same equipment in one place will produce the same errors
By far the most common reason for changes in the adjustment is changes in the environment around the station. It doesn’t have to do with the equipment, except when the equipment itself changes.
its strange….
With the money being spent on climate “research” none seems to be spent on providing accurate thermometers in reliable locations. I am not a scientist but usually if one is reliant on real data to prove or disprove an assumption then the mechanism for gathering that data should be above reproach. Here we are at least twenty years down the track and instead of having stand alone temperature records we have adjustments. One gets the impression that if the temp record was garnered from properly sited thermometers it would not show significant warming. The warming is indeed man made.
With the money being spent on climate “research” none seems to be spent on providing accurate thermometers in reliable locations.
Untrue. One of the adjustments was for the bias that was introduced when older liquid-in-glass thermometers were replaced by newer, more accurate electronic ones.
And, incidentally, the bias was upward. In other words, the new thermometers were found to be reporting a higher temperature, so the effect of the adjustment is opposite what you assume.
The fact that the temperatures are adjusted is meaningless by itself. Most scientific data are adjusted for one reason or another. You have to show that the adjustments are invalid. No one here has bothered to even try. Did you carefully read the USHCN’s explanation of what adjustments are made, and why? What do you find wrong with the explanations, specifically? Which of the adjustments are unjustified?