
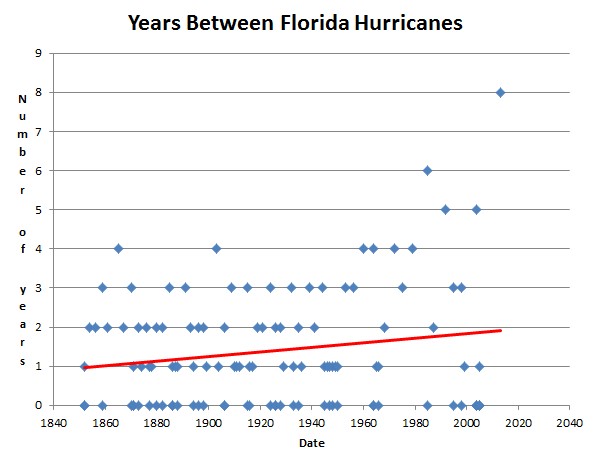
NOAA records going back to the 1850s show that Florida used to average about one hurricane per year. Now they average one every other year. It has been eight years since Florida was hit by any hurricane, their longest hurricane-free period on record.

Obviously, the historical decline in Florida hurricane strikes is attributable to global warming. If warm temperatures cause both a decline and an increase in snow, then why can’t AGW be responsible for both an increase and a decrease in hurricane activity?
The profession of climatology could be more accurately described as “climastrology.” Instead of using advanced General Circulation Models to predict the world’s climate 100 years from now, why don’t the Climate Change Prophets use Tarot Cards? It would be a lot less expensive and probably just as accurate.
Hansen, Trenberth, Mann, Schmidt, Jones, MicKibben and the other AGW ringleaders have become the laughing stock of science. Based on his recent over-the-top predictions, Hansen appears to be grooming himself for a straitjacket. He’s gone absolutely loopy.
Here is a great chart right from NOAA: http://www.nhc.noaa.gov/pastdec.shtml
Hurricane strikes by decade. The 40s were by far the most active, with both more, and more major hurricanes before or since, and it seems to be virtually a high point, with a gradual increase and decrease before and after. Through 2004. There’ve been a couple of recent spikes, in 05 and 10, but in general there are far fewer. Here’s the same info by year: http://www.aoml.noaa.gov/hrd/tcfaq/E11.html