
120 years ago, a hurricane destroyed Tacloban in less than half an hour, and killed more than 6,000 people. CO2 was below 300 PPM.
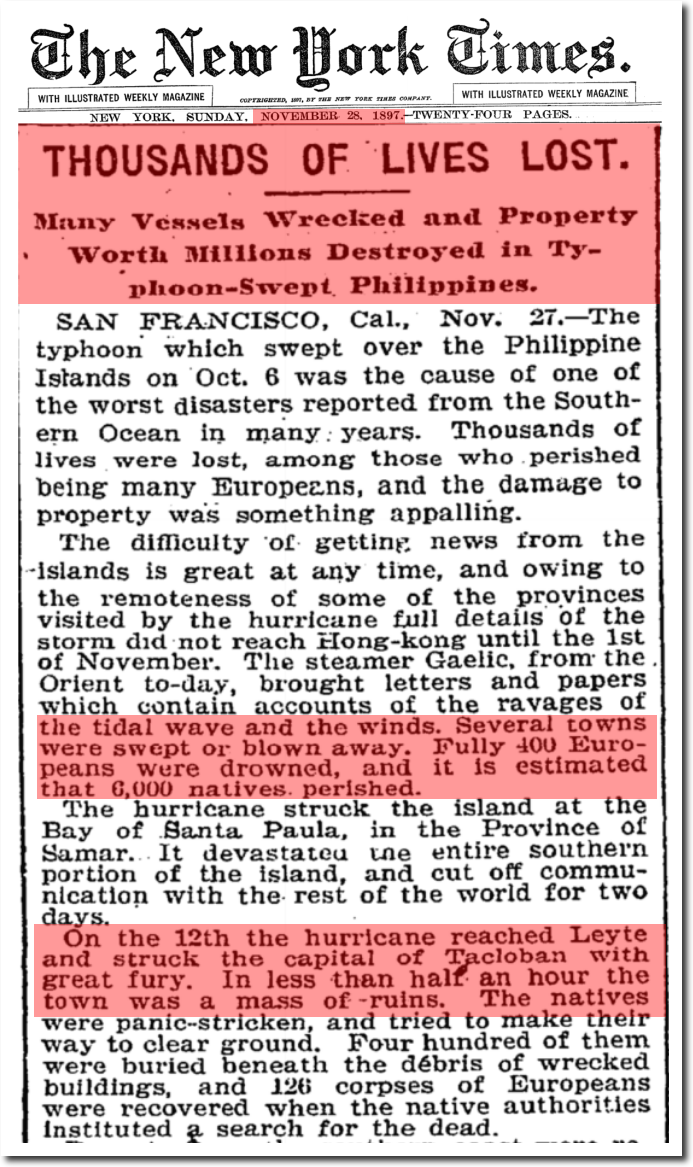
120 years ago, a hurricane destroyed Tacloban in less than half an hour, and killed more than 6,000 people. CO2 was below 300 PPM.
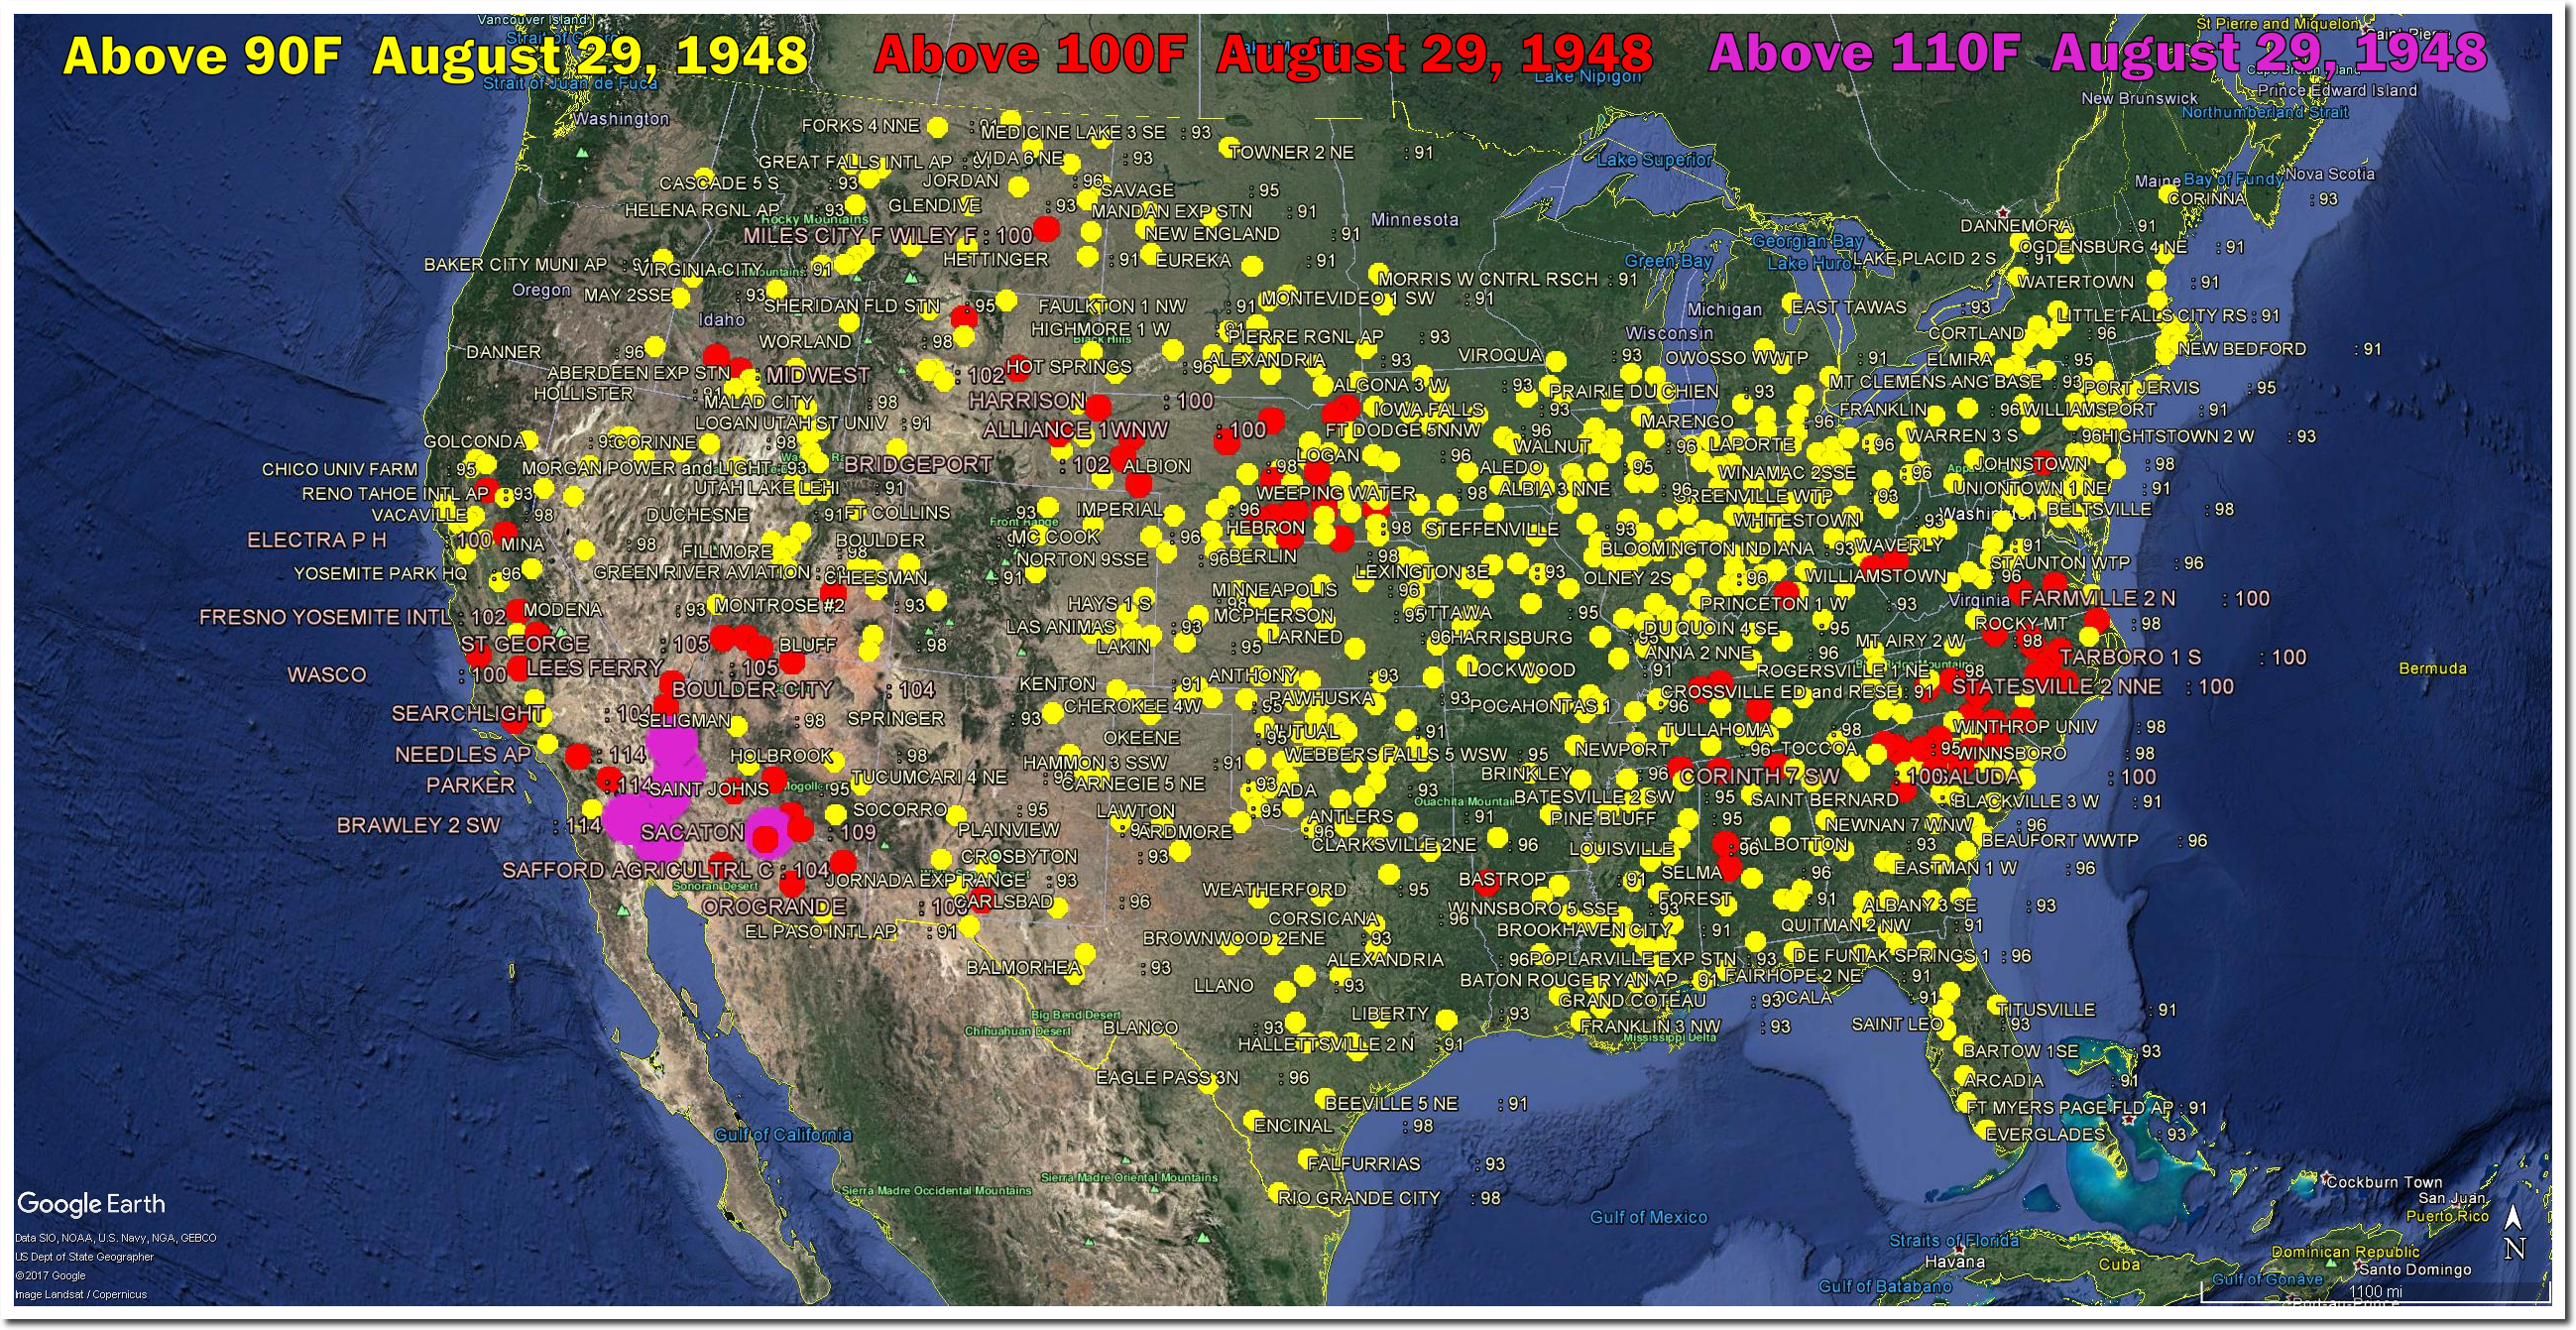
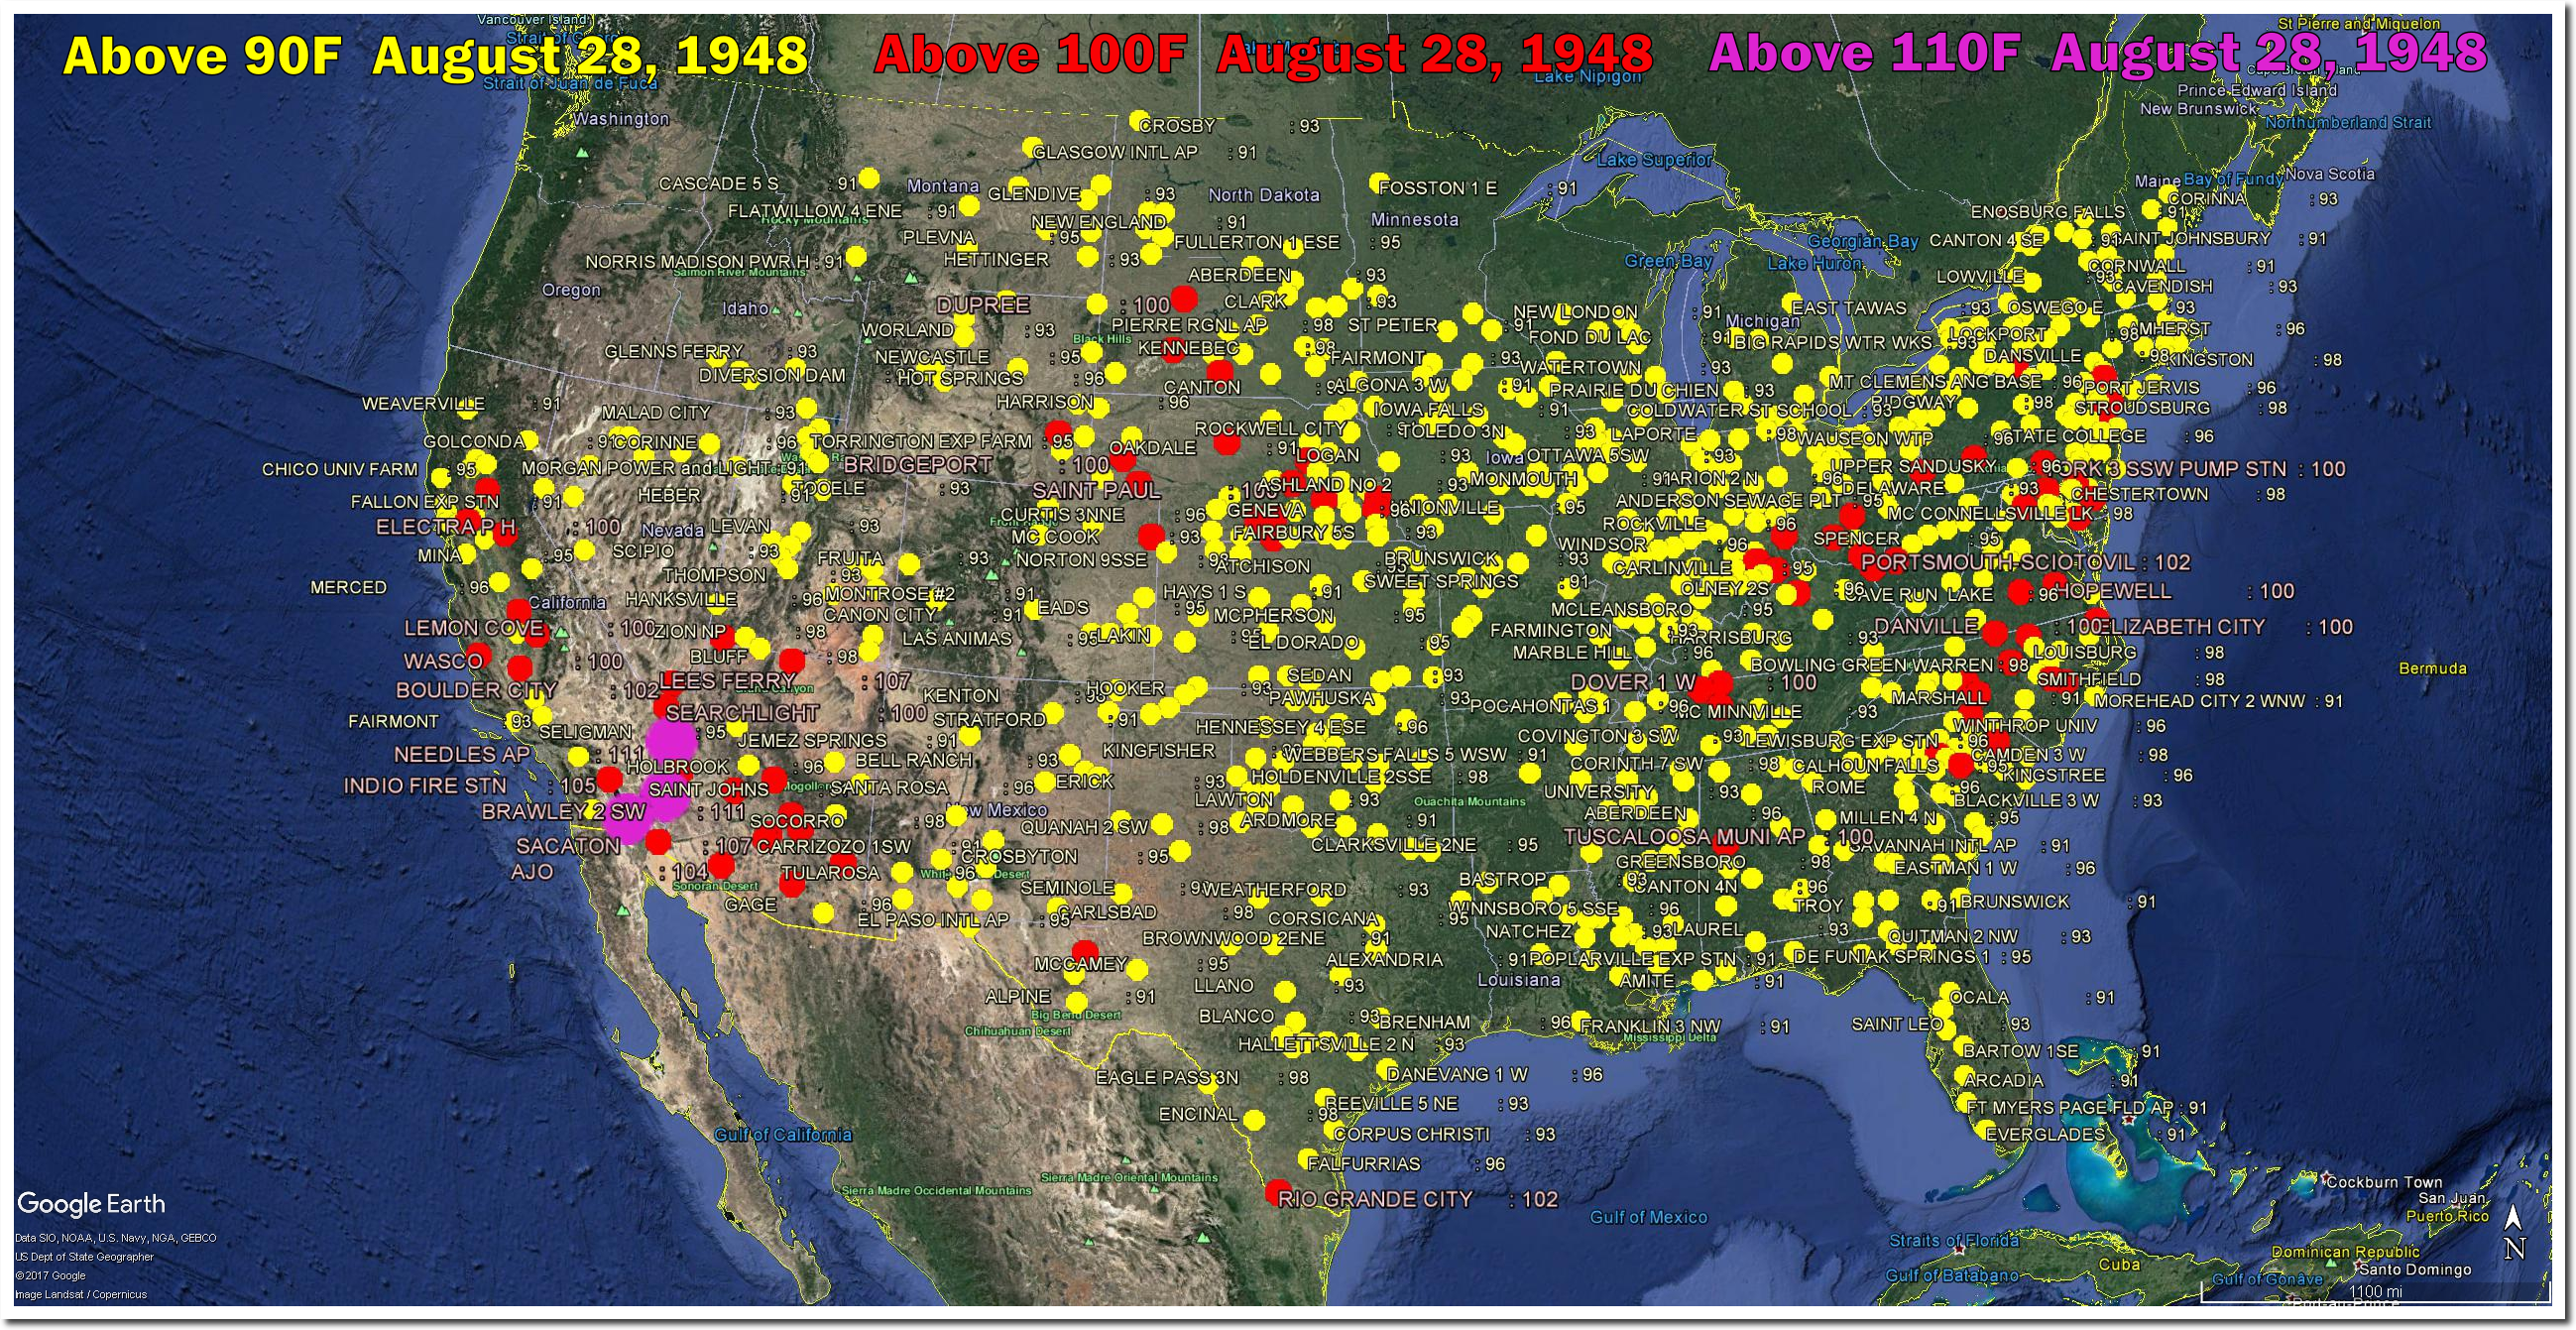
On this date in 1948, almost the entire US was over 90F, and there were 100 degree temperatures coast to coast – as far north as Pennsylvania.
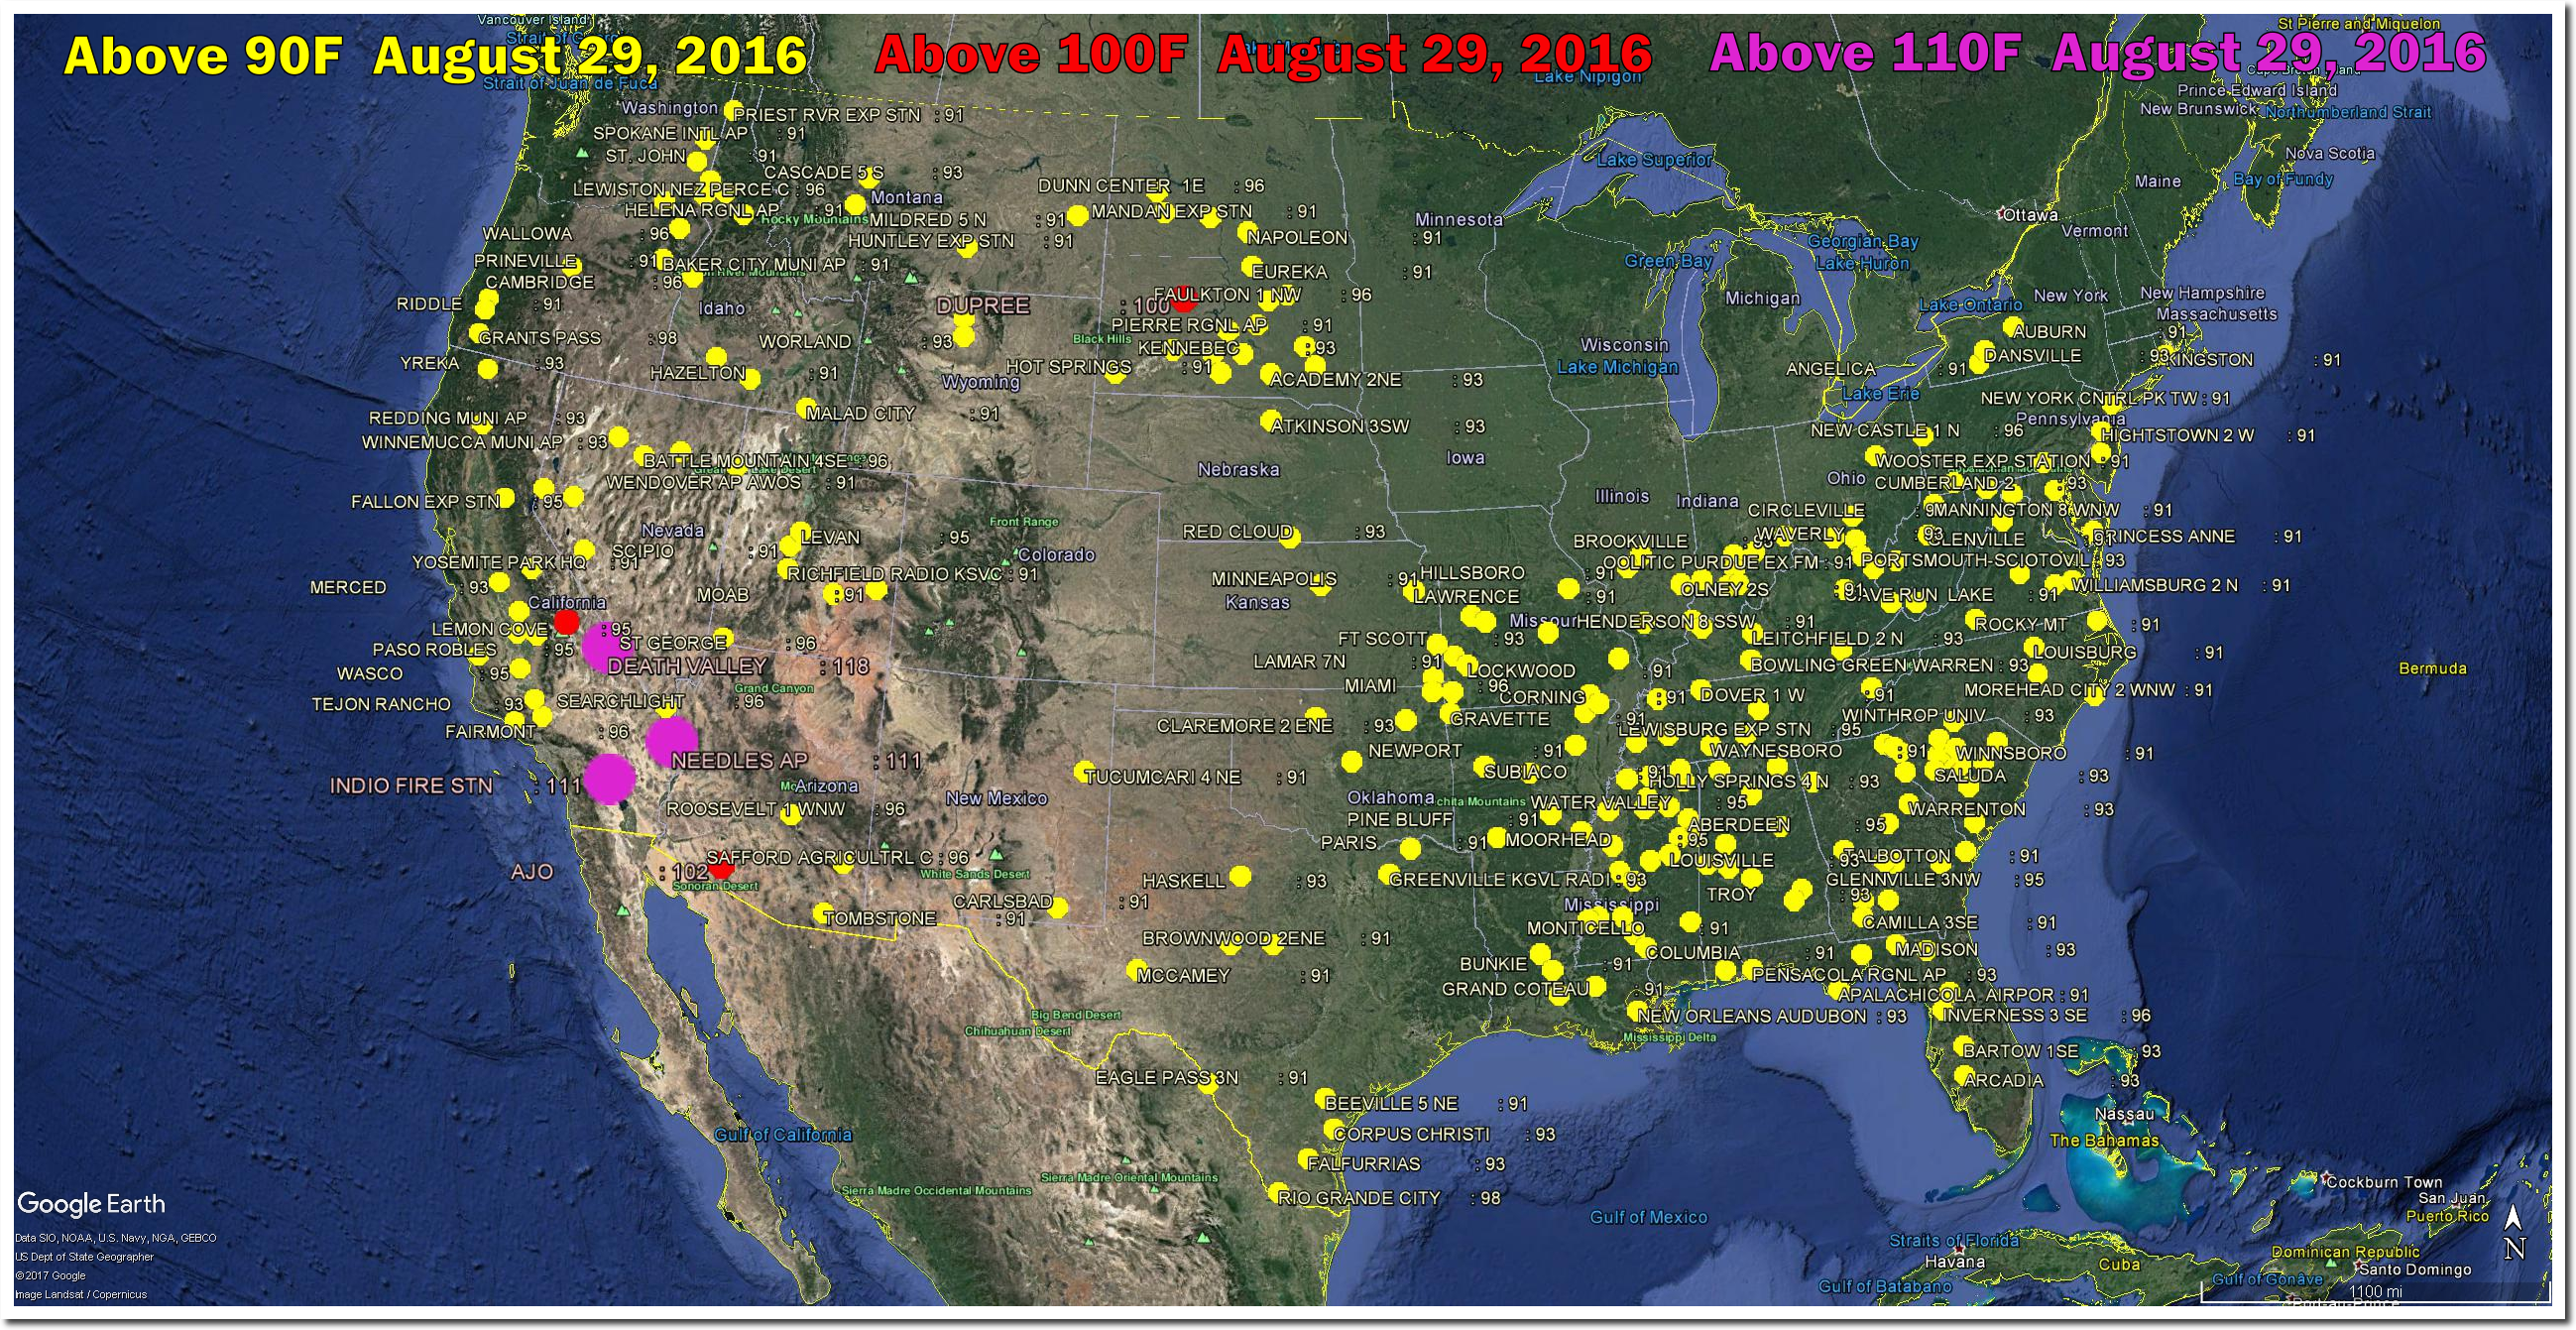
Compare vs. last year – NOAA’s official hottest year ever ™. There was very little hot weather.
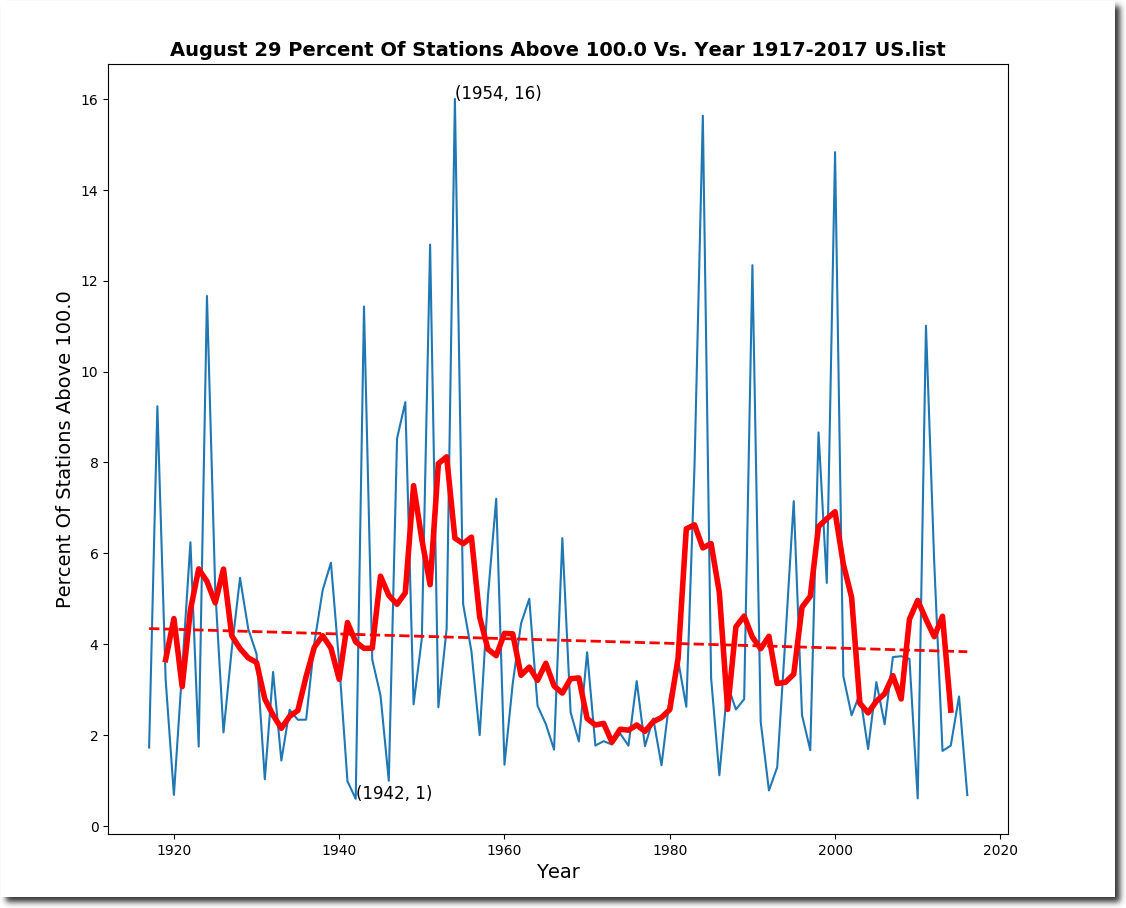
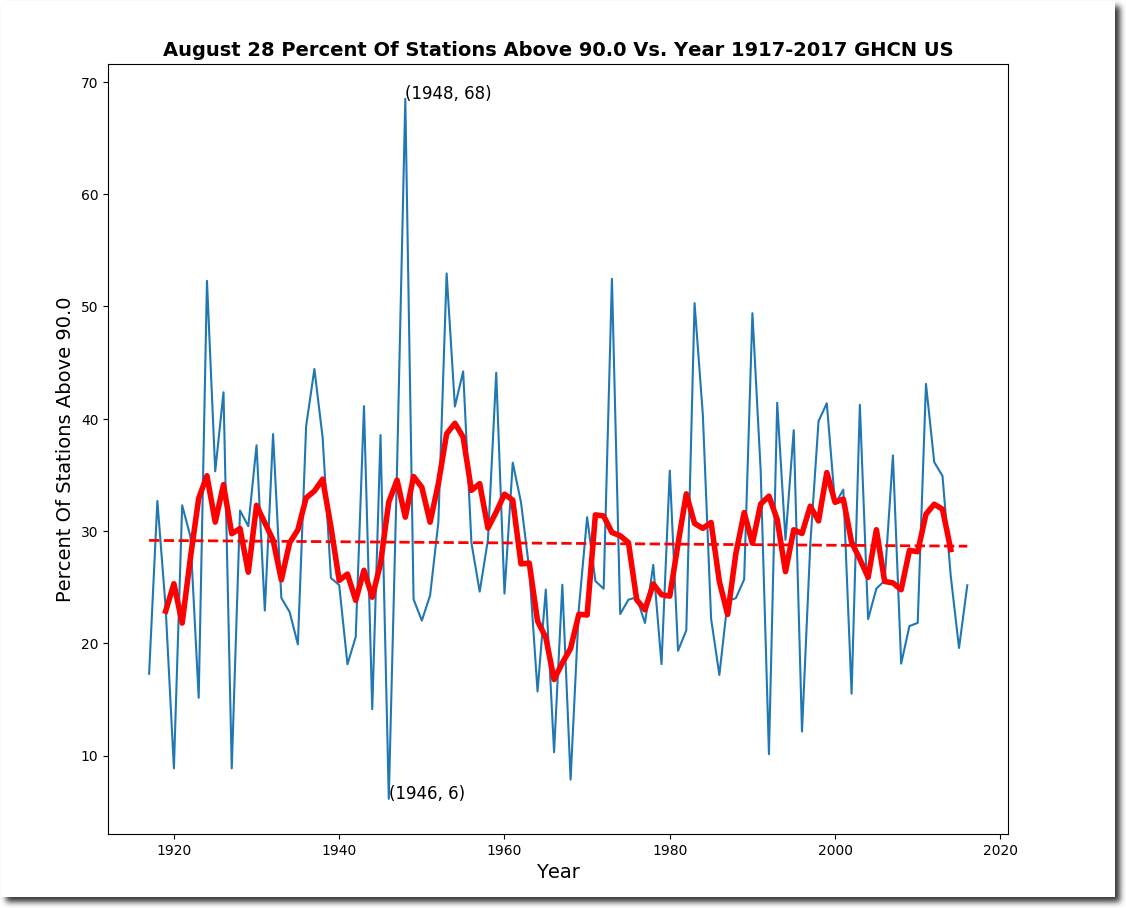
The frequency of hot afternoons in the US has been declining for a century, and is near a record low.
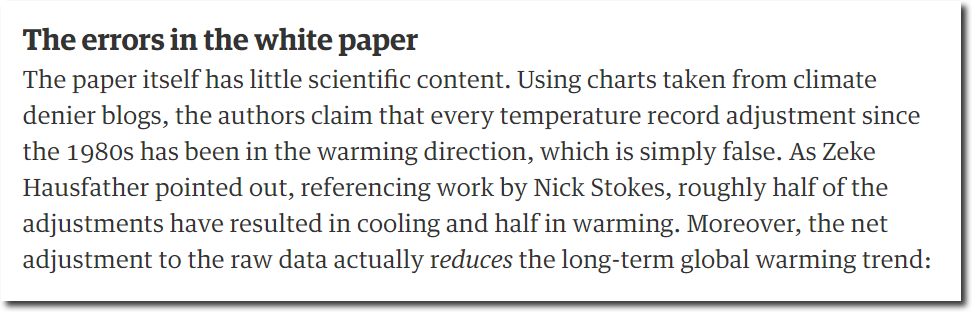
Both intended to destroy western civilization.


Early in life I had noticed that no event is ever correctly reported in a newspaper.
- George Orwell
My latest forecast is that the Arctic will be ice-free on February 26, 2018 at 5:13 PM. The polar temperature will be -32.41C.
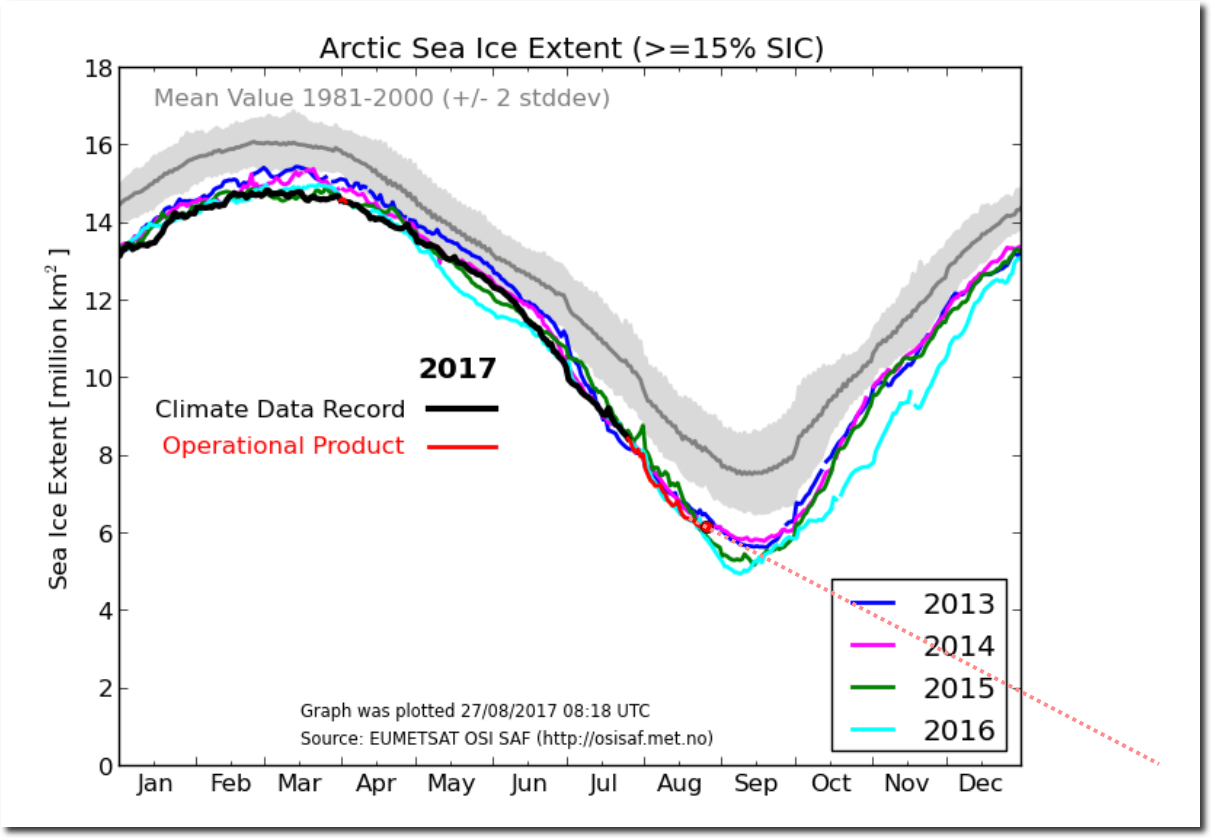
Ocean and Ice Services | Danmarks Meteorologiske Institut
Note that my forecast is consistent with those being made by our top fake scientists. fake universities, fake democracies and fake news organizations.
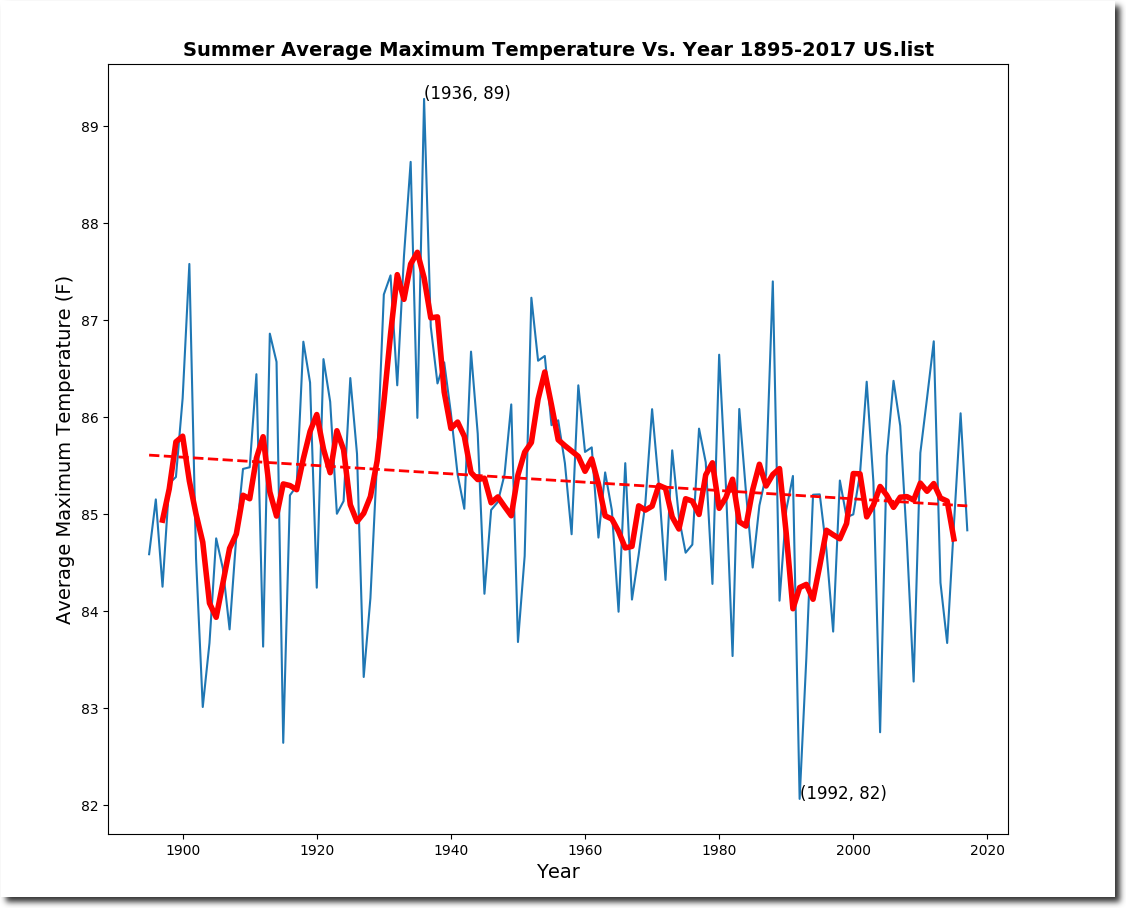
Summer isn’t quite over yet, but it was another cool summer in the US with afternoon temperatures continuing a 125 year cooling trend.
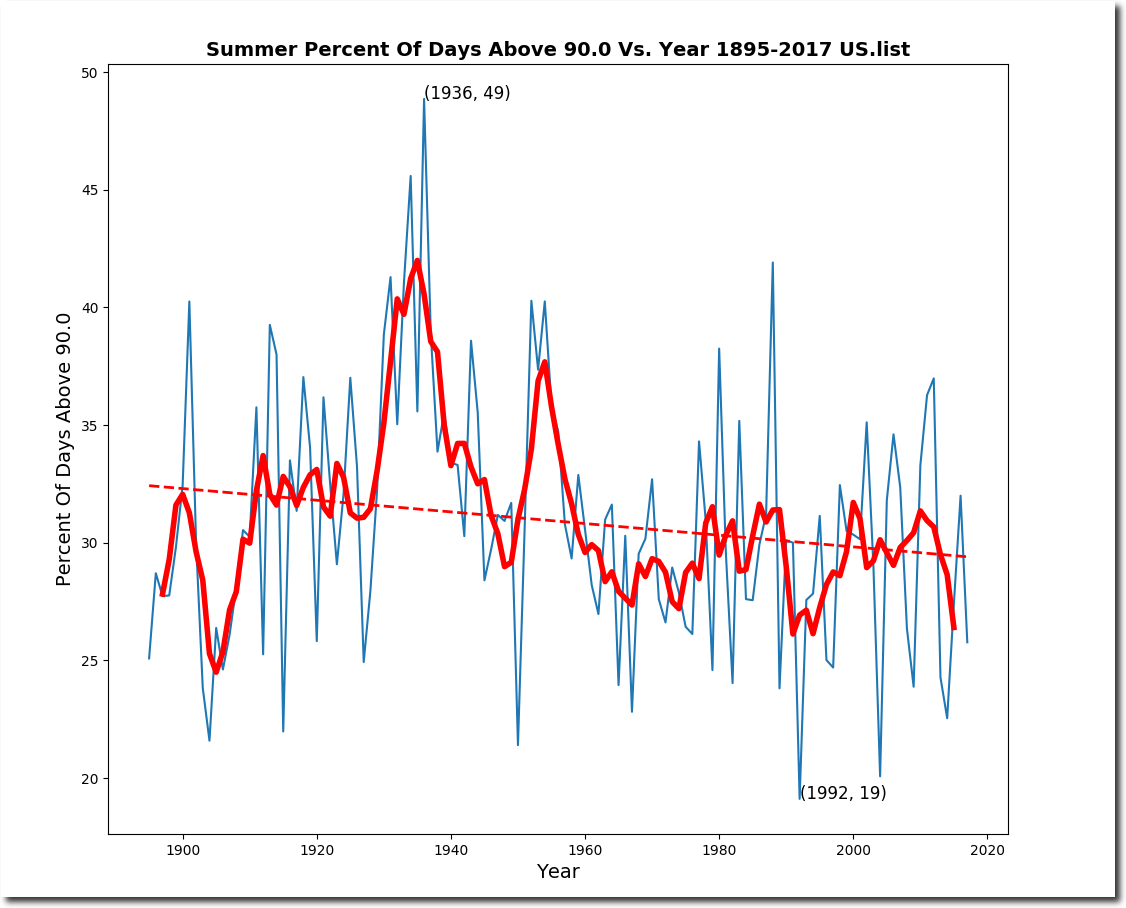
The percent of days over 90 degrees was low.
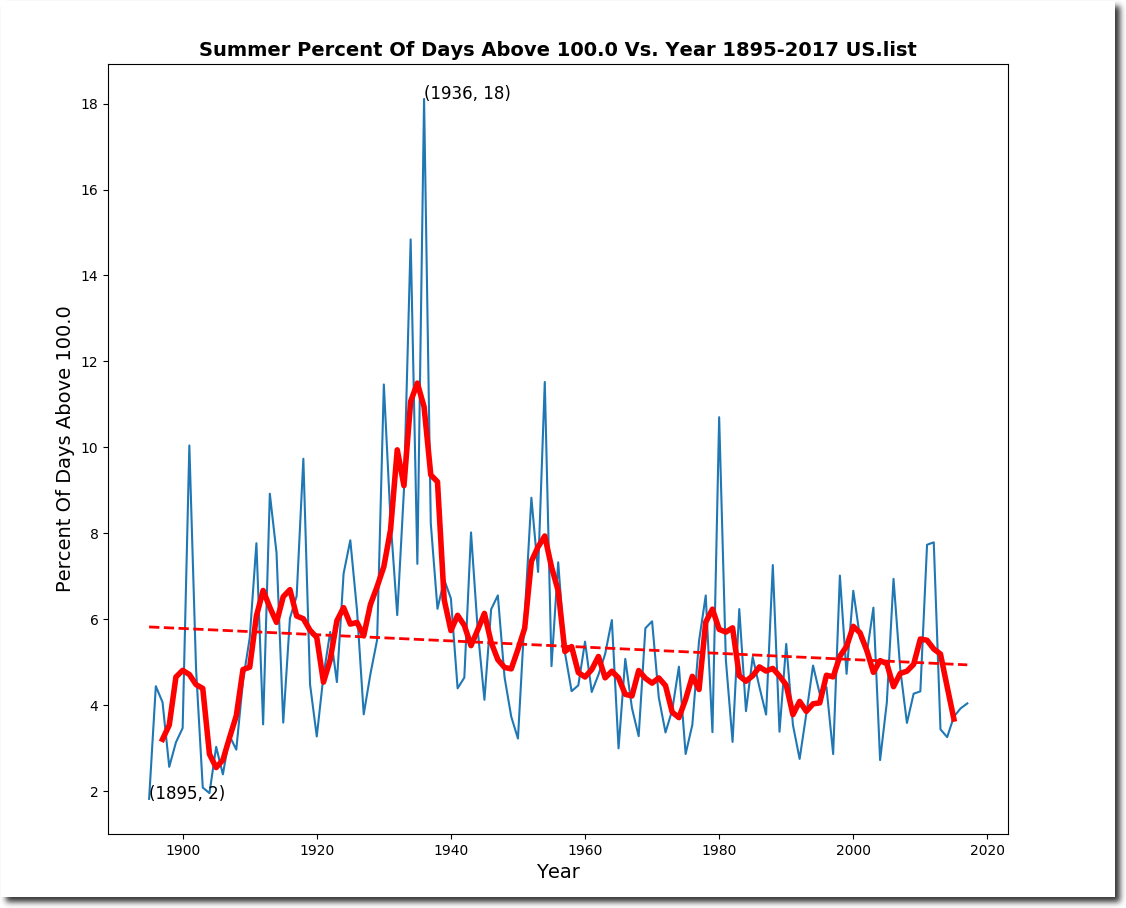
The percent of days over 100 degrees was near a record low.
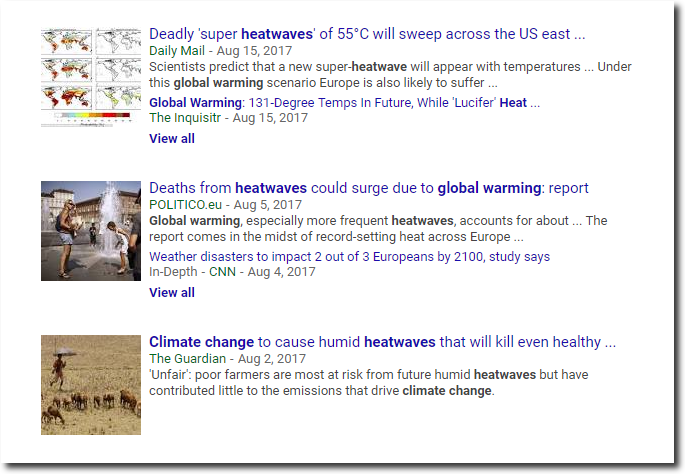
The official narrative is that summers are getting hotter and will kill us all. There is no science or data behind these claims, but facts were never part of the global warming agenda.
So NOAA massively tampers with the data to make it look like summers are getting hotter, instead of cooler.
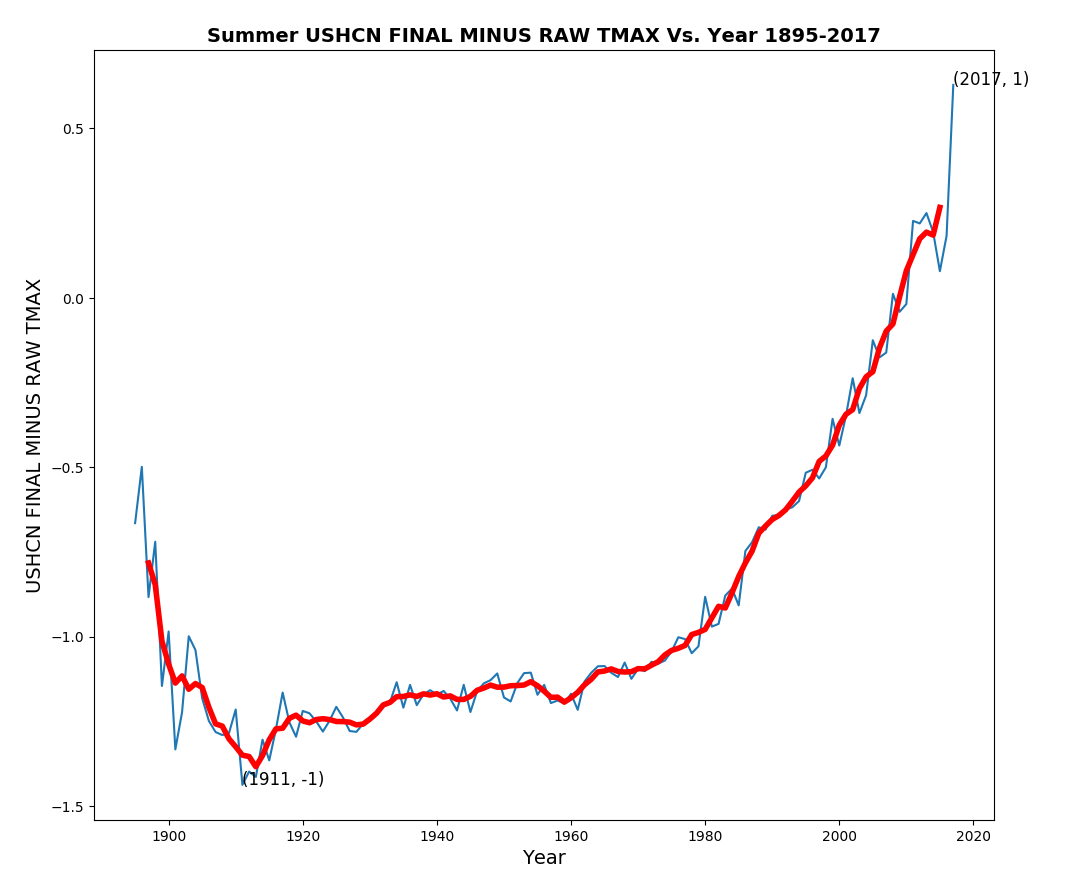
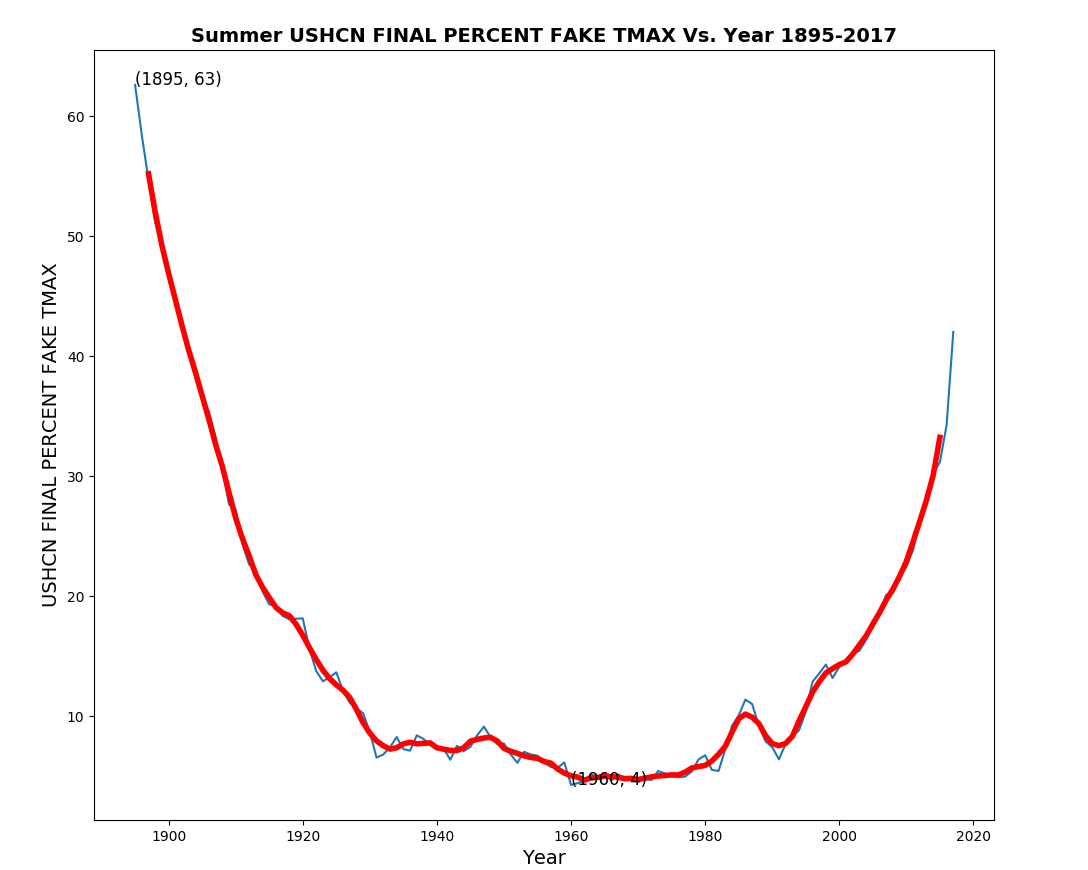
This is done through an impressive hockey stick of data tampering.
More than 40% of the NOAA US summer 2017 temperature data is fake.
Global warming is 97% fake news, but why should it be different from everything else Democrats and the left believes?
Five years ago, Katharine Hayhoe made her living blaming Texas drought on global warming. But she has taken on a new profession blaming rain in Texas on global warming.
I’m writing a formal paper to discuss the US temperature record, and am gathering figures for it.
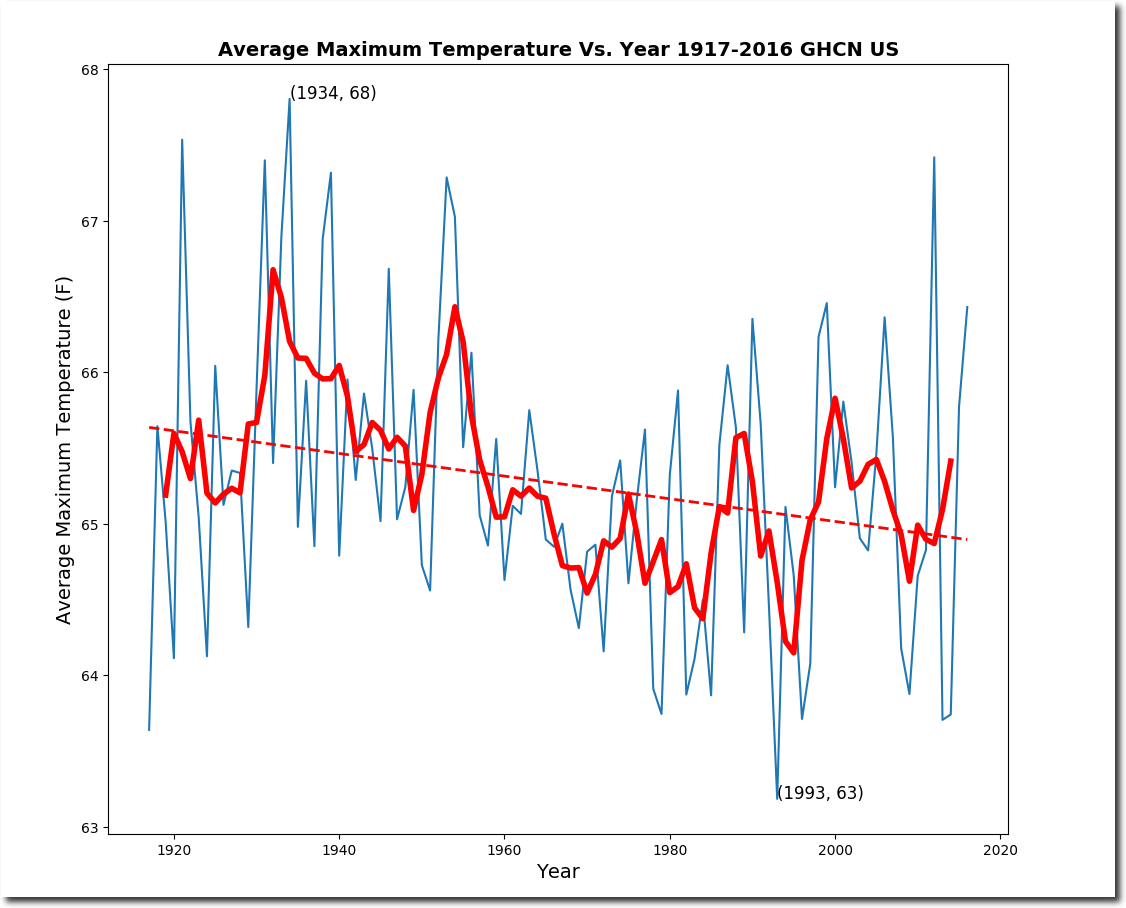
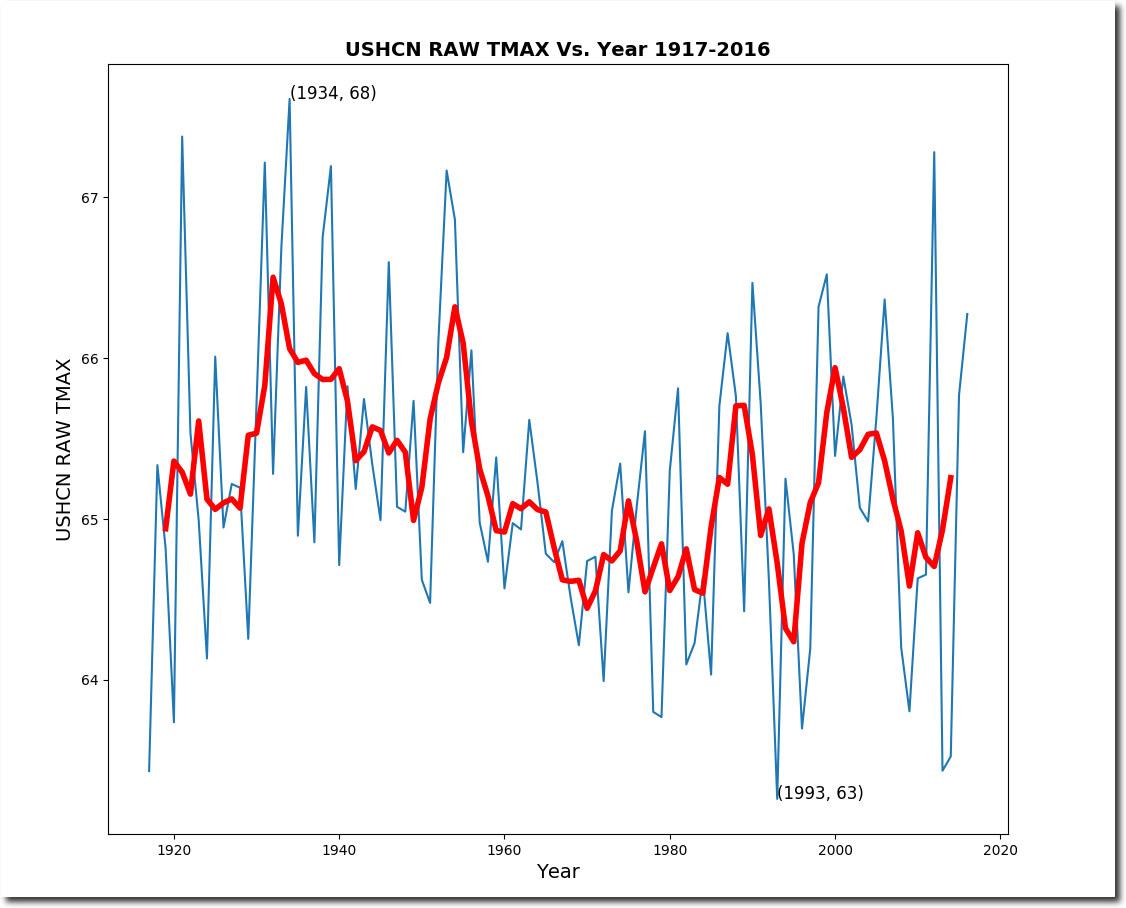
Over the past century, daily maximum temperatures have plummeted in the US. They peaked in 1934.
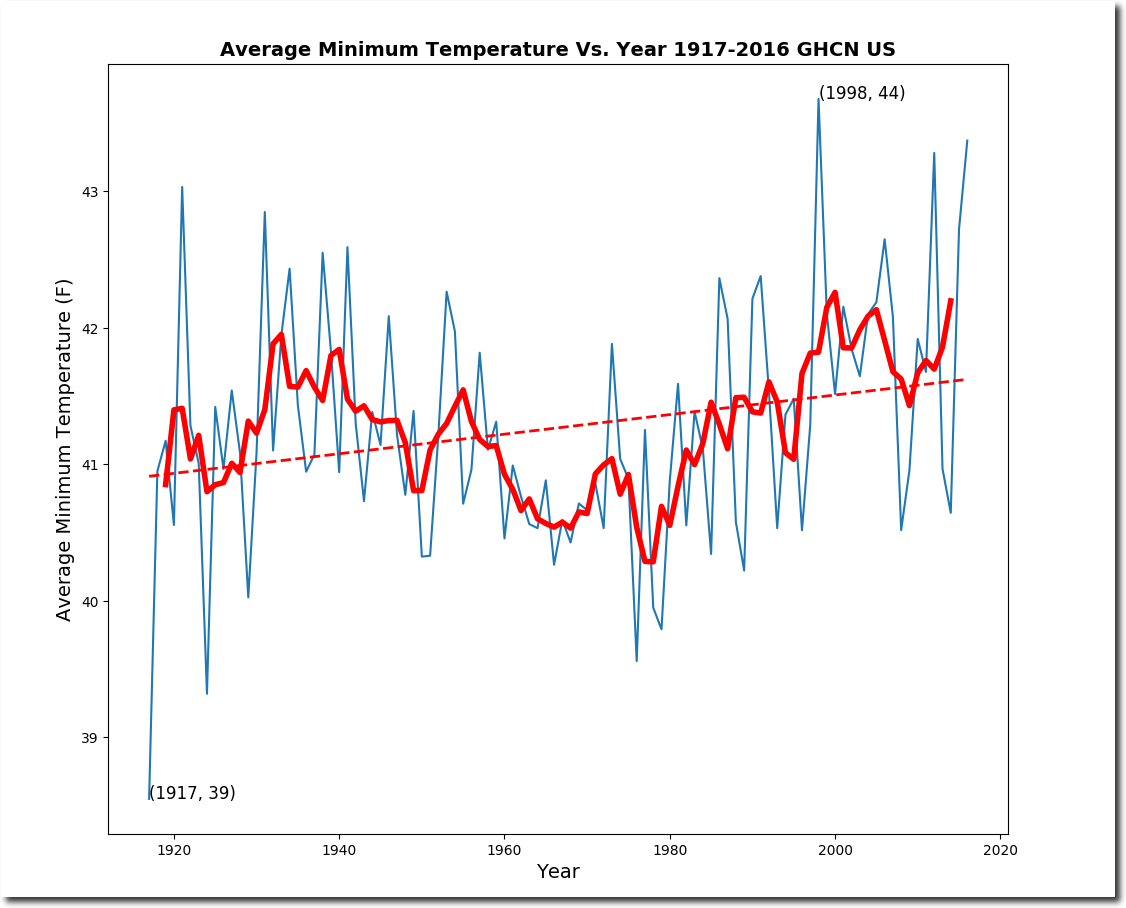
Daily minimum temperatures have increased, and peaked in 1998.
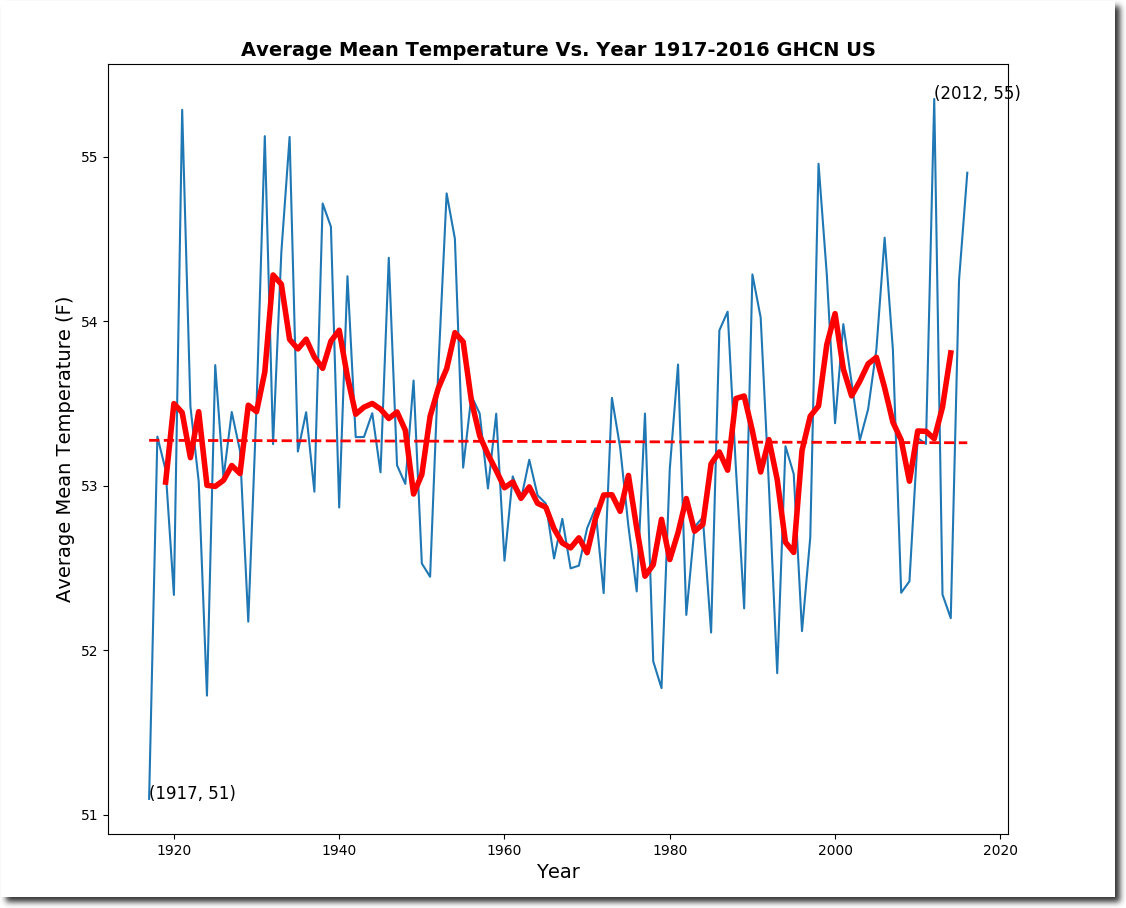
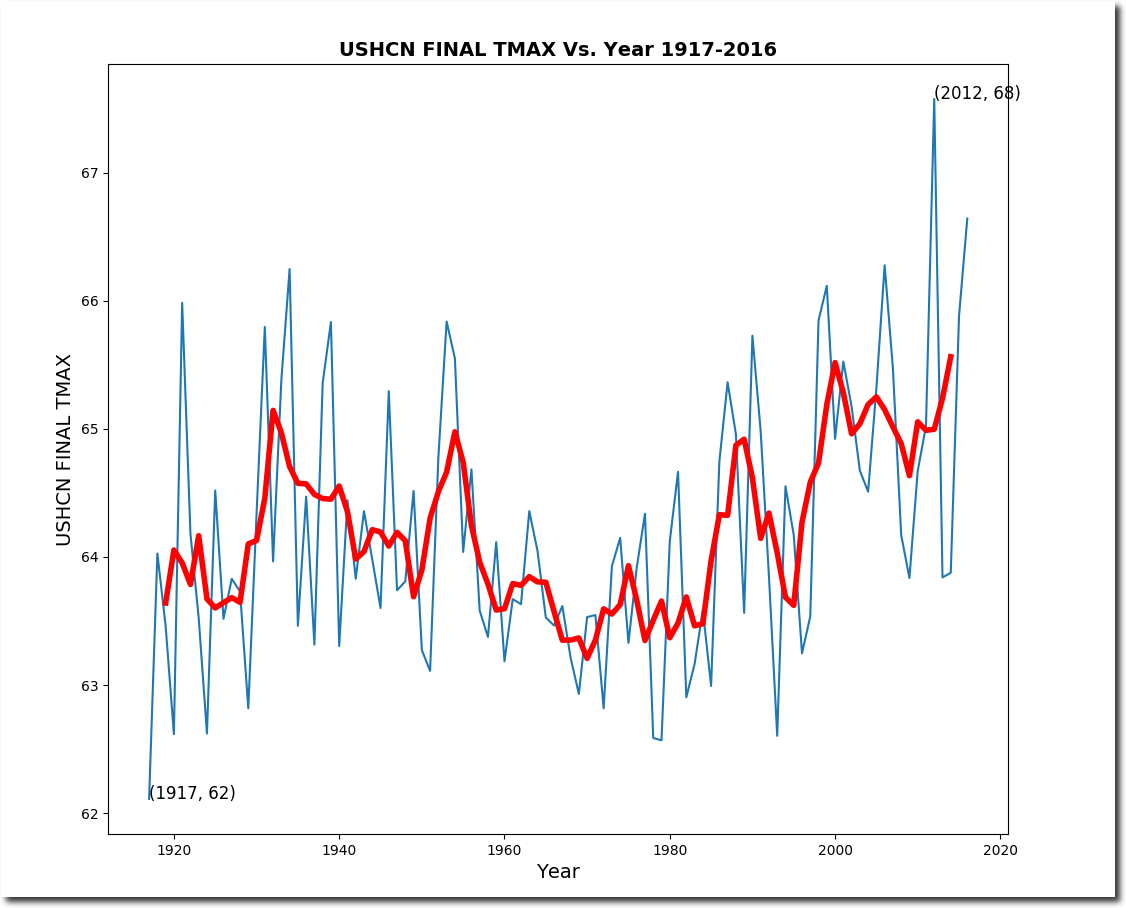
There has been no trend in mean temperatures, with 2012 being the average warmest year.
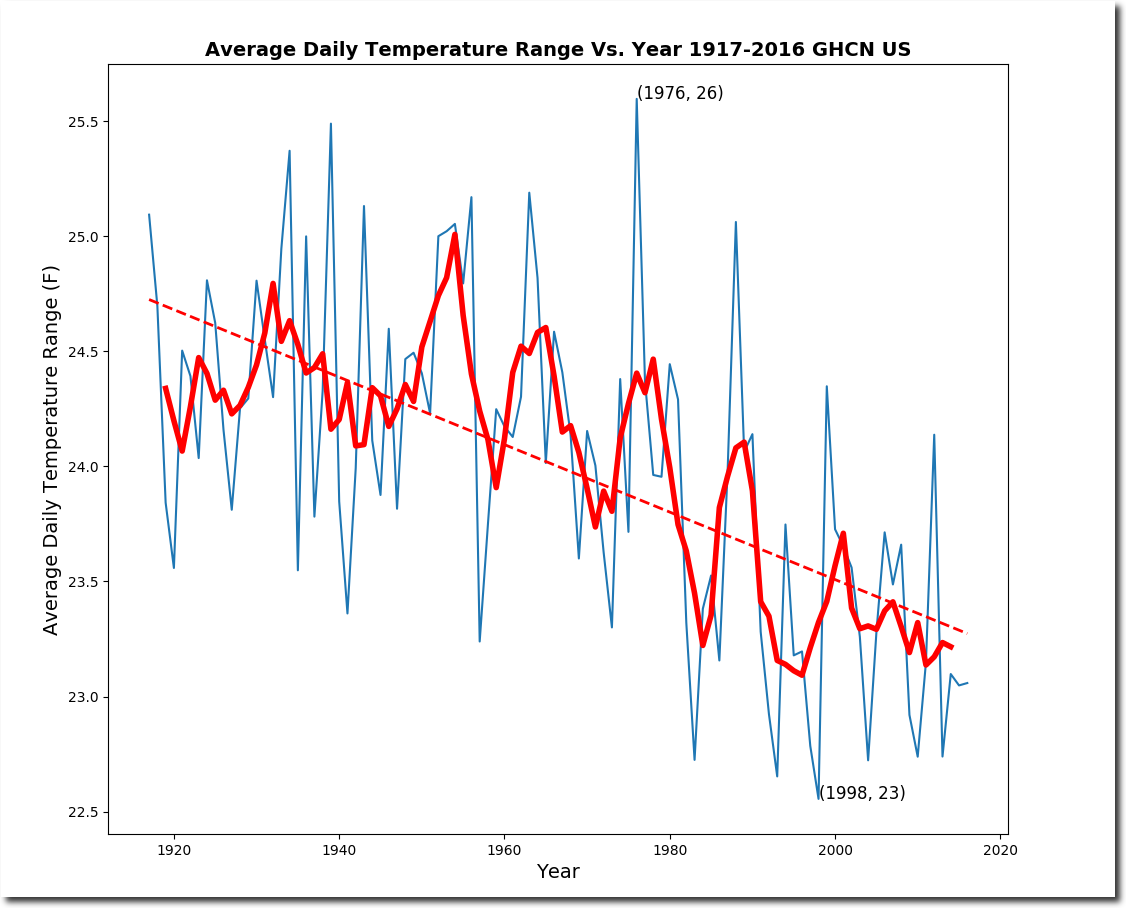
As afternoon temperatures cool and nighttime temperatures warm, the diurnal temperature range in the US has dropped sharply.
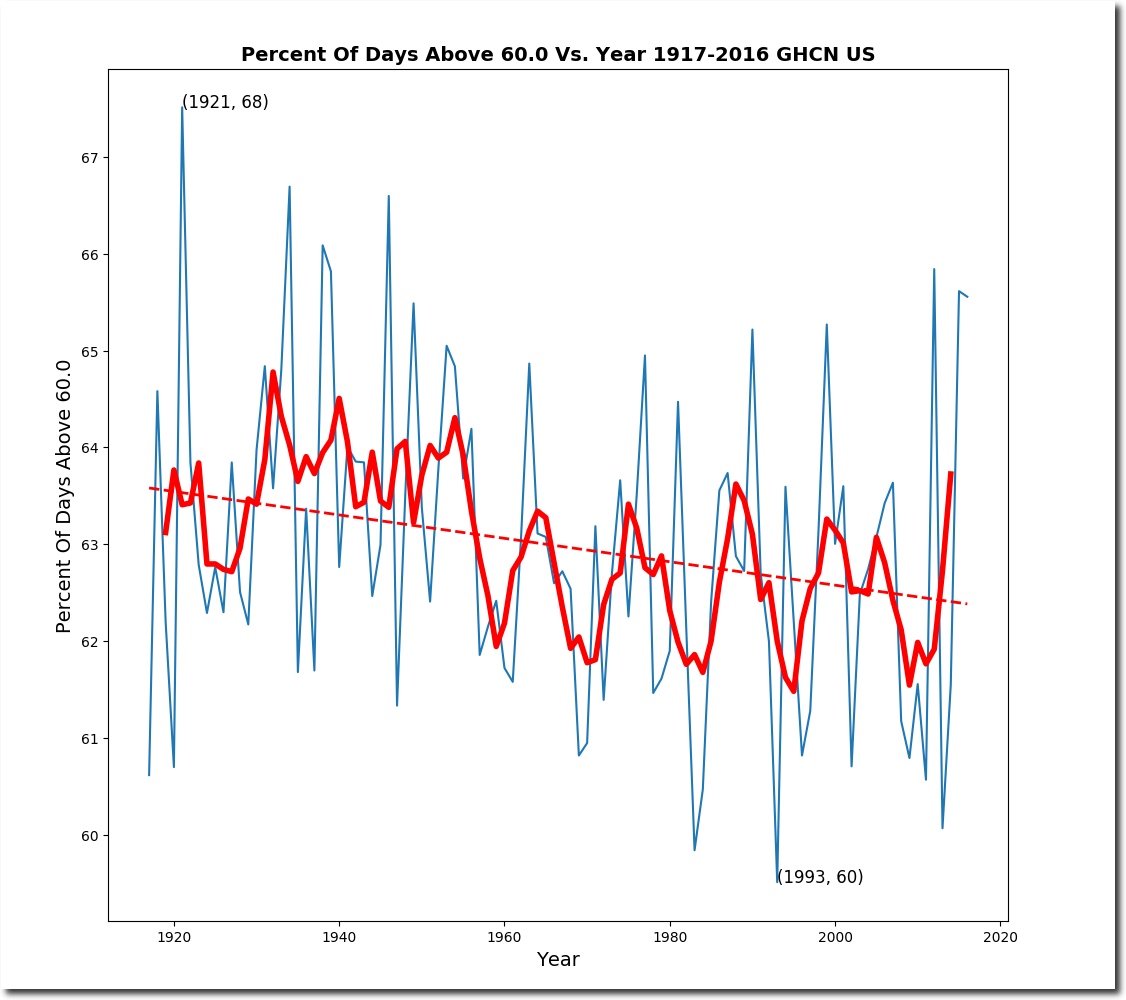
The percent of days which reached 60F each year peaked in 1921, and has dropped over the past century.
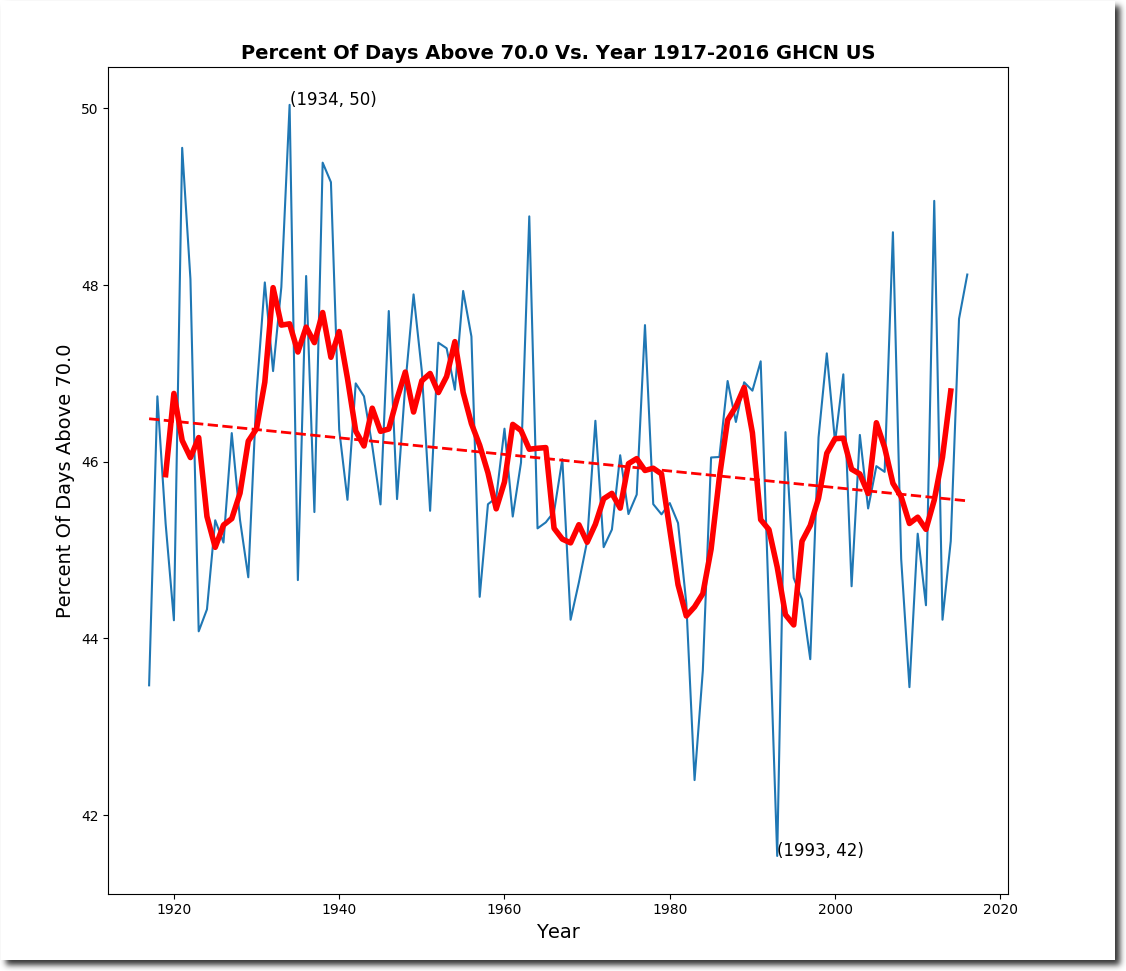
The percent of days which reached 70F each year peaked in 1934, and has dropped over the past century.
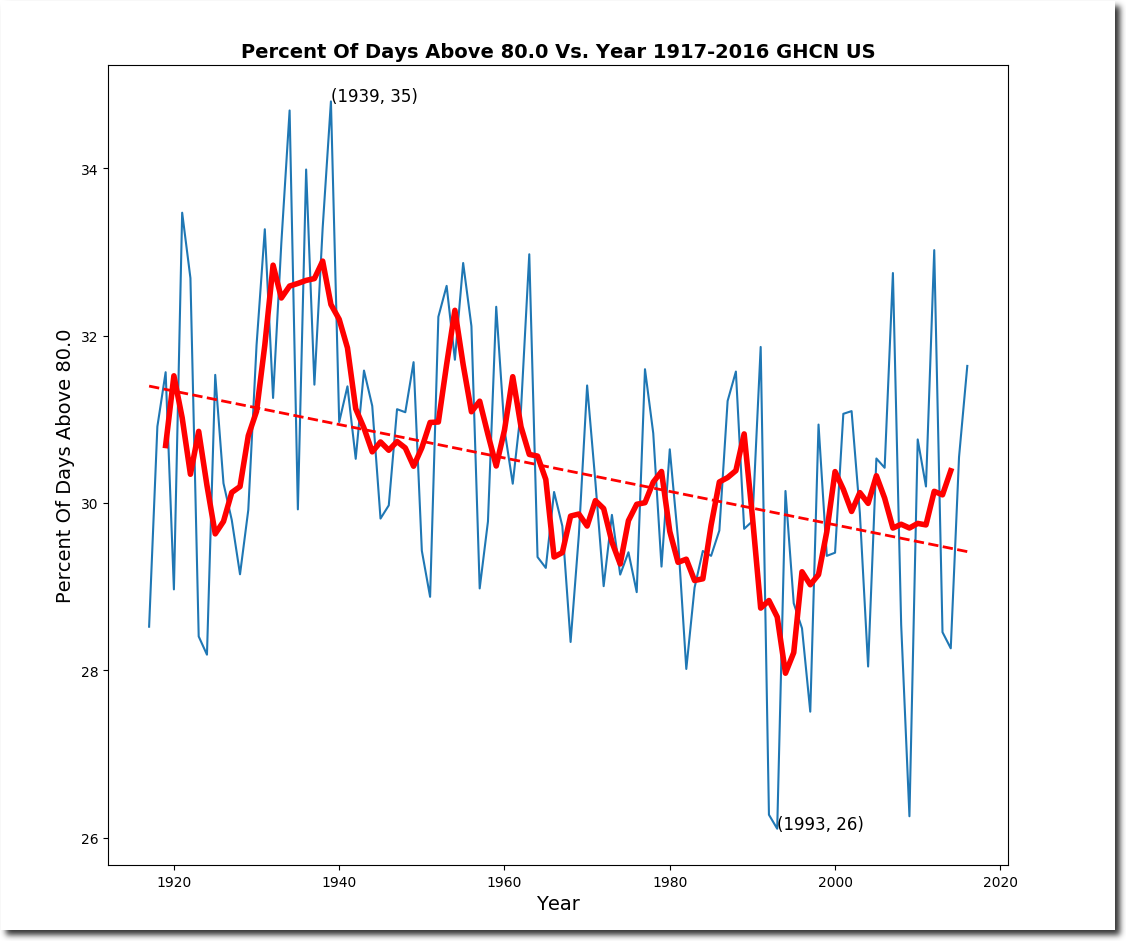
The percent of days which reached 80F each year peaked in 1939, and has dropped over the past century.
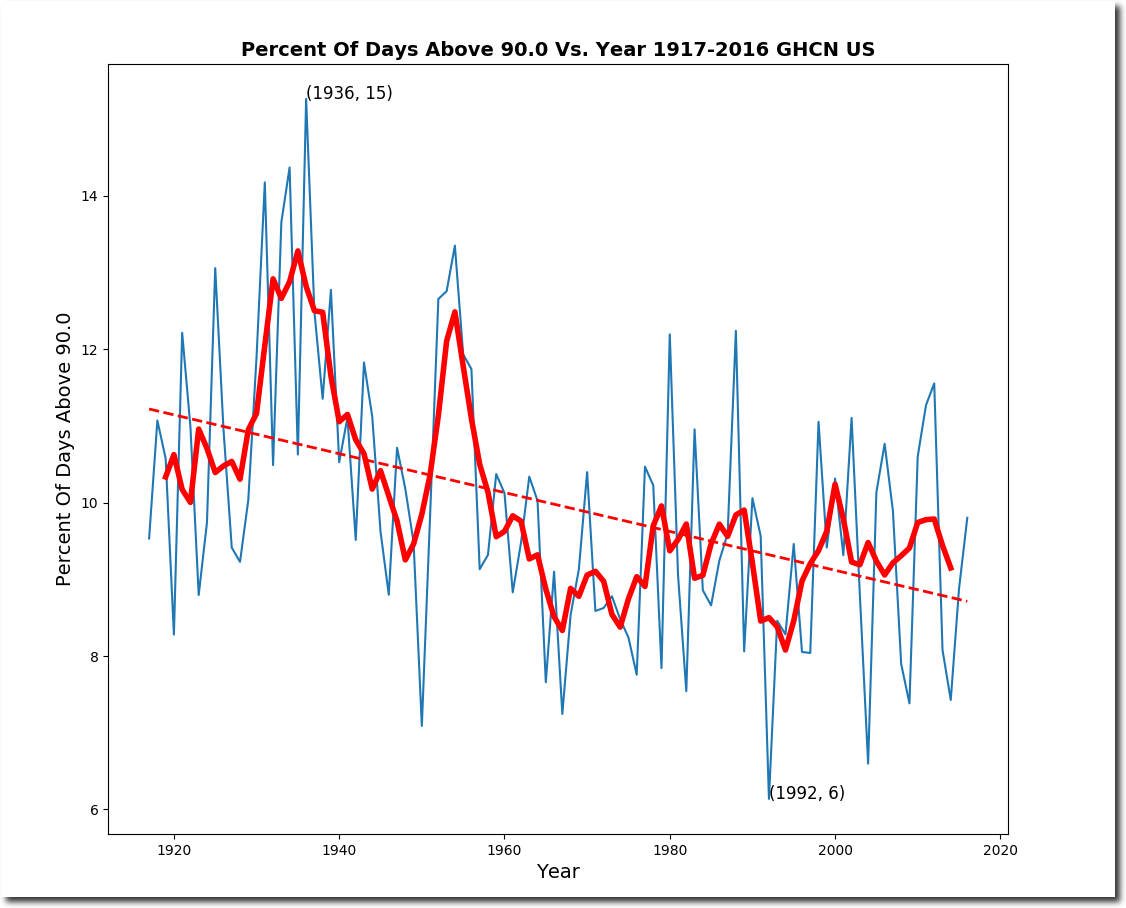
The percent of days which reached 90F each year peaked in 1936, and has dropped over the past century.
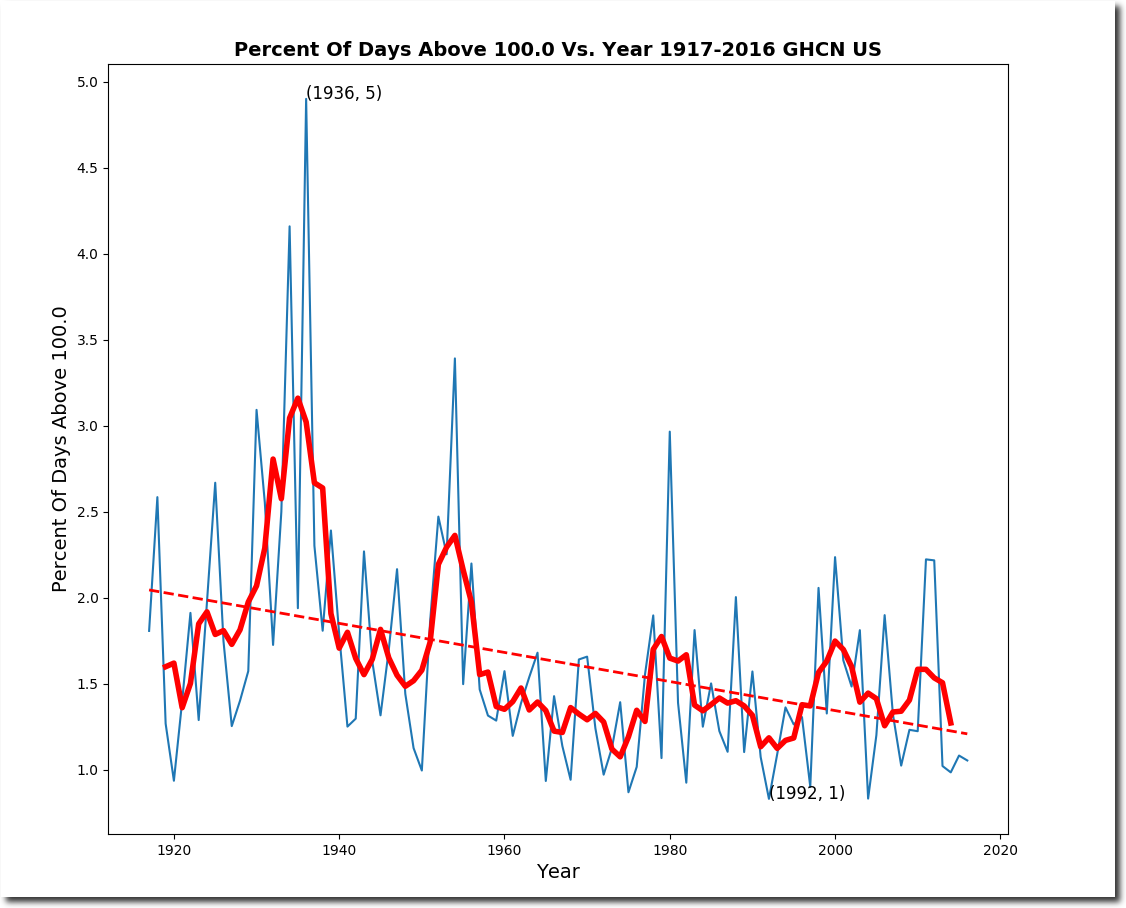
The percent of days which reached 100F each year peaked in 1936, and has dropped over the past century.
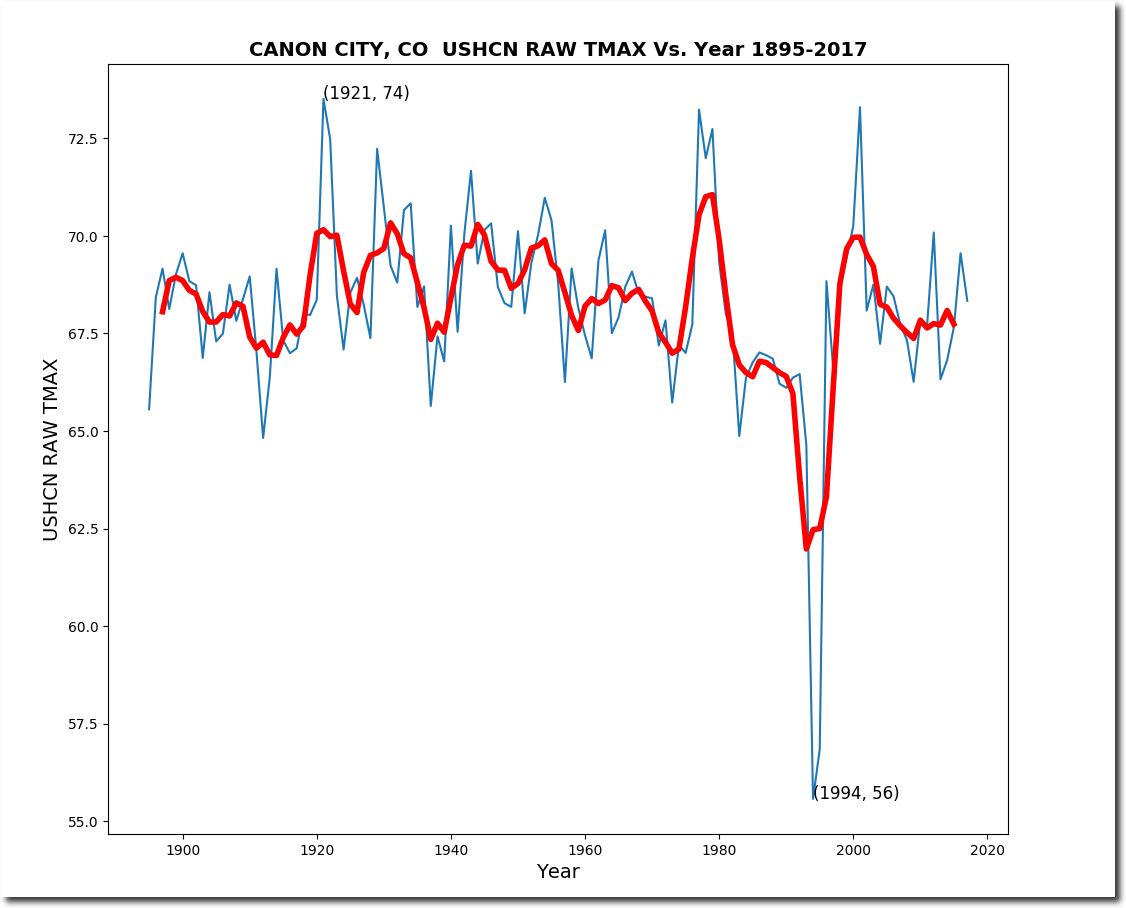
The USHCN monthly raw data is very close to the monthly average of the daily data, and shows sharp cooling over the last century. The average downwards trend at all stations is -0.005 degrees F per year.
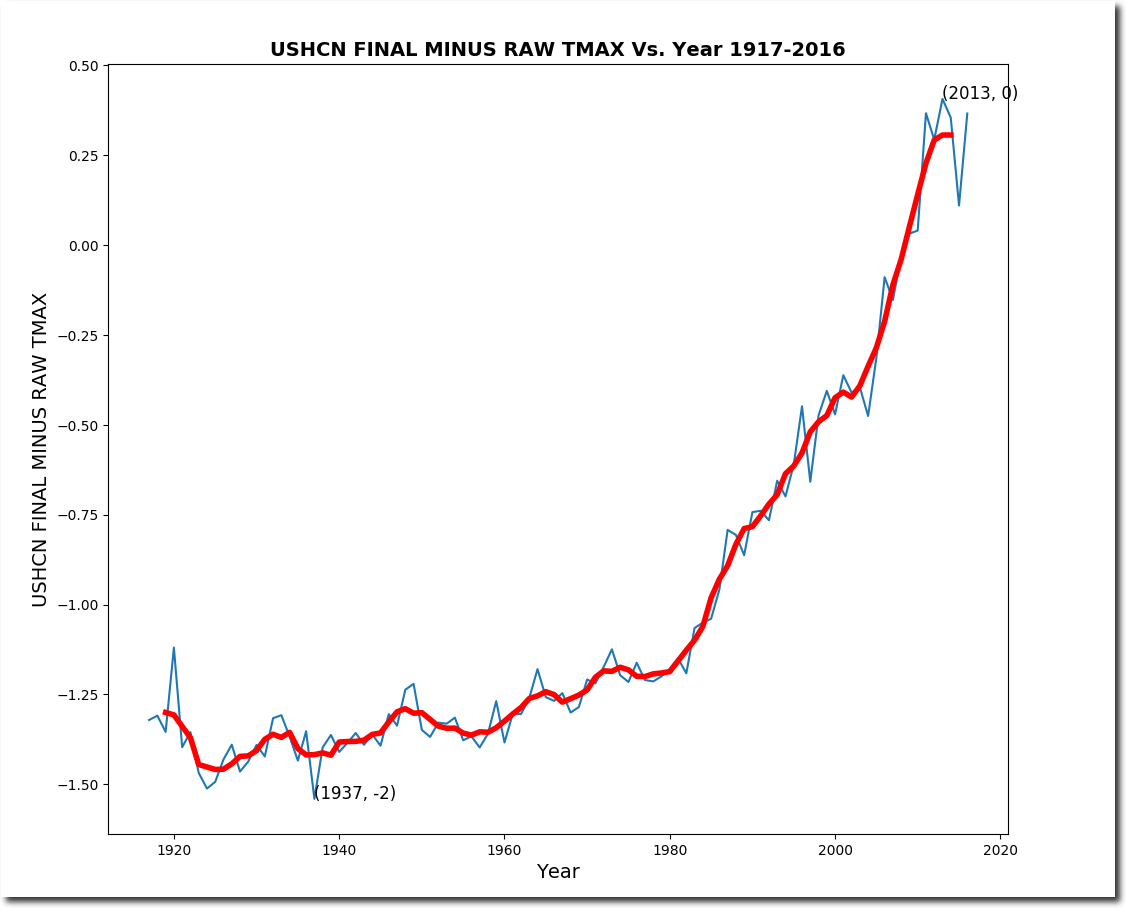
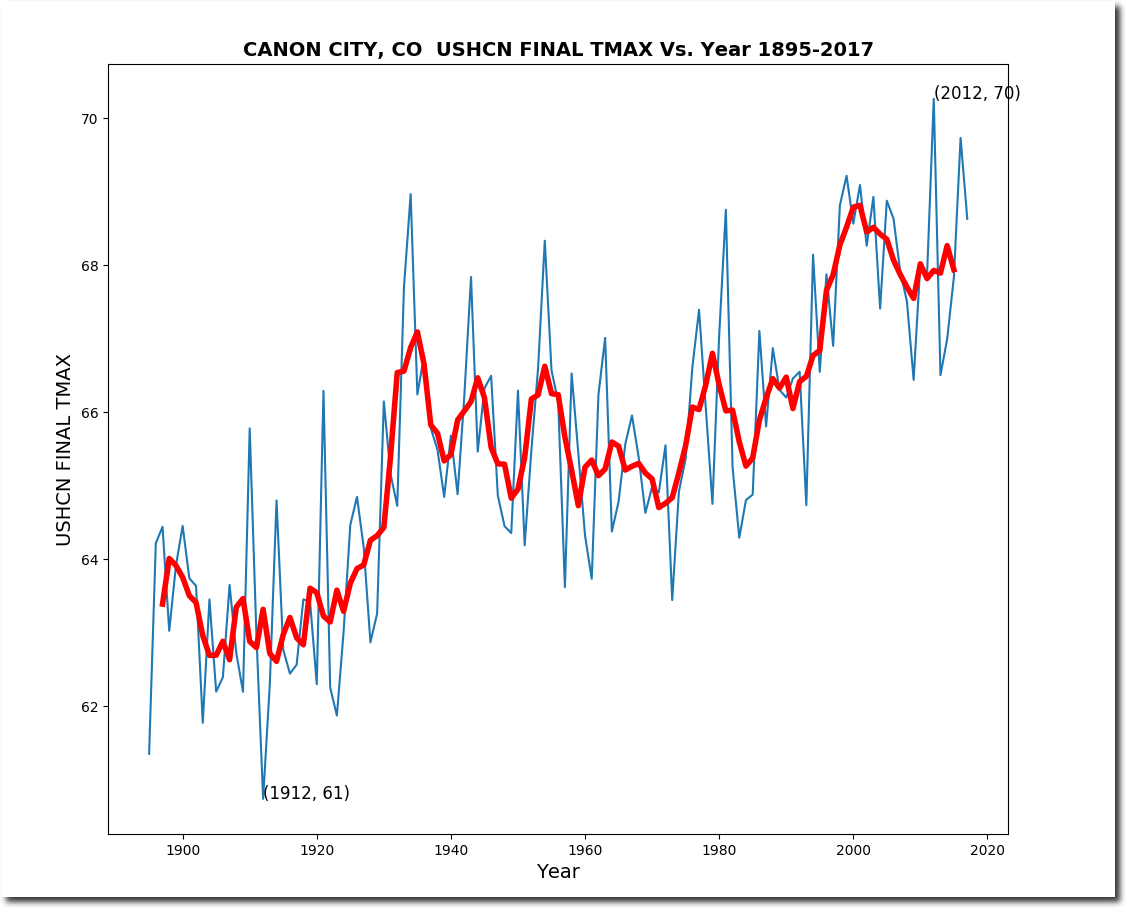
The adjusted monthly maximum temperatures from NOAA reverse the measured cooling trend and show warming. The average upwards adjusted trend is 0.008 degrees F per century. The average upwards adjustment is 0.013 degrees F per century, making for a signal to noise ratio of zero. No serious scientist or engineer would do what NOAA is doing to the US temperature record.
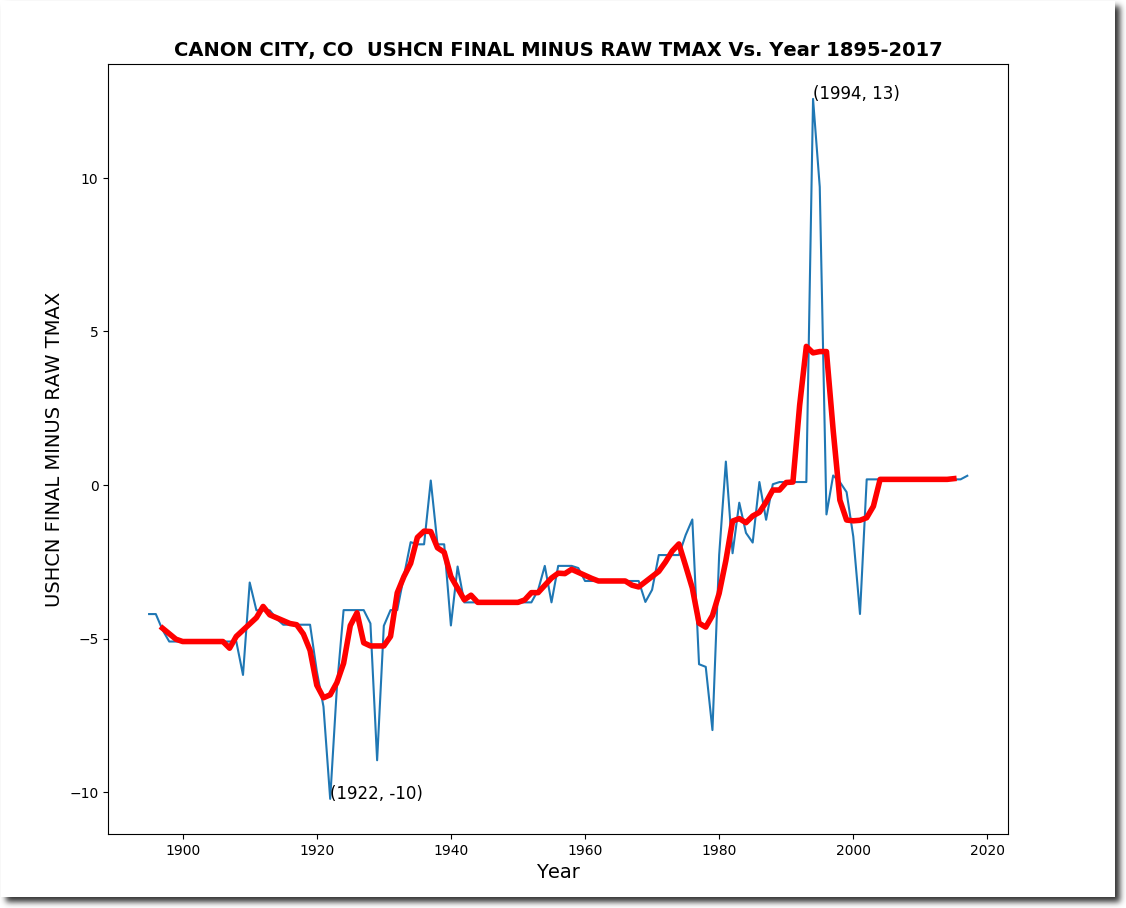
The reversal of the trend is accomplished via a spectacular hockey stick of data tampering, which massively cools the past and warms the present.
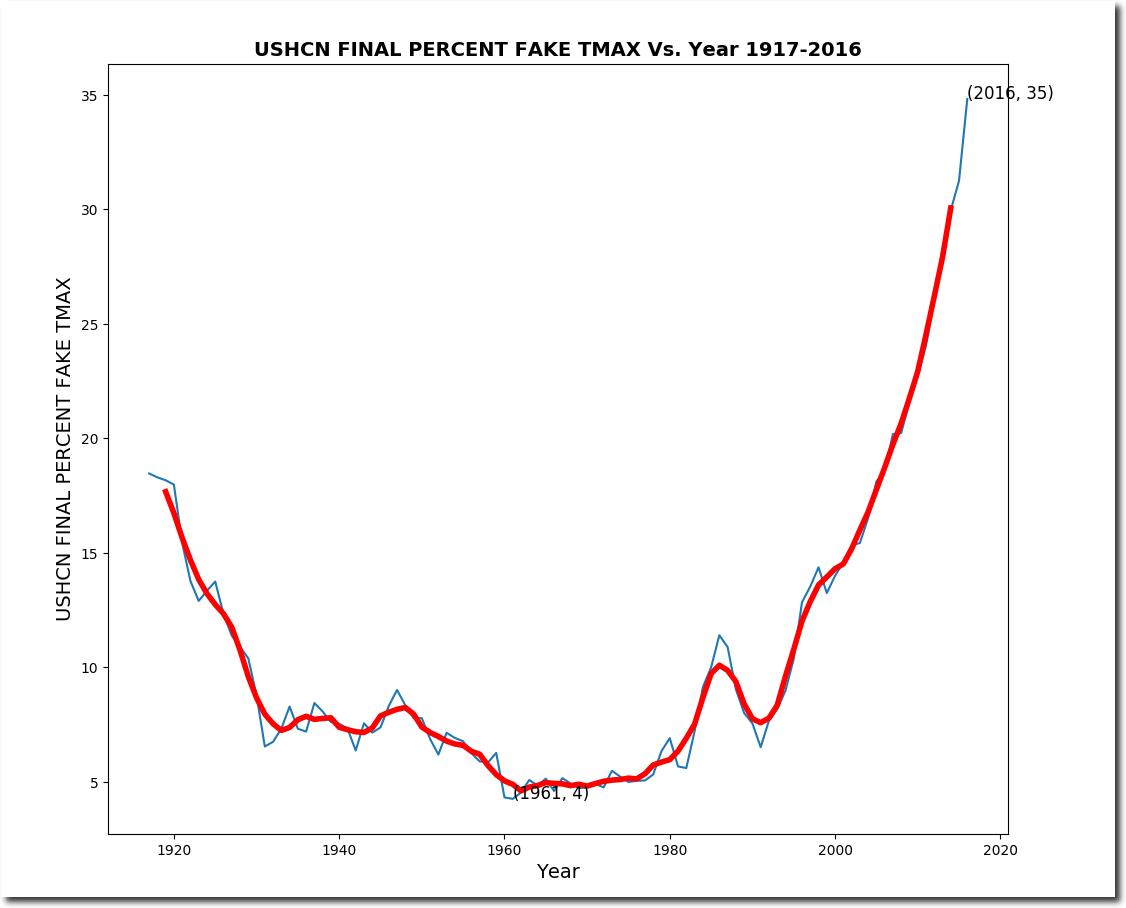
The largest component of this data tampering is simply making up fake data, which now comprises more than one third of the USHCN monthly adjusted temperature record.
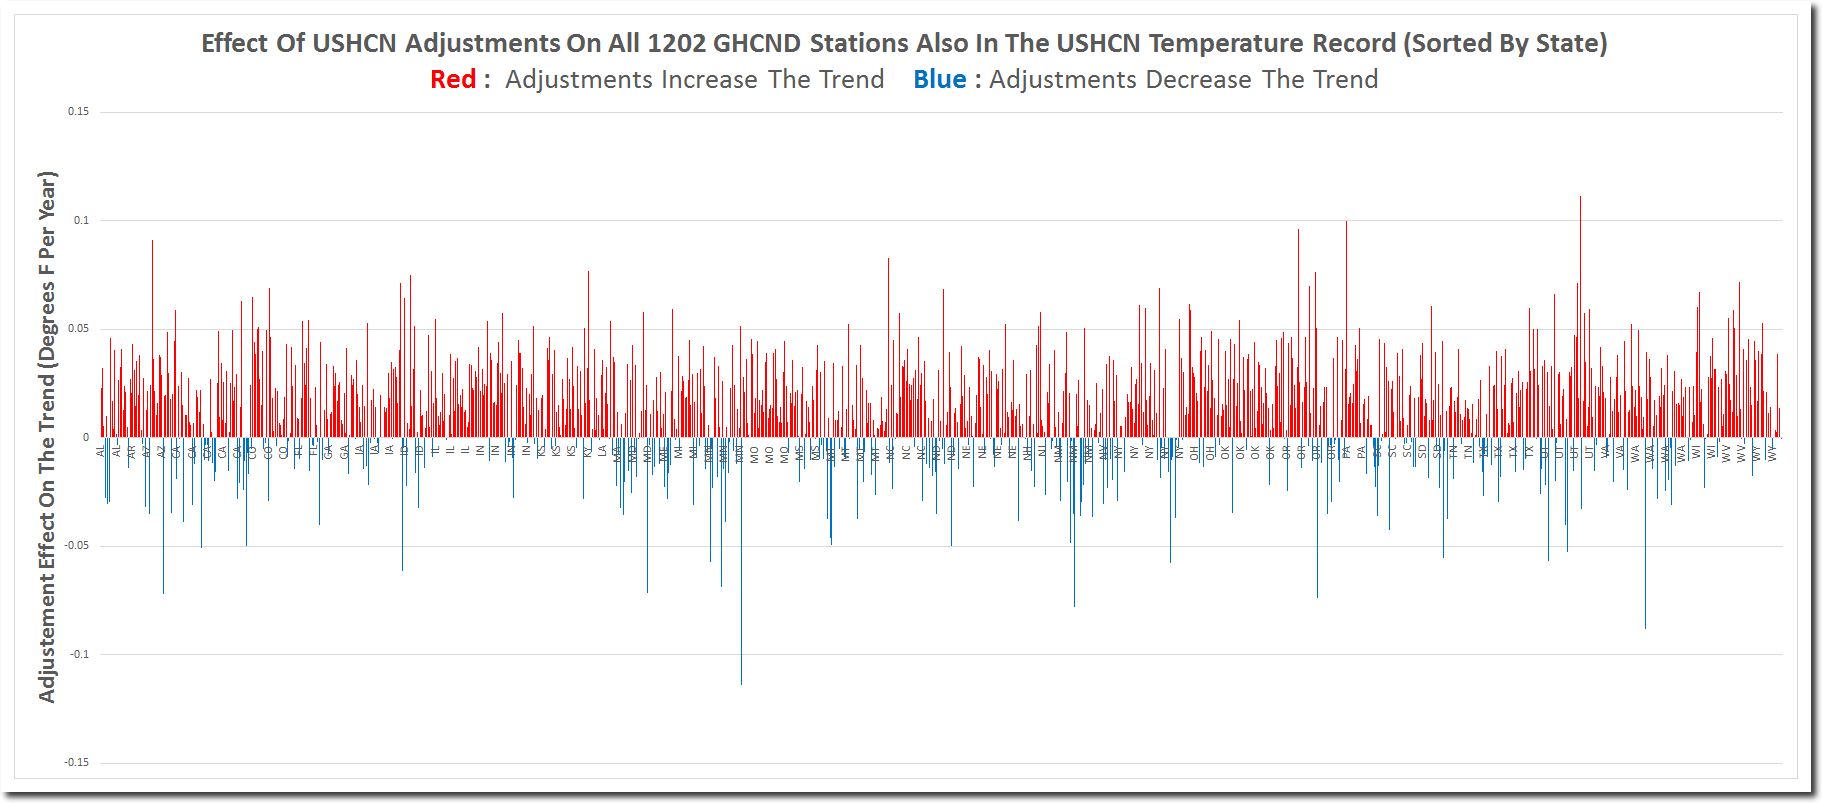
NOAA adjustments increase the trend at 74% of stations, by an average of 0.024 degrees F. Adjustments reduce the trend at 26% of stations by an average of -0.017 degrees F.
Meanwhile, Zeke and Nick claim that adjustments reduce warming, and some skeptics eat their BS right up.
A good example of NOAA data tampering is at Canon City, Colorado where NOAA turns a zero trend into a sharp warming trend, by cooling the past about five degrees.
Measured
Reported after data tampering.
Details of the data tampering.
The bottom line is that the US temperature record published by NOAA is completely fake – and has nothing to do with climate or science. It is an affront to all civilized and intelligent people.
Most people think of 1935 as being the Dust Bowl.
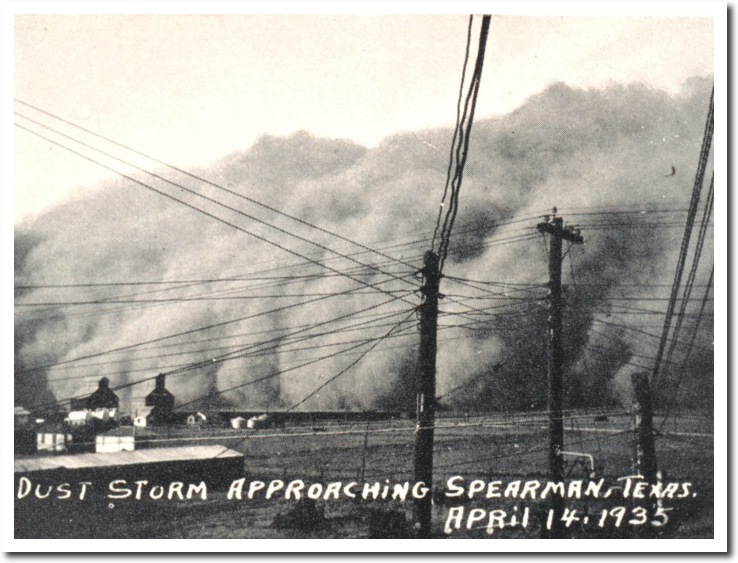
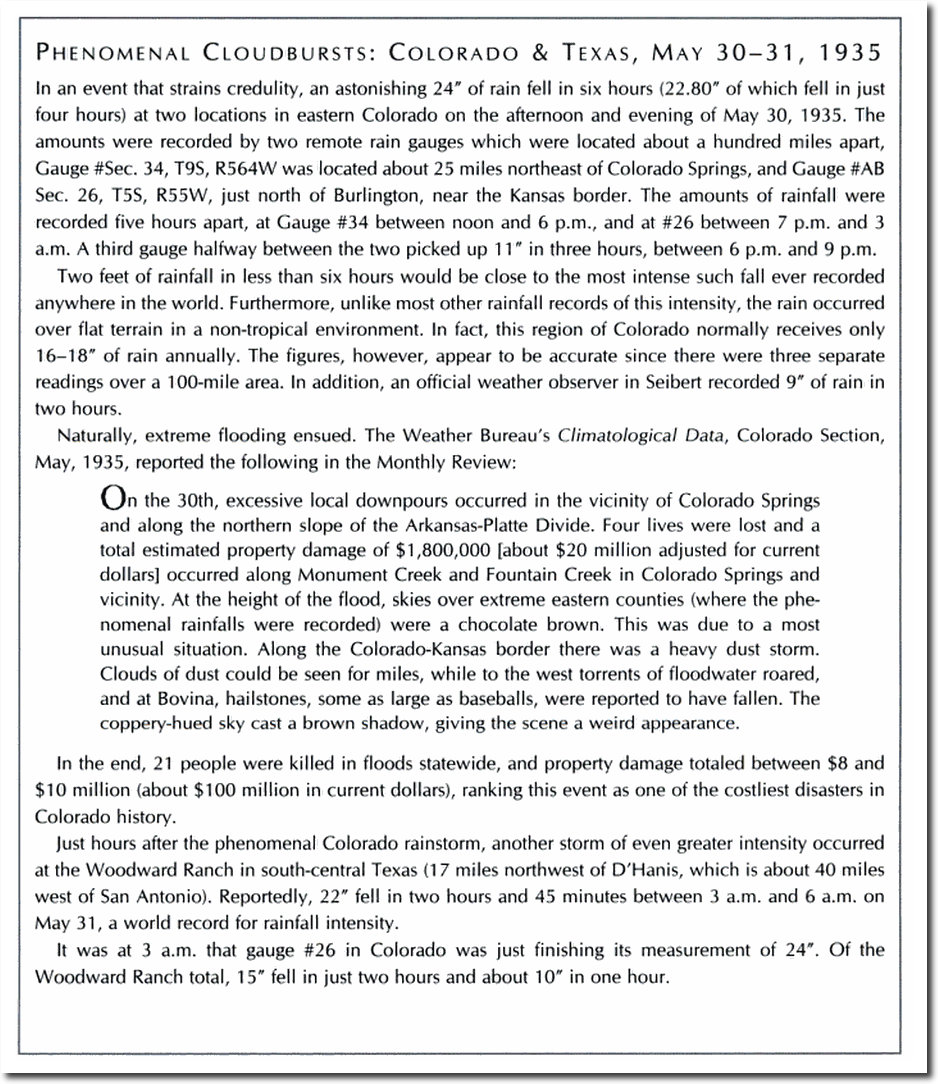
But 1935 also had record precipitation and hurricanes. On May 31, 1935 Woodward Ranch, Texas set the world record with 22 inches of rain in less than three hours.
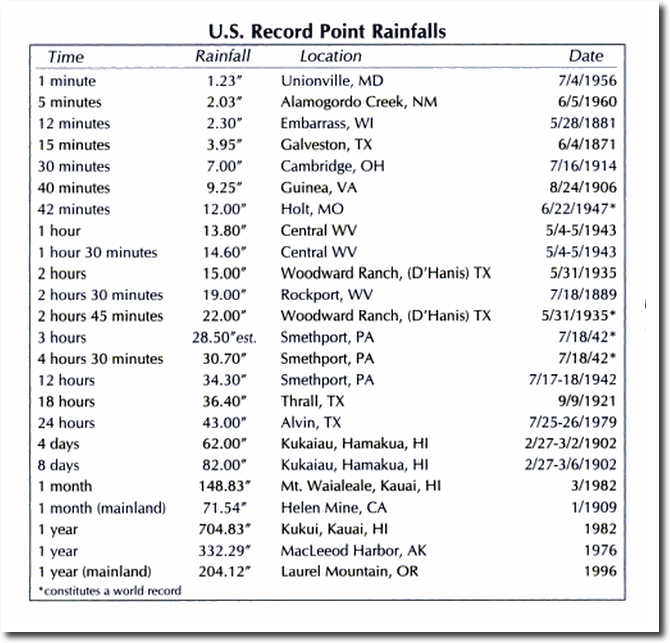
Colorado got nearly that much rain a few hours earlier.
Extreme Weather: A Guide & Record Book – Christopher C. Burt – Google Books
Labor Day, 1935 brought the most intense hurricane on record in the US. The Category 5 winds actually blew a train 30 feet of the tracks in the Florida keys.

CO2 was below 310 PPM at the time. There is zero evidence that CO2 increases severe weather, but since when does the left care about facts or evidence?
All summer we have been seeing plunging temperatures for the date over the past century. But as fall approaches we are seeing a change of climate. The average daily temperature and frequency of hot weather for fall days has not been declining.
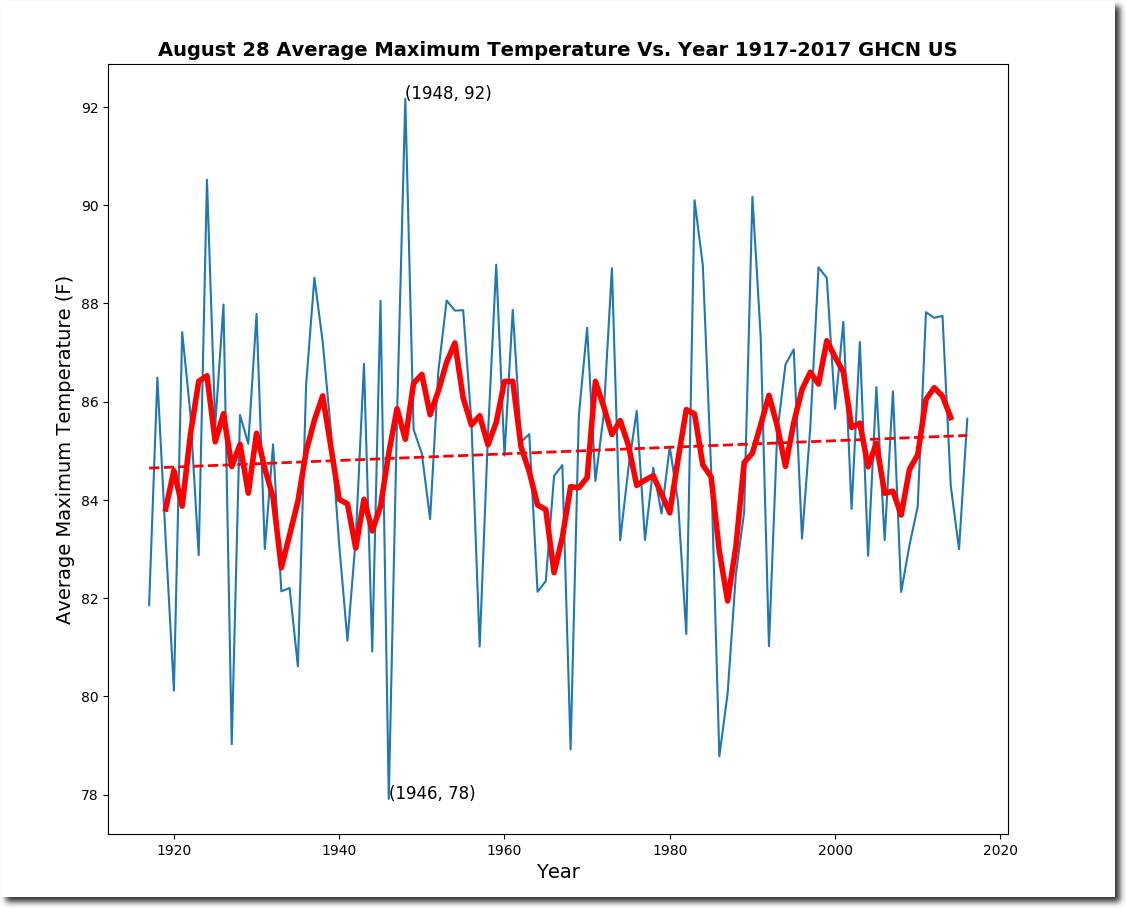
However, August 28, 1948 was a very hot day from coast to coast.
Joe Bastardi sent this map over. Hurricane Flora produced 100 inches of rain in Cuba in 1963.
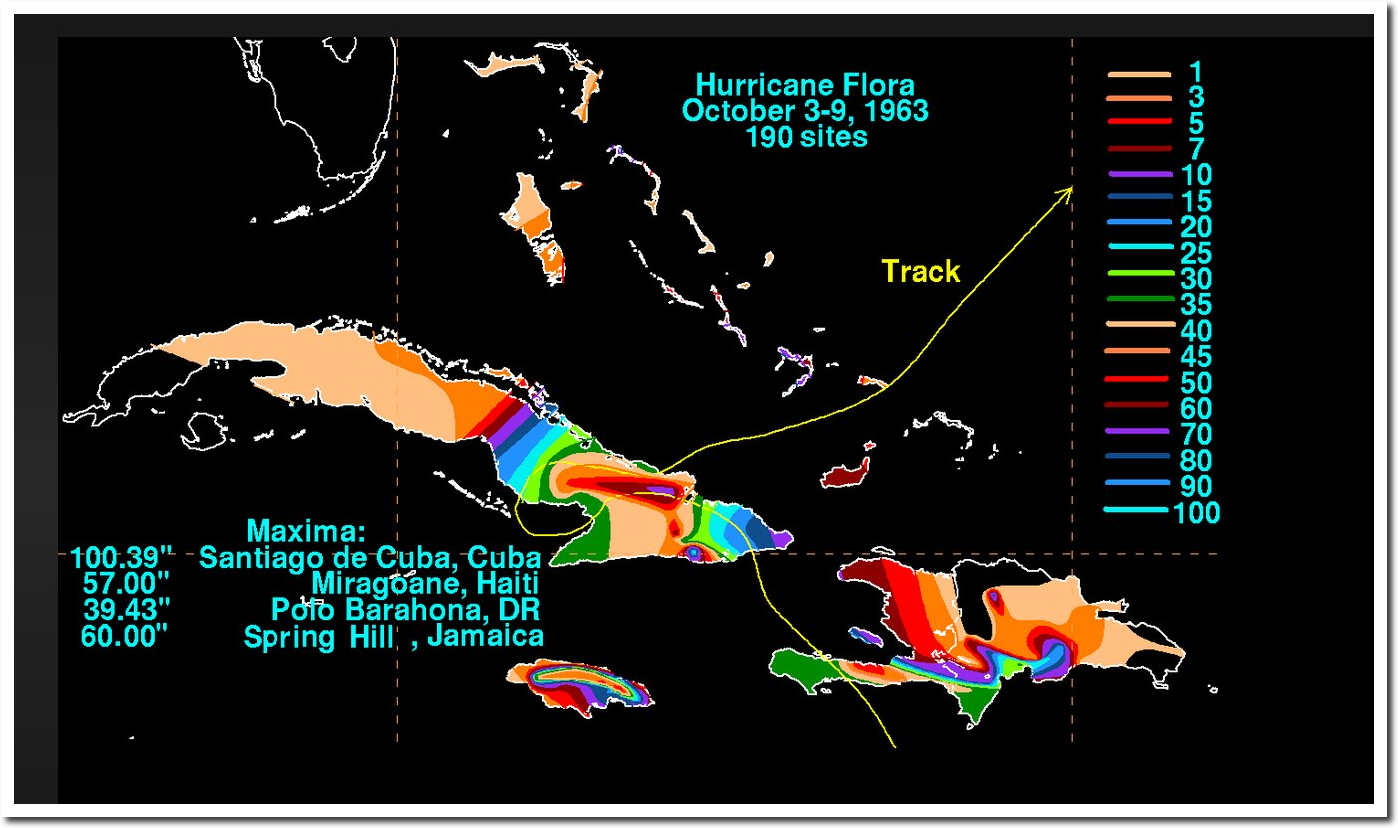
At the time, there was unanimous consensus among scientists that Earth was cooling.

Being a typical progressive, Fidel Castro raised taxes and blamed the US for the bad weather and his own failed leadership.
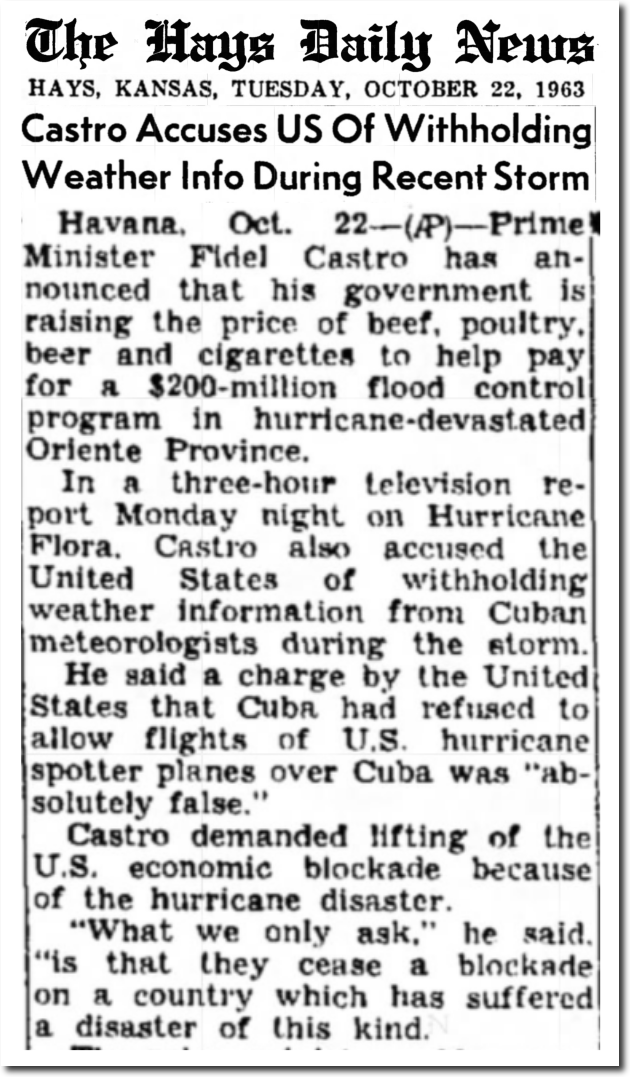 22 Oct 1963, Page 1 – The Hays Daily News
President Obama proudly posing in Cuba with Che Guevara

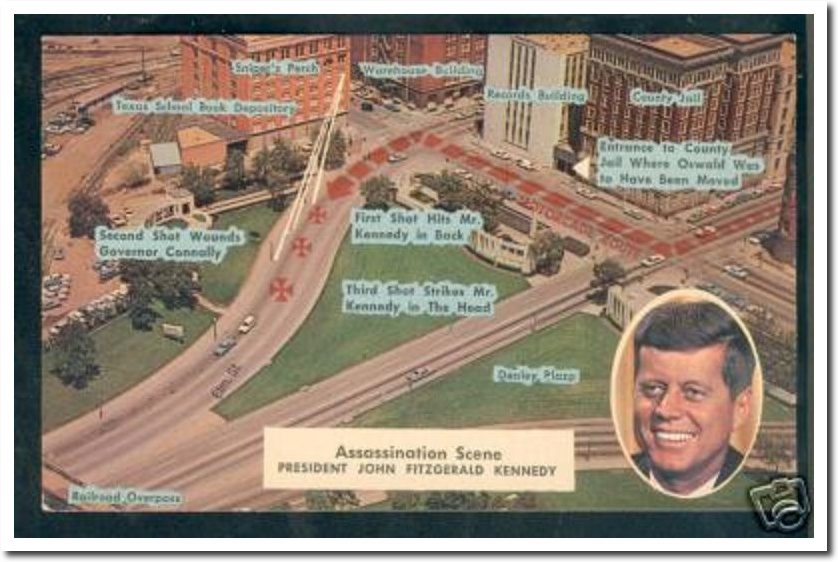
One month after Hurricane Flora, President Kennedy was assassinated by a “single shot through the right temple.” So the police of course arrested a guy whom they said was located directly behind the motorcade.
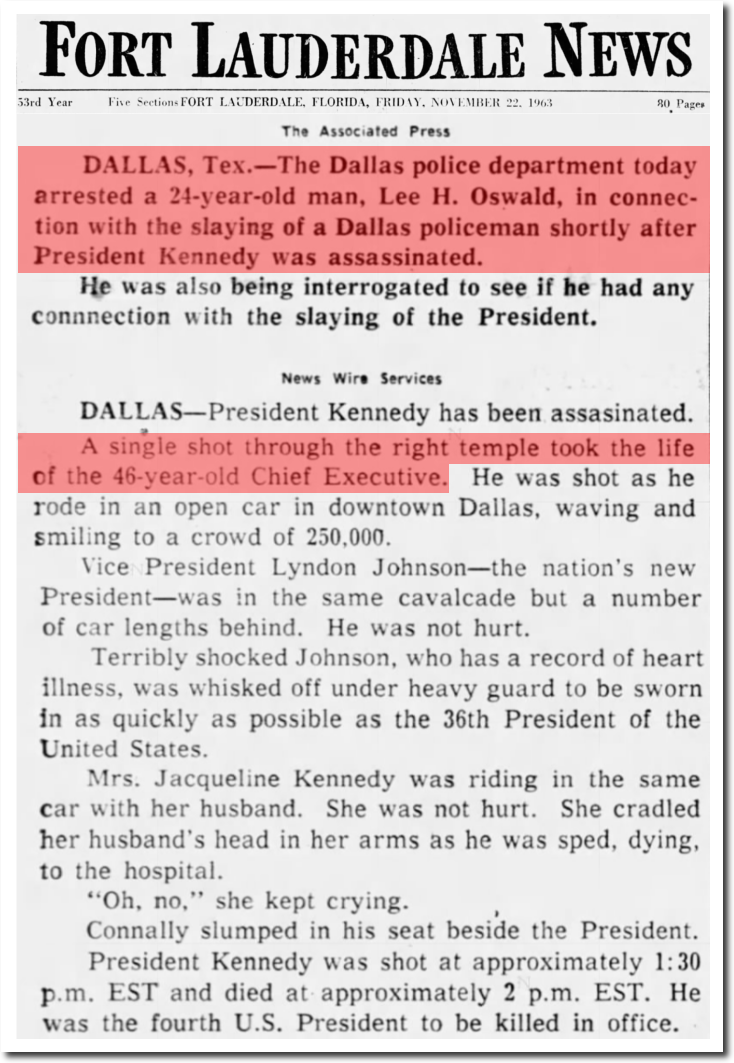
22 Nov 1963, 10 – Fort Lauderdale News

Oswald must have had one of those curvy bullets they use in Hollywood movies.
But no worries about that minor detail, because all of the accused conspirators started dying two days after the assassination.
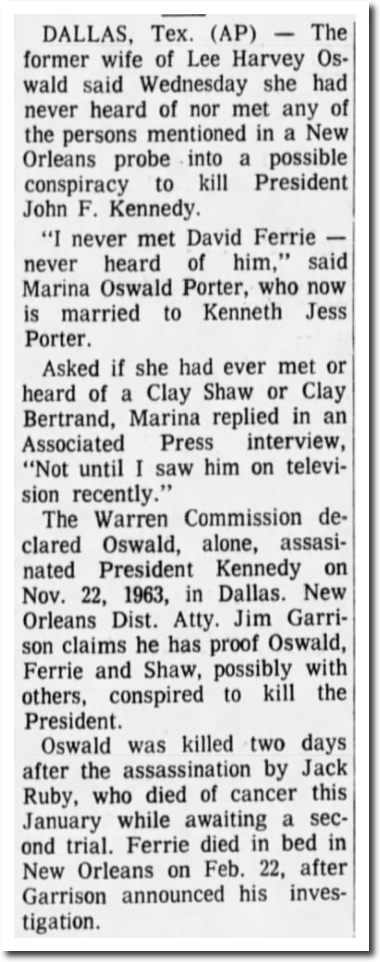
16 Mar 1967, Page 3 – Palladium-Item
We now know that everything bad which happens is due to increased carbon dioxide in the atmosphere, and that government never lies.
