Climate Emergency

20220719- europe heat manchins mountain condo scotus fallout

It is 99F in London during a very short lived heatwave, one degree cooler than 1911, when tens of thousands of people died in Europe during an extended heatwave.

London, United Kingdom Weather Conditions | Weather Underground

London reached 100 degrees on August 9, 1911.

29 Aug 1930 – DEATHS REPORTED. – Trove

11 Aug 1911, 5 – The Guardian at Newspapers.com

En 1911, Paris suffoquait déjà sous la canicule – Le Parisien

The 1911 Heat Wave Was So Deadly It Drove People Insane – New England Historical Society

This date in 1934 was much hotter.

“The unprecedented heat wave which has brought temperatures in America’s granary to the level of Death Valley heat continued unabated in the southwest today,

Government weather observers found no change in atmospheric conditions indicating a break in heat and drouth which has turned vast areas of normally fertile fields into desert- like stretches.

The death toll from the temperatures, which reached 117 degrees in some areas, has exceeded 20 in Nebraska, Missouri, Kansas, Texas and Oklahoma the last few days. Nine succumbed within the last 24 hours, five in Nebraska, two in Missouri and one each in Texas and Oklahoma”

19 Jul 1934, 1 – Salt Lake Telegram at Newspapers.com

AZ 116, NE 115, MO 114, KS 113, IA 112, SD 112, IL 111, OK 111, TX 110

CA 108, CO 108, AR 107, MN 107, LA 106, MT 106, ID 105, WY 105, ND 104, UT 104, TN 103, GA 102, MS 102, NM 102, AL 101, VA 101, OH 100, OR 100

KY 99, SC 99, IN 98, MI 98, NV 98, NY 98, WV 98, WI 98, PA 97, FL 96, MD 96, VT 95, WA 95, NC 94, CT 93, NH 93, NJ 93, DE 91, ME 91, MA 90,

Temperatures over 110F used to be quite common in Oklahoma, but rarely happen any more.

According to the National Climate Assessment, heatwaves used to be much more severe in the US prior to 60 years ago.


Temperature Changes in the United States – Climate Science Special Report

Data from the EPA shows the same thing.

Climate Change Indicators: High and Low Temperatures | Climate Change Indicators in the United States | US EPA

“Whenever an unusually hot season is upon us, sweltering humanity talks about the changes in climate and shakes its head in a foreboding fashion.”

Morning Oregonian. (Portland, Or.) 1861-1937, July 24, 1906, Page 8, Image 8 « Historic Oregon Newspapers

Posted in Uncategorized | Leave a comment

Washington Post “Global Heat Waves”

Opinion | Global heat waves should be a climate change warning – The Washington Post

There isn’t any global heat wave – temperatures are close to the 1979-2000 mean.

Climate Reanalyzer

If the Washington Post editorial staff had of bothered to go the National Park Service web site, they would have known that fire is normal and essential for Sequoias.

“The importance of fire to giant sequoias cannot be overstated. Other than the change of seasons, fire is the most recurrent and critical process in determining the life his­tory of this species. Tree-ring records from giant sequoias show that frequent surface fires were the typical pattern of fire occurrence over the past 2,000 years. But this pattern changed after about 1860, when fire frequency declined sharply. This decline in regional fire was probably a result of intensive sheep grazing that began about this time (reducing live and dead vegetation that carries ground fire beneath the trees) and a decrease in fires set by Native Americans, followed by fire suppression by government agencies.”

Giant Sequoias and Fire – Sequoia & Kings Canyon National Parks (U.S. National Park Service)

Posted in Uncategorized | Leave a comment

Washington Post “Global Heat Waves”

The US Press censors all discussion of energy policy by the public because “the public lacks climate credentials.” Yet every journalist, politician and 17 year old high-school truant willing to spout climate superstition, is given a megaphone.

Posted in Uncategorized | Leave a comment

Washington Post – Joe Manchin Controls The Climate

The American Meteorological Society says the US Supreme Court controls the climate, but the Washington Post says it is actually controlled by Joe Manchin.

U.S. plan to avoid extreme climate change is running out of time – The Washington Post

“The AMS is deeply concerned by the United States’ inadequate response to climate change and the dangers it poses to the nation and all life. . This inadequacy is illustrated most recently–but by no means only–through the Supreme Court decision West Virginia v. EPA

Climate change is a highly solvable problem”

AMS_Statement-EPA-2(1).pdf

The Washington Post wants people to pay them money to read their propaganda.

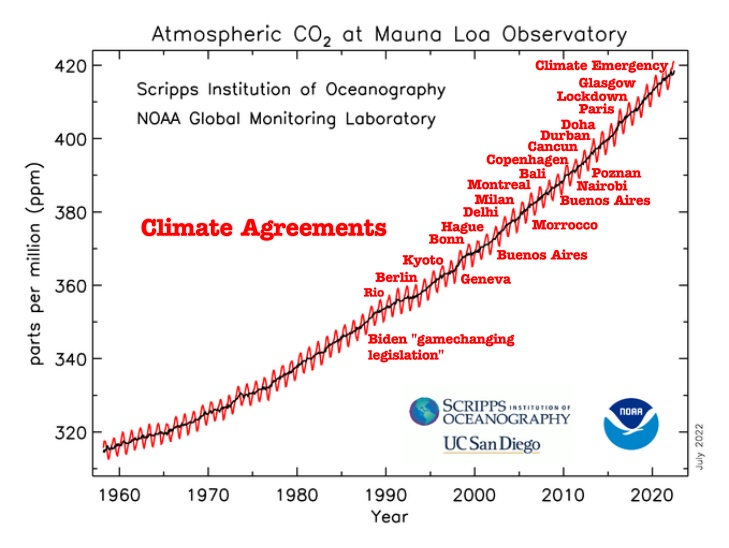
“President Biden’s climate pledge” has no meaning in the overall global CO2 budget, which is dominated by countries with leaders who want their countries to succeed.

Annual CO? emissions

Annual CO? emissions from fossil fuels, by world region

Posted in Uncategorized | Leave a comment

The Worst US July Heatwaves

During July 1936 four states were over 120F, twenty-three states were over 110F, forty-three states were over 100F and every state was over 90F.

CA 121, ND 121, OK 120, SD 120

AZ 119, KS 118, MO 118, NE 118, IA 117, AR 114, IL 114, IN 114, TX 114, KY 113, MT 113, WI 113, CO 112, ID 112, WV 112, MN 111, UT 111, OH 110, WY 110

MI 109, NV 109, VA 109, NM 108, AL 107, OR 107, PA 107, WA 107, MD 106, MS 106, NJ 106, NY 106, NC 106, DE 105, GA 105, SC 105, LA 104, TN 104, FL 103, CT 100

NH 99, MA 98, VT 97, ME 92, RI 90

During July 1954 Kansas was over 120F, twelve states were over 110F, thirty-nine states were over 100F and forty-six states over 90F.

KS 120

CA 119, AZ 117, OK 117, MO 116, NE 116, AR 115, IL 115, TX 114, CO 112, SD 111, NV 110

UT 109, IN 108, LA 108, MT 108, GA 107, KY 107, NM 107, ND 107, TN 107, IA 106, MS 106, NC 106, WY 106, OH 105, OR 105, SC 105, VA 105, NJ 104, AL 103, DE 103, ID 103, MD 103, NY 103, WV 103, PA 102, FL 101, MN 100

WA 98, WI 98, CT 96, MA 96, MI 96, RI 94, NH 92

During July 1980 California was over 120F, nine states were over 110F, forty-three states were over 100F and every state was over 90F.

CA 124

AZ 118, OK 117, KS 114, MO 112, TX 112, AR 111, NE 111, NV 110

CO 109, MT 109, SC 109, SD 109, IL 108, MS 108, UT 108, AL 107, GA 107, ID 107, KY 107, FL 106, IA 106, LA 106, NM 106, ND 106, TN 106, WY 106, IN 105, OR 105, NY 104, WA 104, MN 103, NJ 103, NC 103, DE 102, VA 102, WI 102, MD 101, OH 101, PA 101, MA 100, RI 100, WV 100

CT 99, MI 96, ME 94, NH 94, VT 92,

During July 1934 California and Arizona were over 120F, twenty-four states were over 110F, forty-one states were over 100F and every state was over 90F.

CA 122, AZ 120

KS 118, NE 118, ID 117, MO 116, NM 116, SD 116, OK 115, IL 114, MN 113, TX 113, CO 112, IN 112, IA 112, NV 112, ND 112, UT 112, AR 111, OH 111, KY 110, MS 110, OR 110, WA 110

MT 109, TN 109, LA 108, MI 108, WV 107, WI 107, WY 106, GA 105, PA 105, SC 105, VA 105, AL 102, NY 102, NC 102, DE 101, MD 101, NJ 100

FL 98, CT 97, MA 96, NH 95, VT 95, ME 94, RI 90

During July 1930 seventeen states were over 110F, forty-two states were over 100F and forty-seven states were over 90F.

AZ 117, CA 116, AR 115, KY 114, MS 114, IN 113, MO 113, IL 112, NE 112, SD 112, KS 111, LA 111, OK 111, IA 110, NM 110, TN 110, TX 110

AL 109, GA 109, OH 109, VA 109, ID 108, MN 108, MT 108, SC 108, ND 107, UT 107, MD 106, WA 106, WV 106, WY 106, DE 105, MI 105, NC 105, CO 104, OR 104, PA 104, WI 104, FL 103, NV 103, NY 103, NJ 102

CT 99, MA 95, NH 95, ME 91, VT 90

During July 1901 fourteen states were over 110F, forty-two states were over 100F and every state was over 90F.

AZ 117, MO 116, OK 113, AR 112, IL 112, IN 112, UT 112, KS 111, WI 111, IA 110, MT 110, NE 110, TN 110, TX 110

CA 109, KY 109, LA 109, MS 109, SD 109, CO 108, ND 108, MN 107, NJ 107, PA 107, ID 106, AL 105, DE 105, FL 105, MD 105, OH 105, WY 105, GA 104, NV 104, NC 104, WA 104, MI 103, NY 103, NM 102, SC 102, VA 102, ME 101, WV 100

NH 98, OR 98, MA 97, VT 97, CT 95, RI 93


The Washington Post knows about the 1930 heatwave. Unfortunately their editorial board doesn’t seem to read their own newspaper.

“By the end of the summer of 1930, approximately 30 deaths in Washington were blamed on the heat and thousands more had died nationwide. In Washington, there has never been another summer with a heat wave that has equaled the summer of 1930.”

Capital Weather Gang – The heat waves of the 1930s

Posted in Uncategorized | Leave a comment

July 19, 1934 : 117 Degrees In Nebraska

“The unprecedented heat wave which has brought temperatures in America’s granary to the level of Death Valley heat continued unabated in the southwest today,

Government weather observers found no change in atmospheric conditions indicating a break in heat and drouth which has turned vast areas of normally fertile fields into desert- like stretches.

The death toll from the temperatures, which reached 117 degrees in some areas, has exceeded 20 in Nebraska, Missouri, Kansas, Texas and Oklahoma the last few days. Nine succumbed within the last 24 hours, five in Nebraska, two in Missouri and one each in Texas and Oklahoma”

19 Jul 1934, 1 – Salt Lake Telegram at Newspapers.com

AZ 116, NE 115, MO 114, KS 113, IA 112, SD 112, IL 111, OK 111, TX 110

CA 108, CO 108, AR 107, MN 107, LA 106, MT 106, ID 105, WY 105, ND 104, UT 104, TN 103, GA 102, MS 102, NM 102, AL 101, VA 101, OH 100, OR 100

KY 99, SC 99, IN 98, MI 98, NV 98, NY 98, WV 98, WI 98, PA 97, FL 96, MD 96, VT 95, WA 95, NC 94, CT 93, NH 93, NJ 93, DE 91, ME 91, MA 90,

Posted in Uncategorized | Leave a comment

“U.N. computer predictions”

Posted in Uncategorized | Leave a comment

“Multiple Sources Confirm”

Original journalism from our independent fact checkers in the press corps.

Posted in Uncategorized | Leave a comment

“U.N. computer predictions”

In 2007, the UN announced the demise of Alaska sea ice and said it threatened Polar Bears.

“Alaska’s sea ice recedes at fast rate

ANCHORAGE, Alaska — An analysis of 20 years’ worth of real-life observations supports recent U.N. computer predictions that by 2050, summer sea ice off Alaska’s north coast will probably shrink to nearly half the area it covered in the 1980s, federal scientists say.

Such a loss could have profound effects on mammals dependent on the sea ice, such as polar bears, now being considered for threatened species status . because of changes in habitat due to global warming. In the 1980s, sea ice receded 30 to 50 miles each summer off the north coast, said James Overland, a Seattle-based oceanographer for the National Oceanic and Atmospheric Administration.”

07 Sep 2007, A22 – The Record at Newspapers.com

There is a lot more sea ice off the coast of Alaska now than there was fifteen years ago.

CICE_combine_thick_SM_EN_20070716.png (728×631)

CICE_combine_thick_SM_EN_20220716.png (728×631)

The Arctic was ice-free 6,000 years ago with CO2 levels lower, and the Polar Bears survived fine.

“ice cover in the Arctic Ocean was greatly reduced some 6000-7000 years ago. The Arctic Ocean may have been periodically ice free”

Less Ice In Arctic Ocean 6000-7000 Years Ago — ScienceDaily

Holocene Treeline History and Climate Change Across Northern Eurasia – ScienceDirect

In 2017 the US Government repeated the same claim.

“Federal wildlife officials on Monday called climate change the biggest threat to the survival of the polar bear and warned that without decisive action to combat global warming, the bears would almost certainly disappear from much of the Arctic. “It cannot be overstated that the single most important action for the recovery of polar bears is to significantly reduce the present levels of global greenhouse gas emissions,” the officials wrote in a report released by the Fish and Wildlife Service.”

Human-Driven Global Warming Is Biggest Threat to Polar Bears, Report Says – The New York Times

In 1971, National Geographic showed the sea ice edge far off the coast of Alaska.

https://interactivity.partica.online/NatGeoMaps/mapviewer.html?mapName=1971_10_Arctic Ocean_side 1

Almost all of the post-industrial increase in CO2 has occurred since then.

Global Monitoring Laboratory – Carbon Cycle Greenhouse Gases

According to the 1990 IPCC report, sea ice extent was vey low in the early 1970s.

1990 IPCC Report

NOAA now claims they don’t have satellite data before 1979.

2nd lowest in the satellite record (1979-2020).

The coldest year on record in Iceland was 1979, and it was the peak year for sea ice,

V2 Measured

“Telltale signs are everywhere —from the unexpected persistence and thickness of pack ice in the waters around Iceland to the southward migration of a warmth-loving creature like the armadillo from the Midwest. Since the 1940s the mean global temperature has dropped about 2.7° F.”

TIME Magazine Archive Article — Another Ice Age? — Jun. 24, 1974

“The Earth Is Cooling, Return of Ice Age Is Feared

—Snow banks cover areas of Baffin Island today which were seasonally snow-free 30 or 40 years before the present cooling, J. T. Andrews and his colleagues at the University of Colorado at Boulder report. Similarly, pack ice around Iceland is once again becoming the serious hindrance to navigation it was during the “‘little ice age”

14 Apr 1973, Page 8 – Iowa City Press-Citizen

There was an ice age during the Ordovician with CO2 l3vels ten times higher than now.  There is no indication ice correlates with CO2.

An extraterrestrial trigger for the mid-Ordovician ice age: Dust from the breakup of the L-chondrite parent body

Global temperature and atmospheric CO2 over geological time (600 mya)

Posted in Uncategorized | Leave a comment

100 Degrees In London

“Whenever an unusually hot season is upon us, sweltering humanity talks about the changes in climate and shakes its head in a foreboding fashion.”

– The Morning Oregonian July 24, 1906

Posted in Uncategorized | Leave a comment