

Disrupting the Borg is expensive and time consuming!

Google Search
-
Recent Posts
- Analyzing The Western Water Crisis
- Gaslighting 1924
- “Why Do You Resist?”
- Climate Attribution Model
- Fact Checking NASA
- Fact Checking Grok
- Fact Checking The New York Times
- New Visitech Features
- Ice-Free Arctic By 2014
- Debt-Free US Treasury Forecast
- Analyzing Big City Crime (Part 2)
- Analyzing Big City Crime
- UK Migration Caused By Global Warming
- Climate Attribution In Greece
- “Brown: ’50 days to save world'”
- The Catastrophic Influence of Bovine Methane Emissions on Extraterrestrial Climate Patterns
- Posting On X
- Seventeen Years Of Fun
- The Importance Of Good Tools
- Temperature Shifts At Blue Hill, MA
- CO2²
- Time Of Observation Bias
- Climate Scamming For Profit
- Climate Scamming For Profit
- Back To The Future
March 2026 M T W T F S S 1 2 3 4 5 6 7 8 9 10 11 12 13 14 15 16 17 18 19 20 21 22 23 24 25 26 27 28 29 30 31 Recent Comments
- Gordon Vigurs on Analyzing The Western Water Crisis
- Bob G on Analyzing The Western Water Crisis
- Bob G on Analyzing The Western Water Crisis
- Bob G on Analyzing The Western Water Crisis
- Mike Peinsipp on Analyzing The Western Water Crisis
- Bob G on Analyzing The Western Water Crisis
- Bob G on Analyzing The Western Water Crisis
- Robertvd on Analyzing The Western Water Crisis
- Bob G on Analyzing The Western Water Crisis
- conrad ziefle on Analyzing The Western Water Crisis
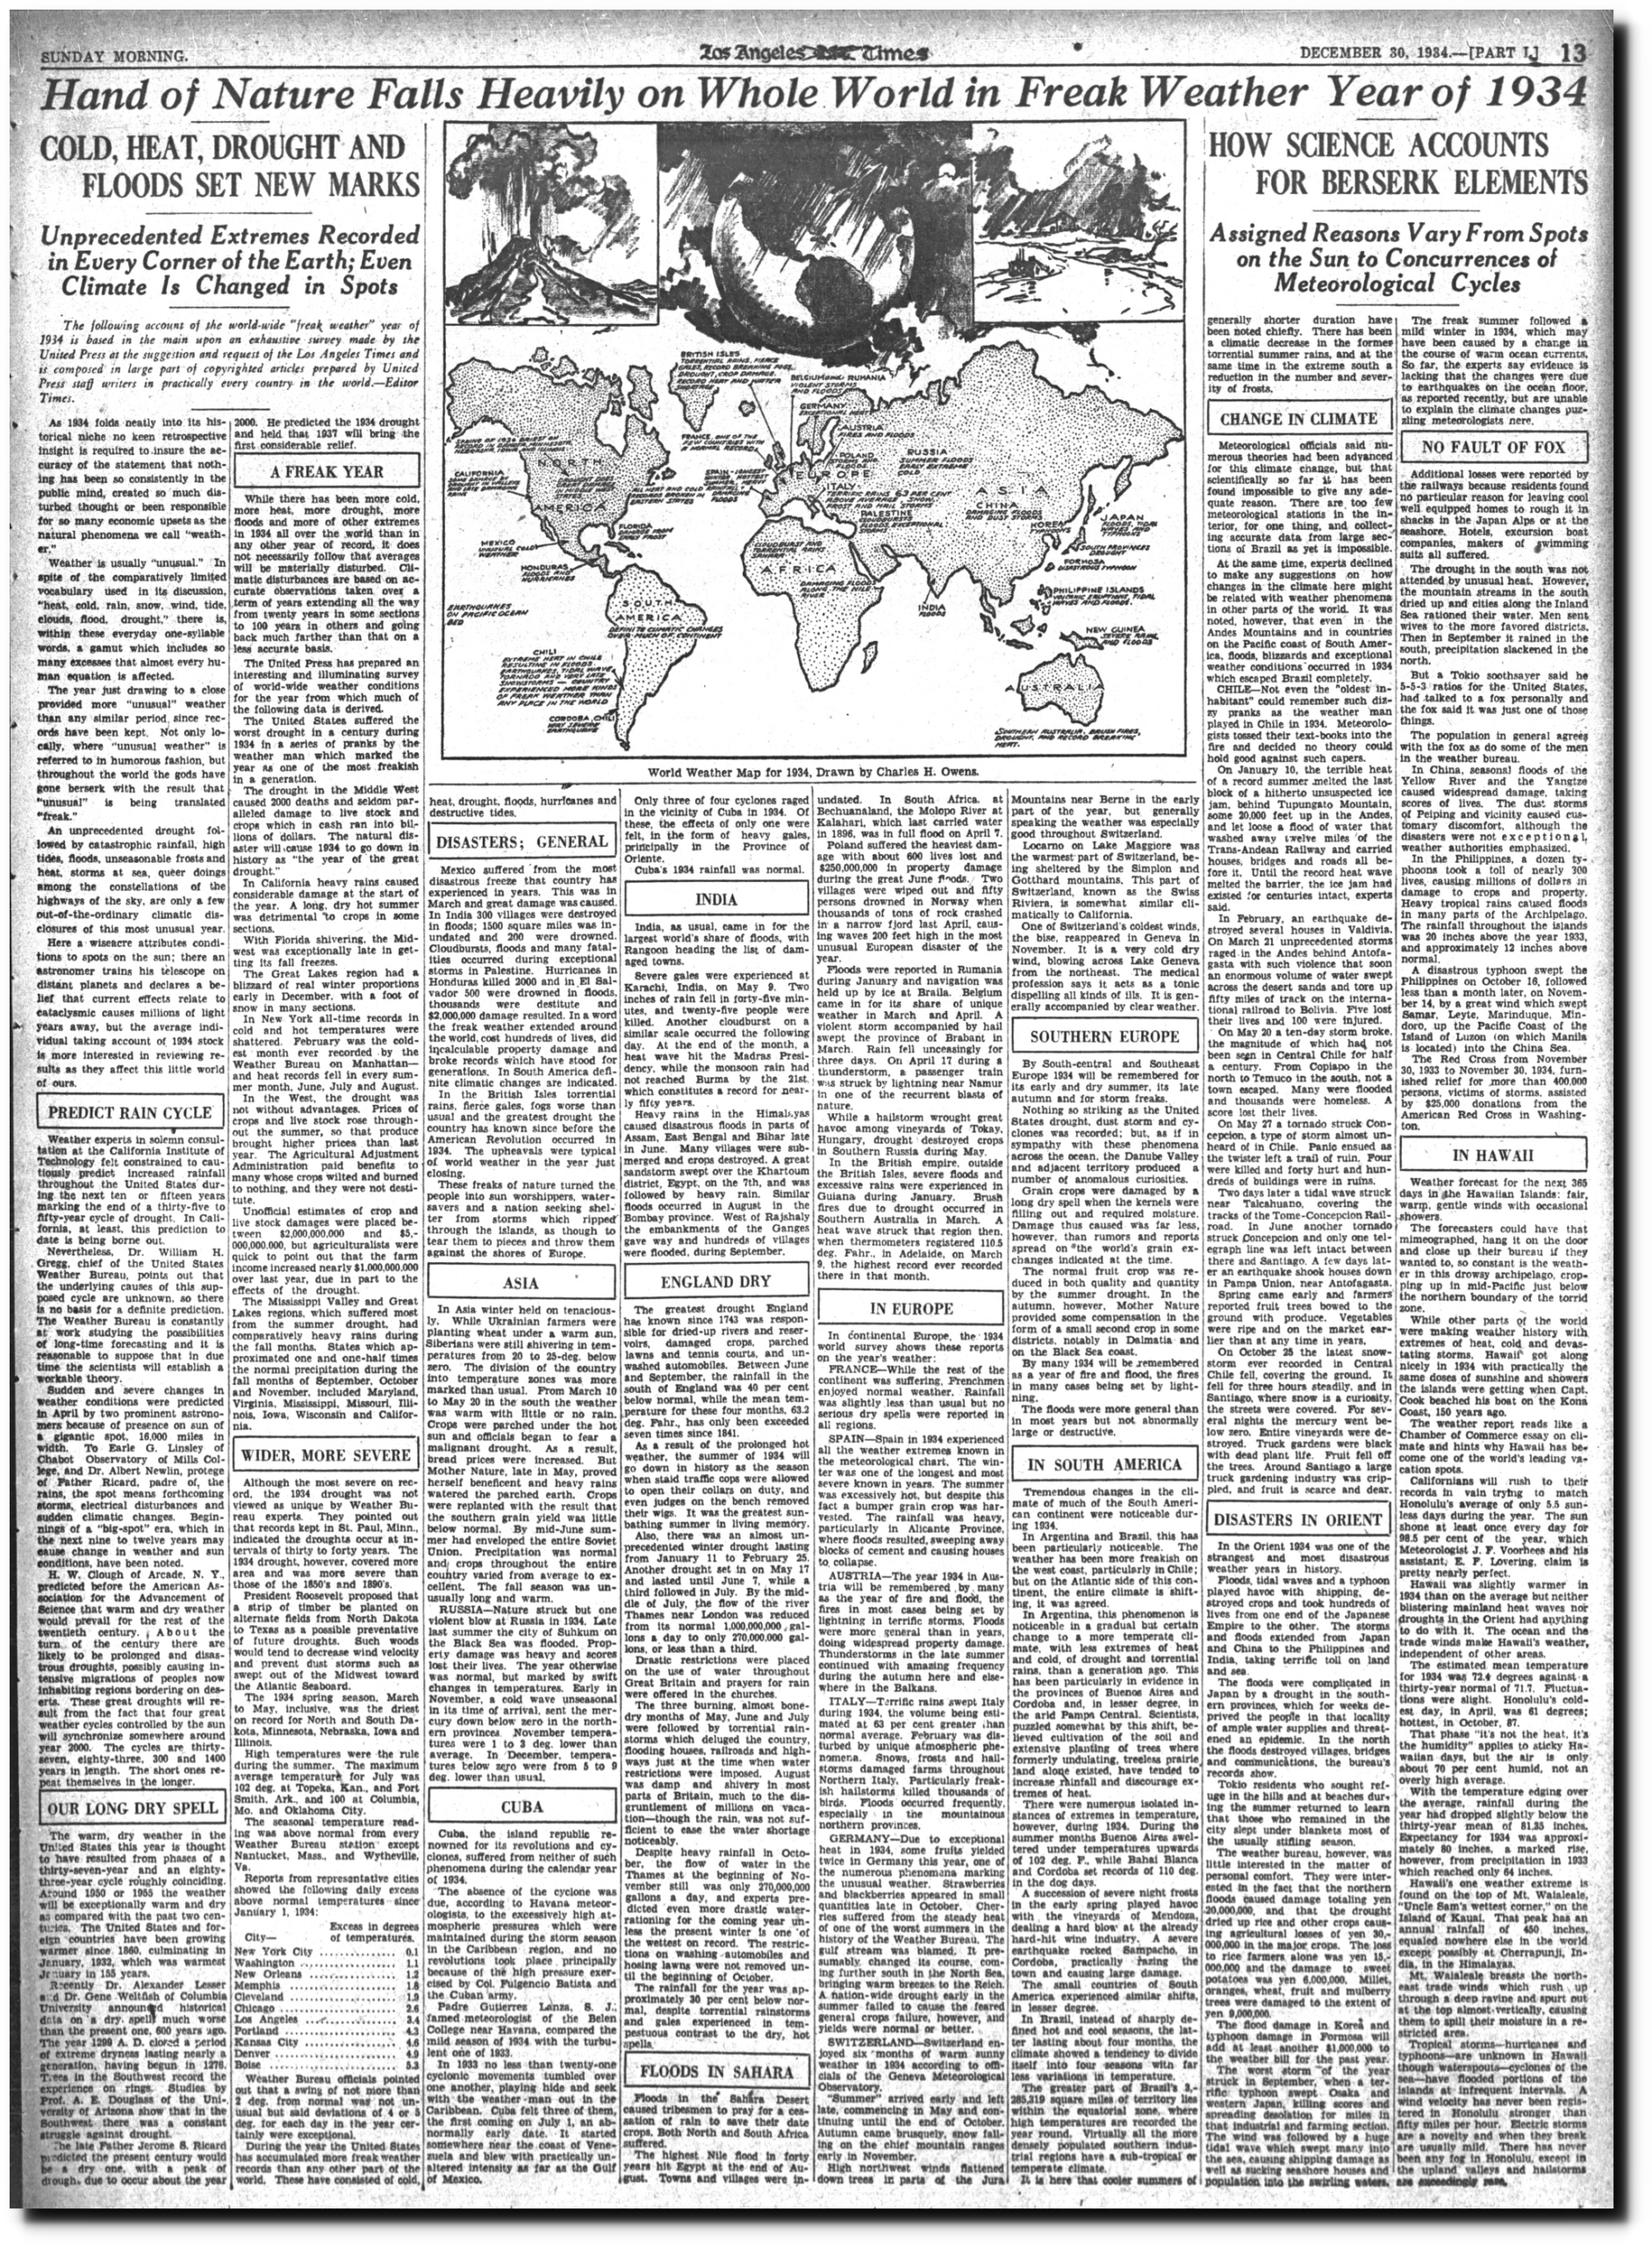
“Freak Weather Year Of 1934”
“COLD, HEAT, DROUGHT AND FLOODS SET NEW MARKS Unprecedented Extremes Recorded in Every Corner of the Earth”
Posted in Uncategorized
Leave a comment
1995 IPCC Report – Declining Hurricane Wind Speeds
The 1995 IPCC report showed that hurricane wind speeds were declining.
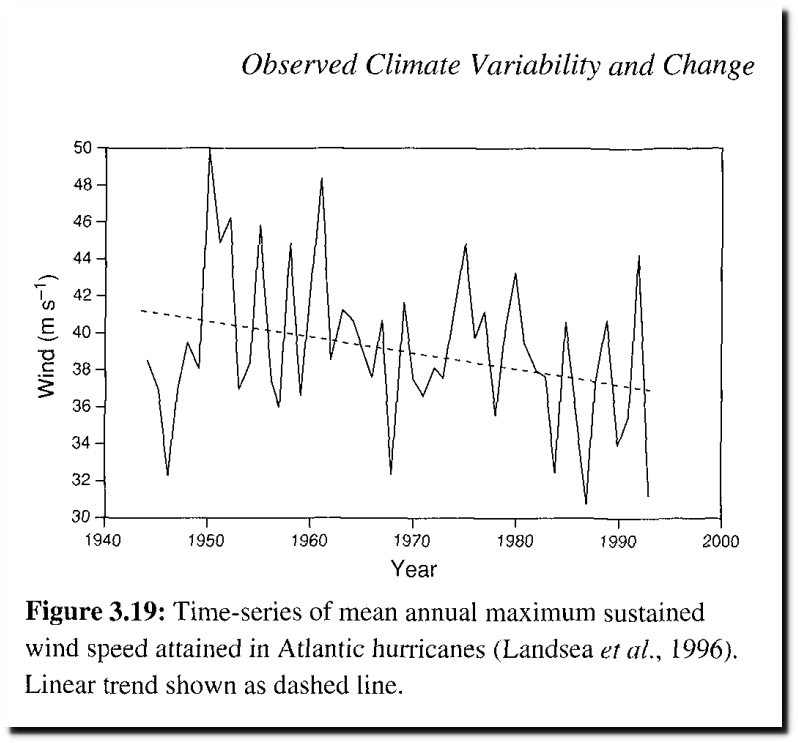
This contradicted claims made by Hansen and others in 1988.
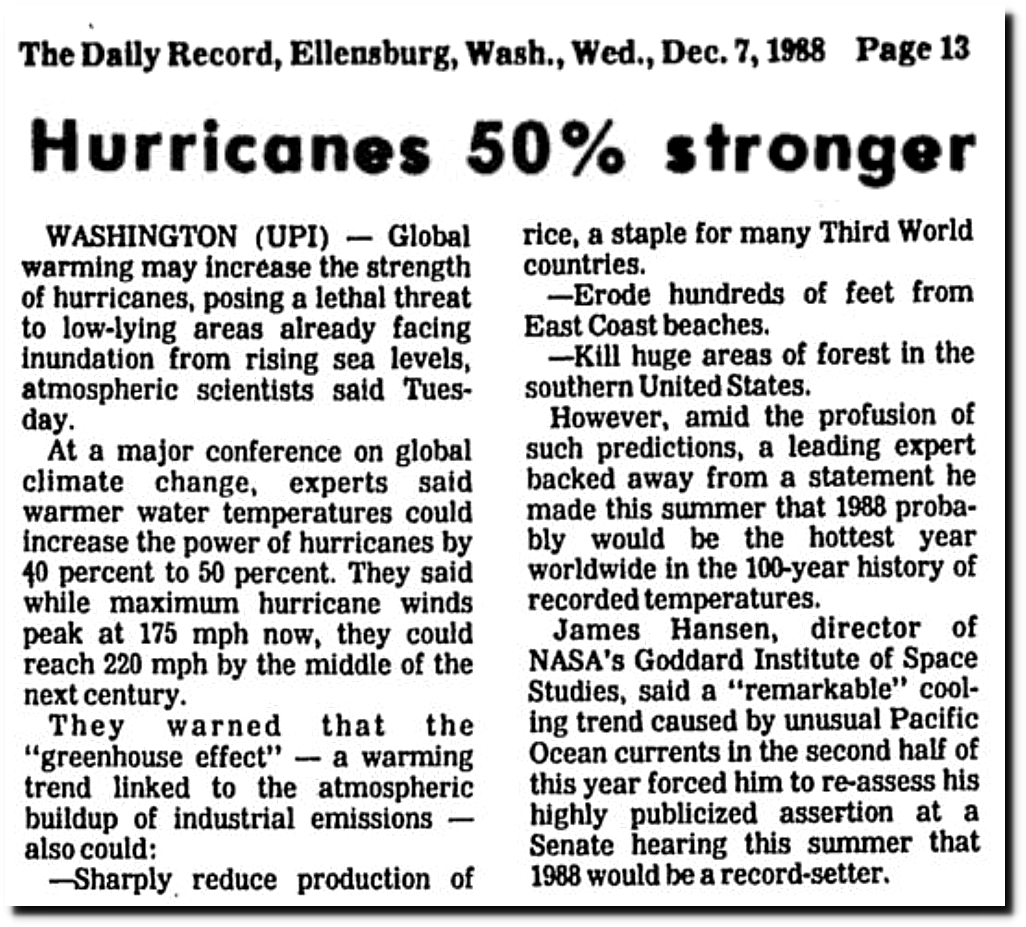
“Global warming may increase the strength of hurricanes, posing a lethal threat to low-lying areas already facing inundation from rising sea levels, atmospheric scientists said Tues-day. At a major conference on global climate change, experts said warmer water temperatures could increase the power of hurricanes by 40 percent to 50 percent. They said while maximum hurricane winds peak at 175 mph now, they could reach 220 mph by the middle of the next century.”
Ellensburg Daily Record – Google News Archive Search
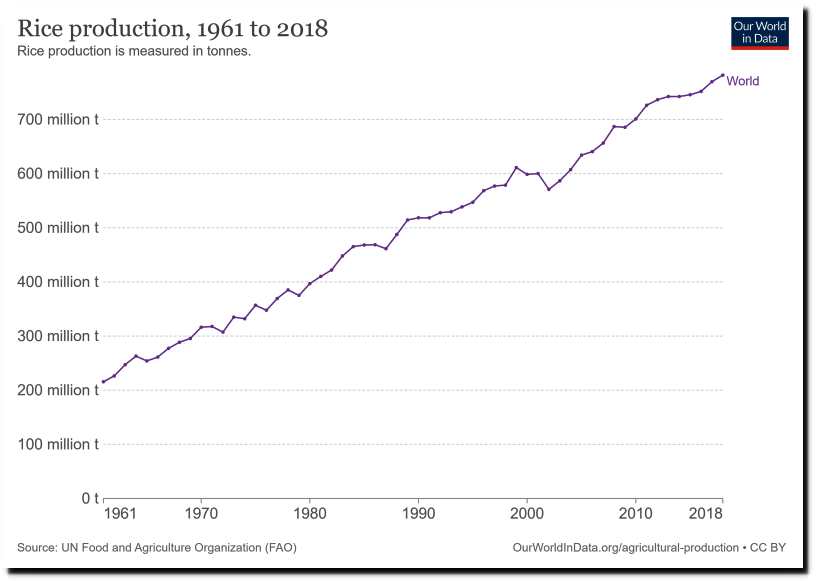
“They warned that the “greenhouse effect” — a warming trend linked to the atmospheric buildup of industrial emissions —also could: —Sharply reduce production of rice, a staple for many Third World countries.”
Posted in Uncategorized
Leave a comment
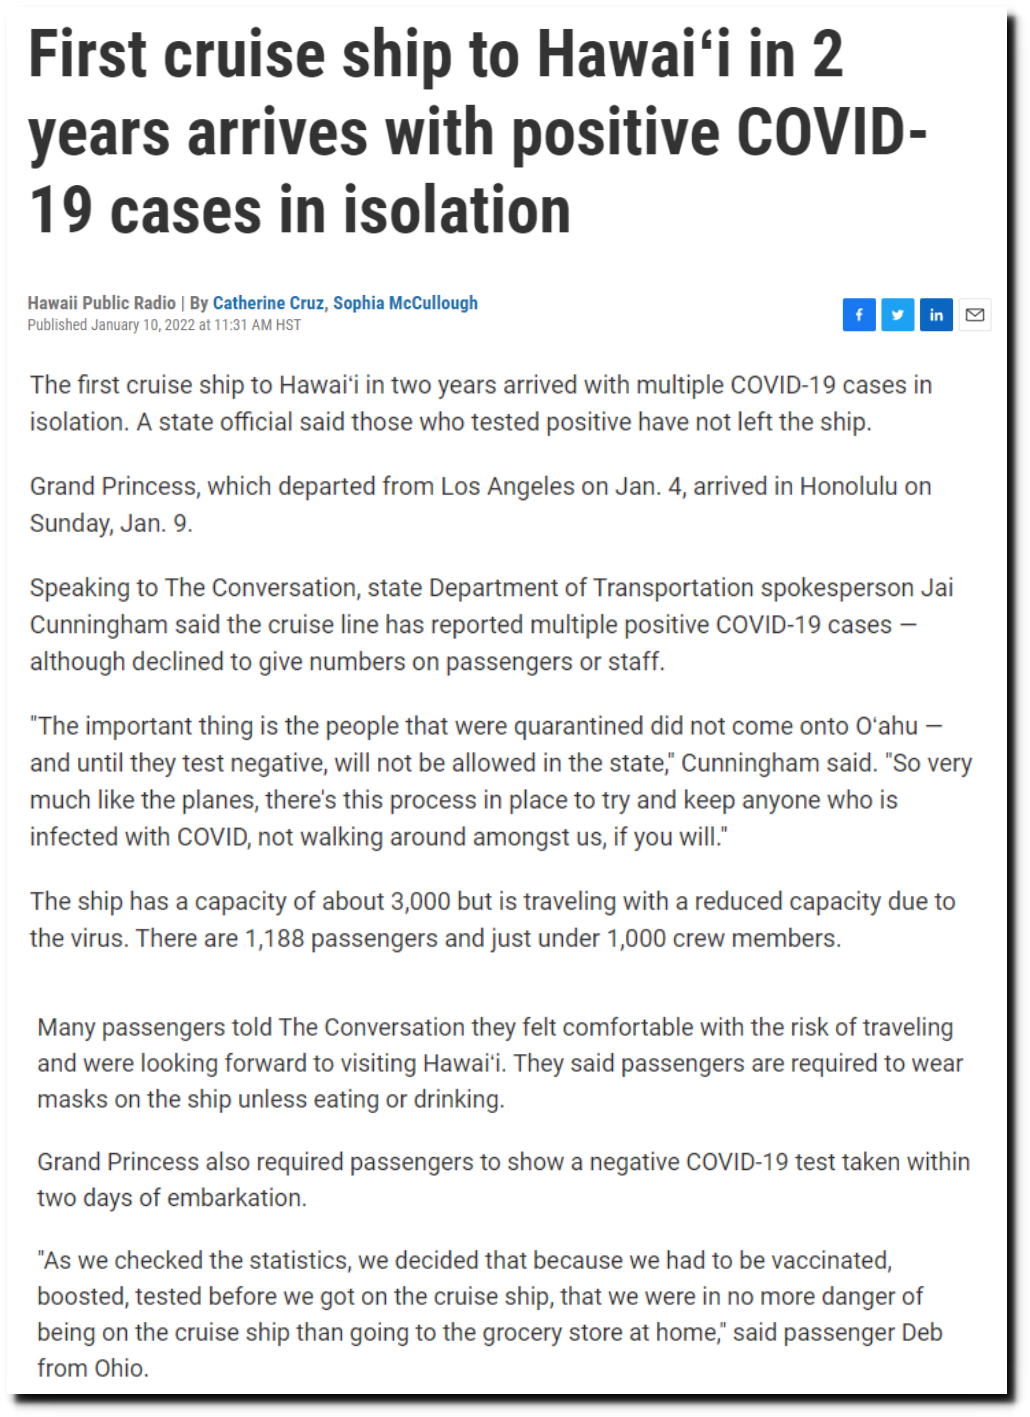
Fully Masked, Vaxxed And Infected
“The first cruise ship to Hawaii in two years arrived with multiple COVID-19 cases in isolation. …… The ship has a capacity of about 3,000 but is traveling with a reduced capacity due to the virus. There are 1,188 passengers and just under 1,000 crew members.”
Posted in Uncategorized
Leave a comment
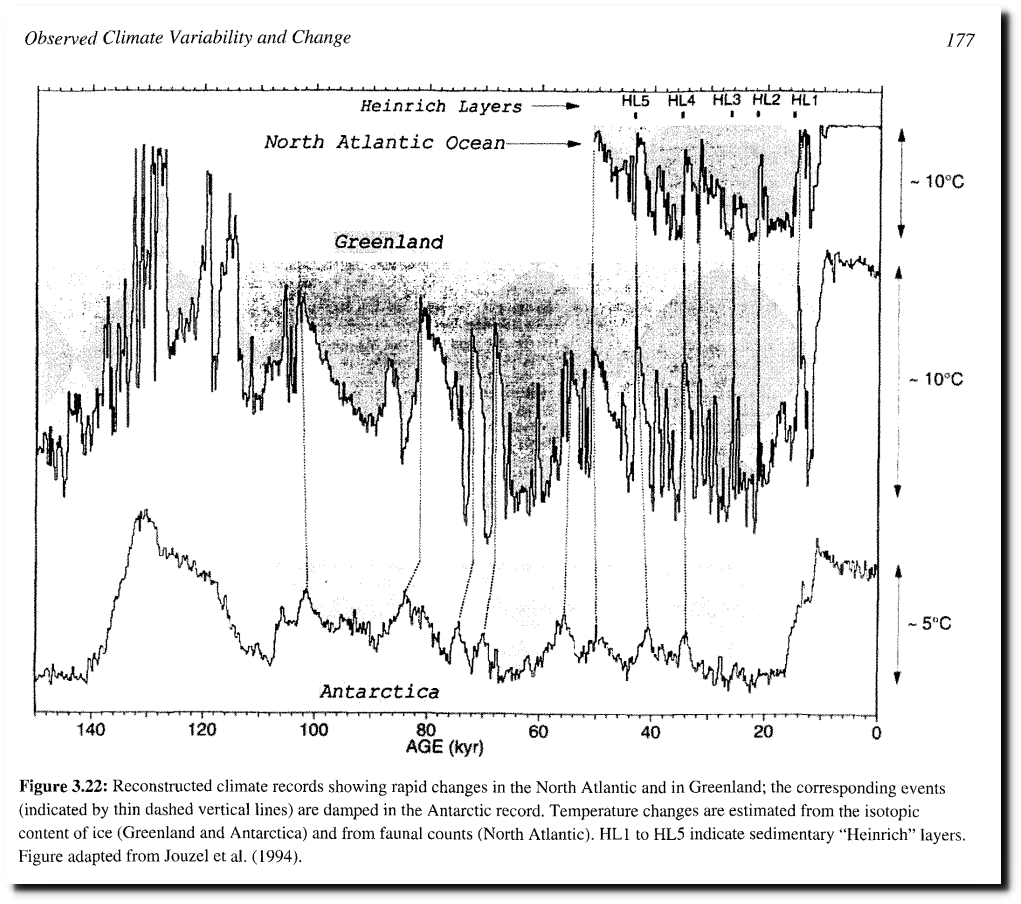
1995 IPCC Report : Poles Much Warmer 120,000 Years Ago
According to the 1995 IPCC report, Greenland and Antarctica were much warmer 120,000 years ago.
Posted in Uncategorized
Leave a comment
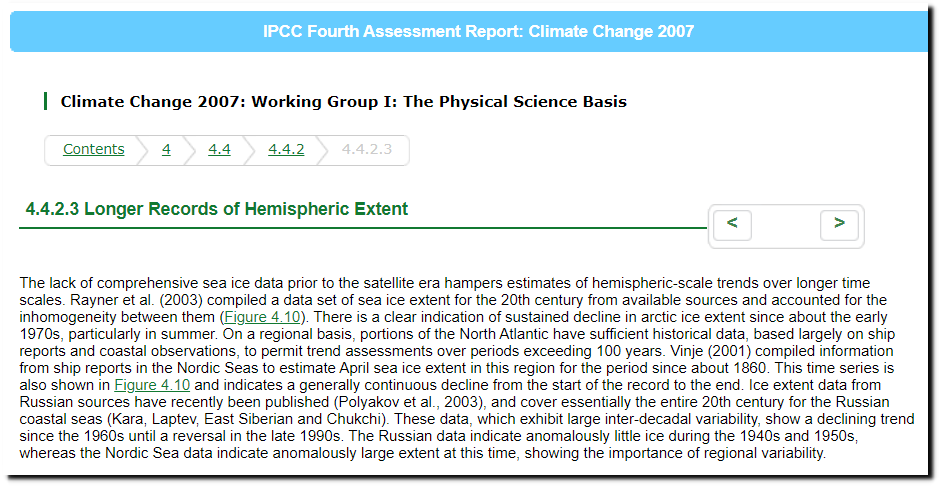
Disappearing Sea Ice At The IPCC
“The lack of comprehensive sea ice data prior to the satellite era hampers estimates of hemispheric-scale trends over longer time scales. Rayner et al. (2003) compiled a data set of sea ice extent for the 20th century from available sources and accounted for the inhomogeneity between them (Figure 4.10). There is a clear indication of sustained decline in arctic ice extent since about the early 1970s, particularly in summer ….. Continuous long-term data records for the Antarctic are lacking, as systematic information on the entire Southern Ocean ice cover became available only with the advent of routine microwave satellite reconnaissance in the early 1970s.”
- IPCC 2007
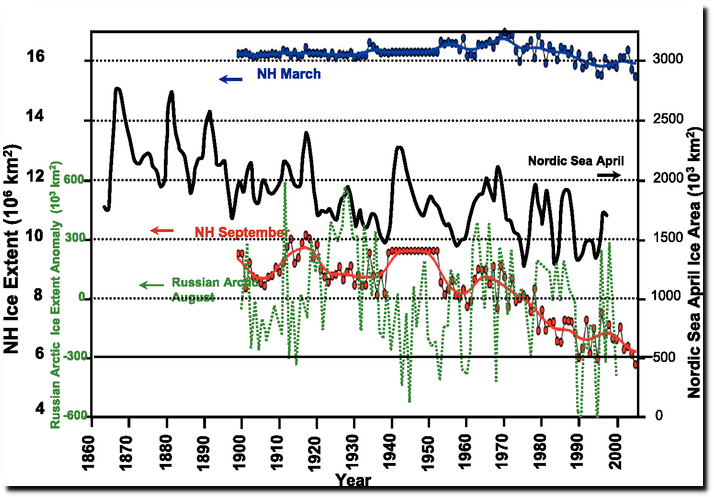
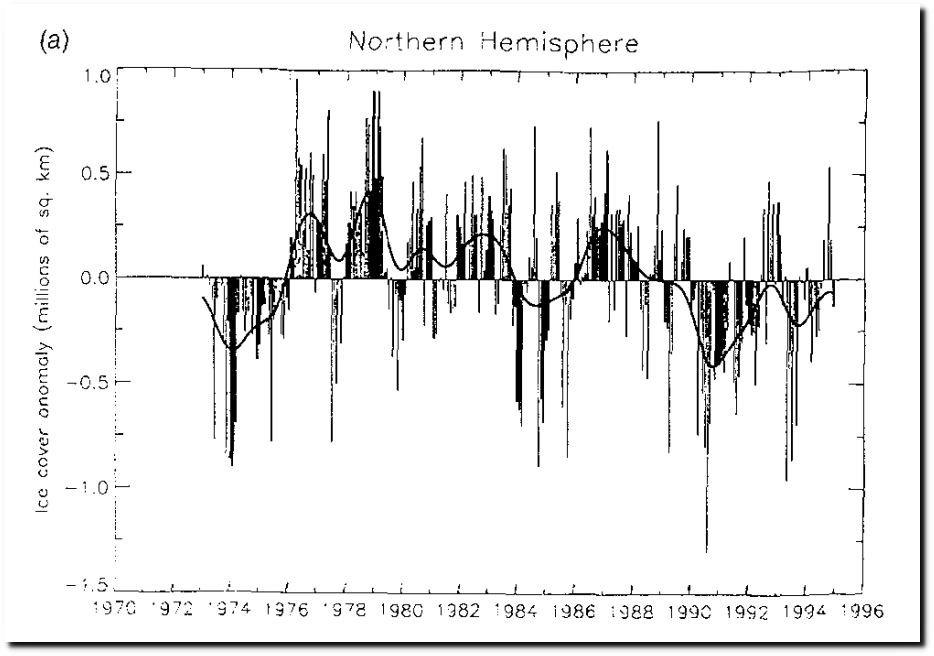
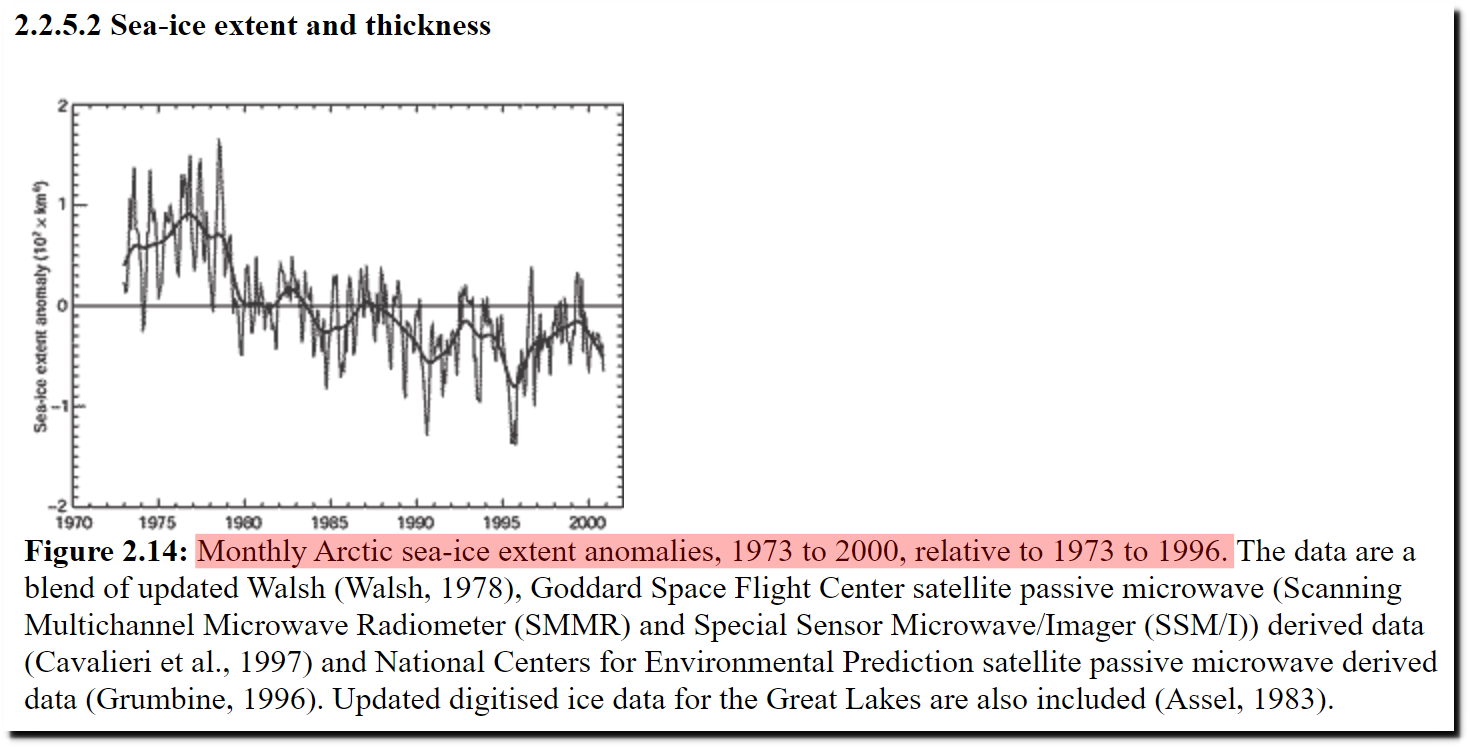
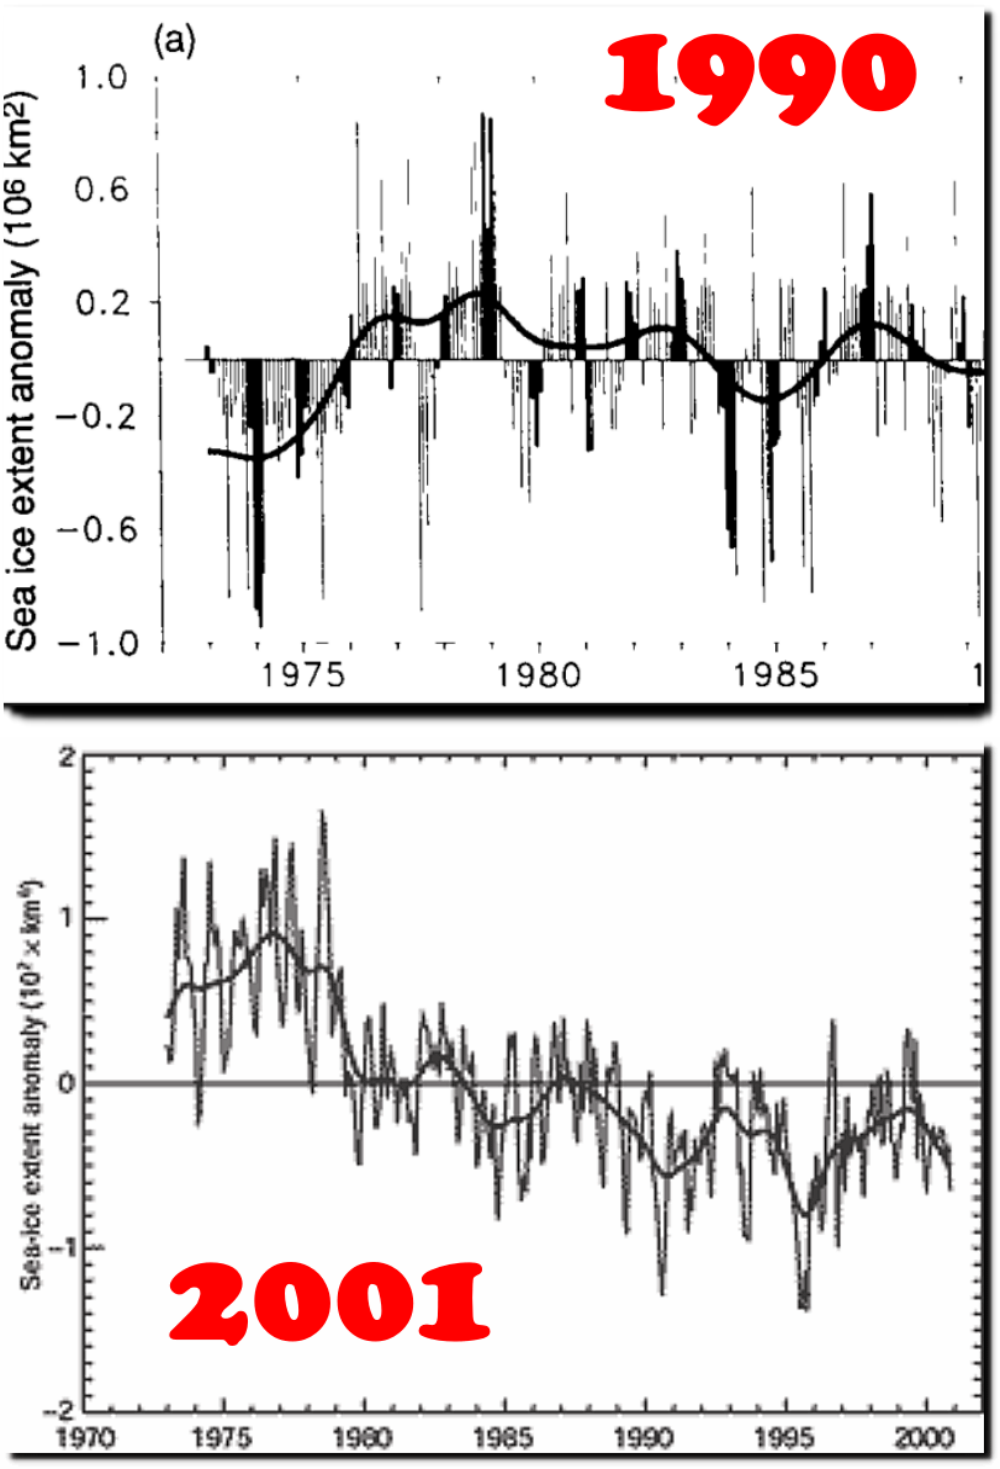
Between 1990 and 2001, the IPCC rewrote the Arctic sea ice satellite record, and changed a trend of ice increasing to ice decreasing.
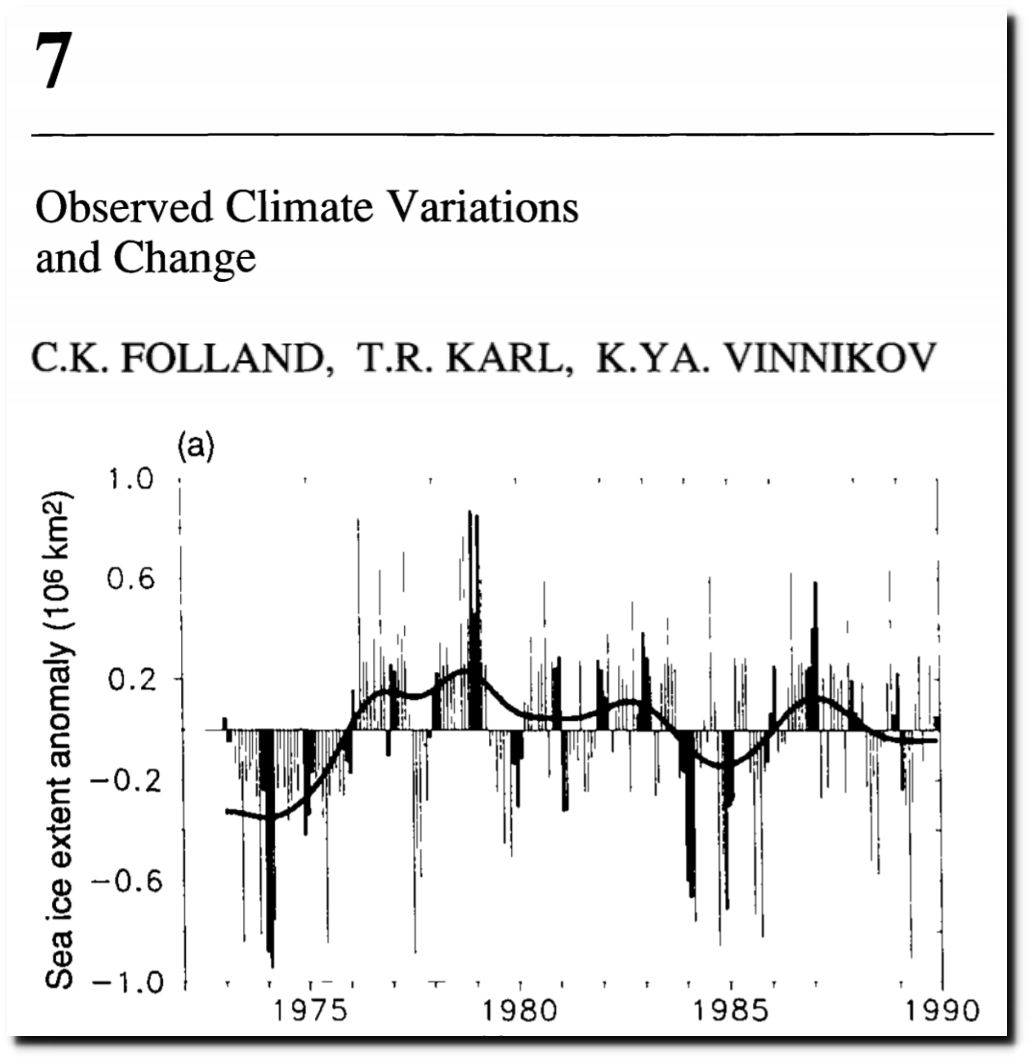
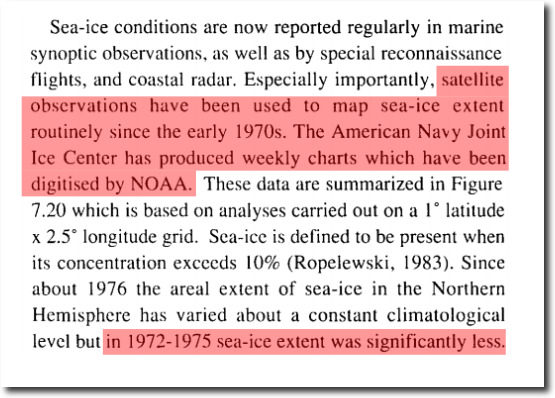
“The American Navy Joint Ice Center has produced weekly charts which have been digitised by NOAA ….. Since about 1976 the areal extent of sea-ice in the Northern Hemisphere has varied about a constant climatological level but in 1972-1975 sea-ice extent was significantly less.
1995 IPCC Report
2001 IPCC Report
https://archive.ipcc.ch/ipccreports/tar/wg1/062.htm
In the 1985 DOE Report ice increased from the 1950s to the 1970s.
 Projecting the climatic effects of increasing carbon dioxide
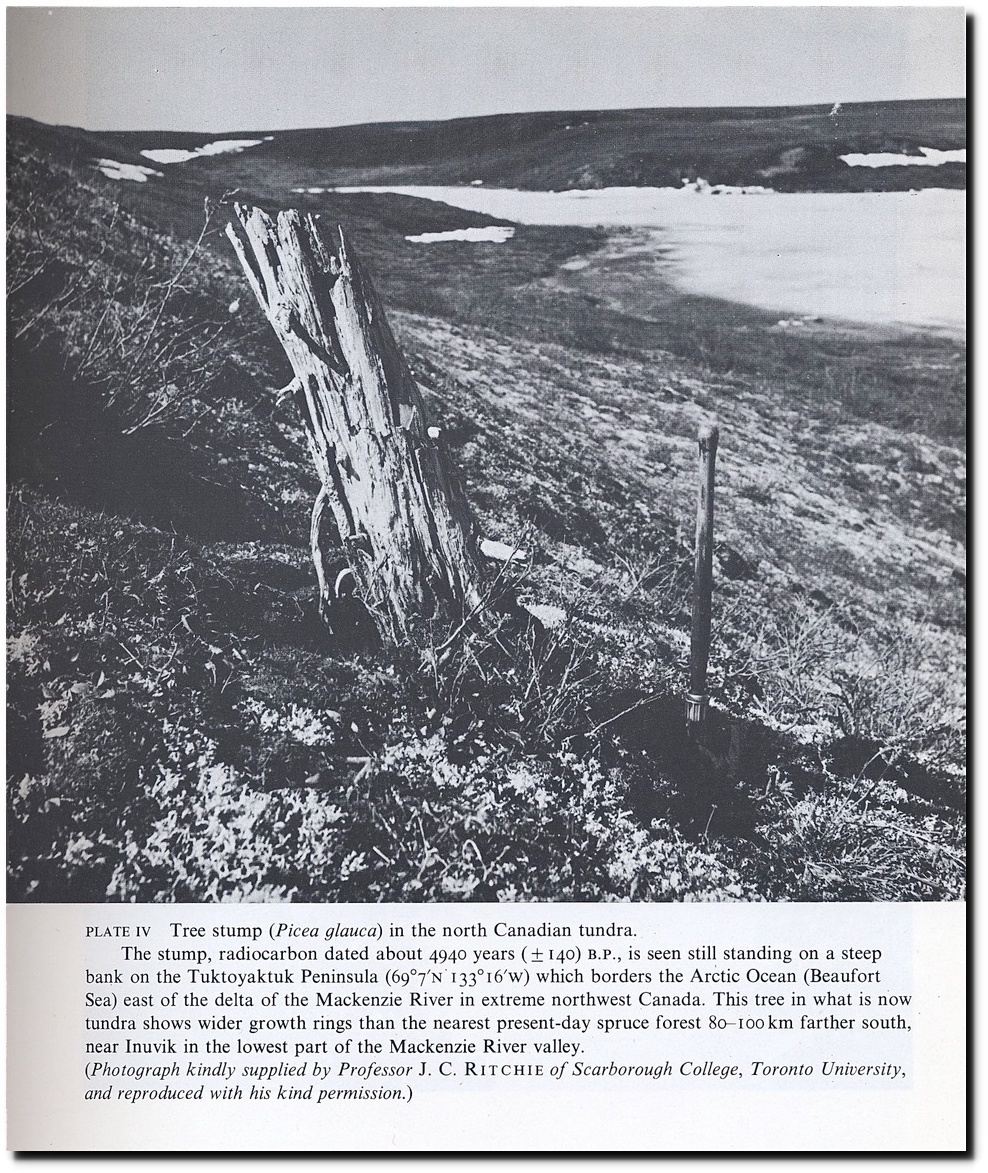
When Stonehenge was built, there was less ice in the Arctic and trees grew all the way to the edge of the Arctic Ocean.
Less Ice In Arctic Ocean 6000-7000 Years Ago — ScienceDaily
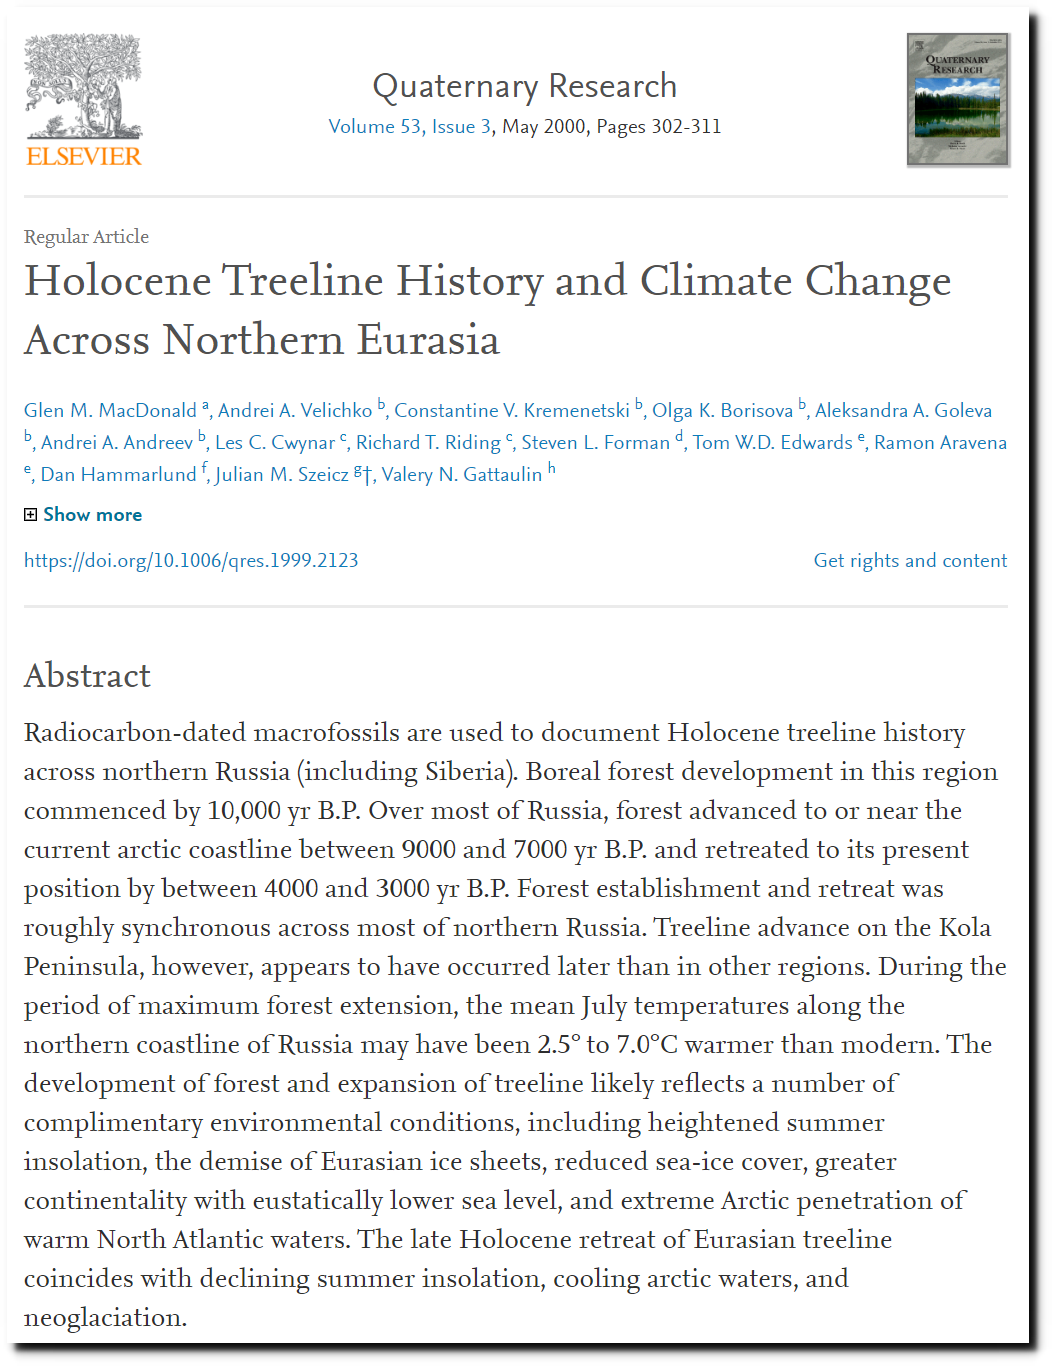
Holocene Treeline History and Climate Change Across Northern Eurasia – ScienceDirect
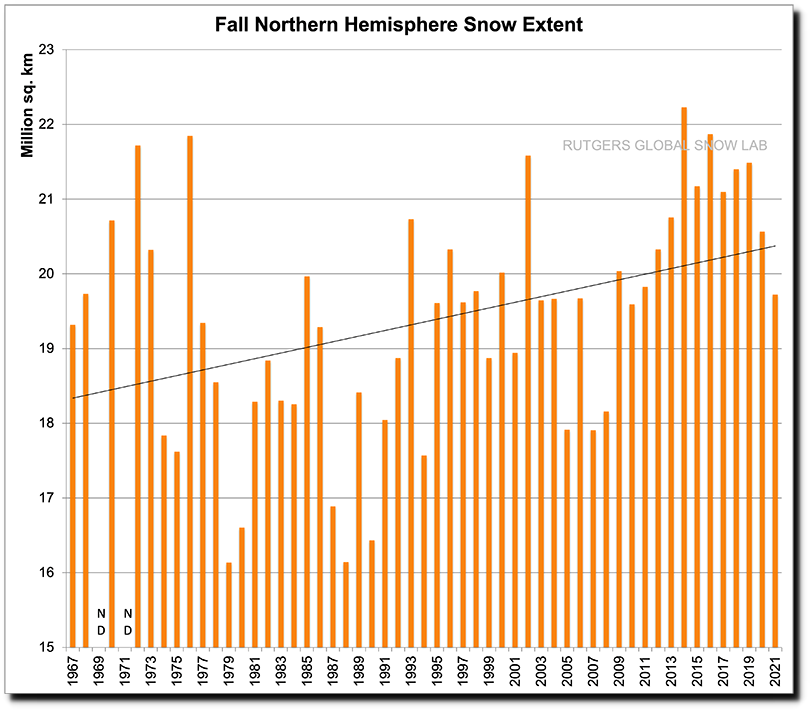
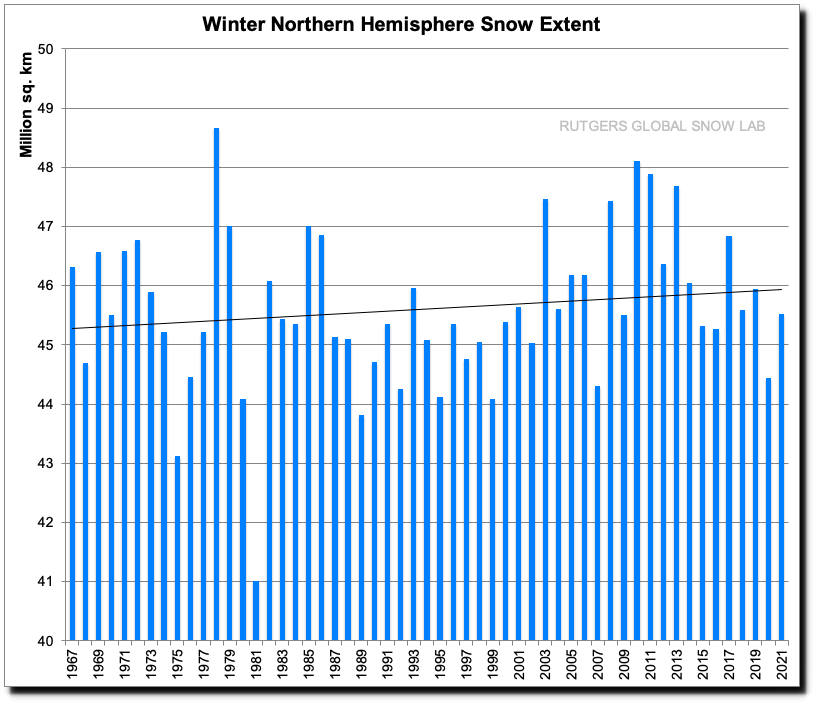
The current IPCC report says snow cover is declining due to human influence.
“Over recent decades, widespread loss of snow and ice has been observed, and several elements of the cryosphere are now in states unseen in centuries (high confidence). Human influence was very likely the main driver of observed reductions in Arctic sea ice since the late 1970s”
Posted in Uncategorized
Leave a comment
“Medical Misinformation” From The Press And Government
Over and over again last year the press bragged about how Israel had defeated COVID-19 with vaccines.

Now they say 40% of the population will become infected.


Bennett: 2-4 million Israelis will test positive for COVID in current wave | The Times of Israel
Posted in Uncategorized
Leave a comment
New York Times – 900,000 Children Hospitalized
Supreme Court Justice Sotomayor claimed that 100,000 children are hospitalized with COVID-19.
“We have hospitals that are almost at full capacity with people severely ill on ventilators. We have over 100,000 children, which we’ve never had before, in serious condition, and many on ventilators,”
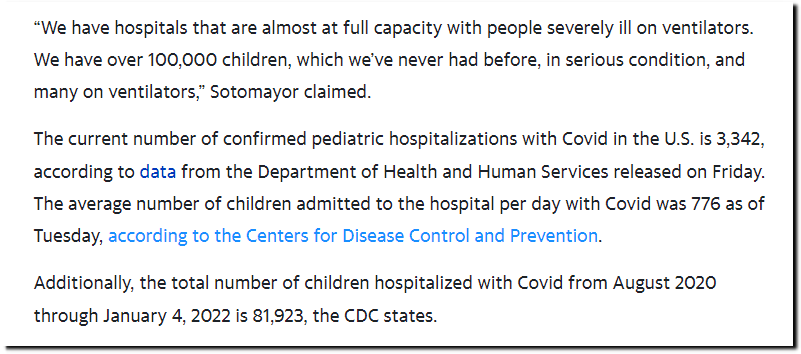
Justice Sotomayor Falsely Claims 100,000 Children in ‘Serious Condition’ from Covid
So where did she get this misinformation? She probably reads the New York Times.
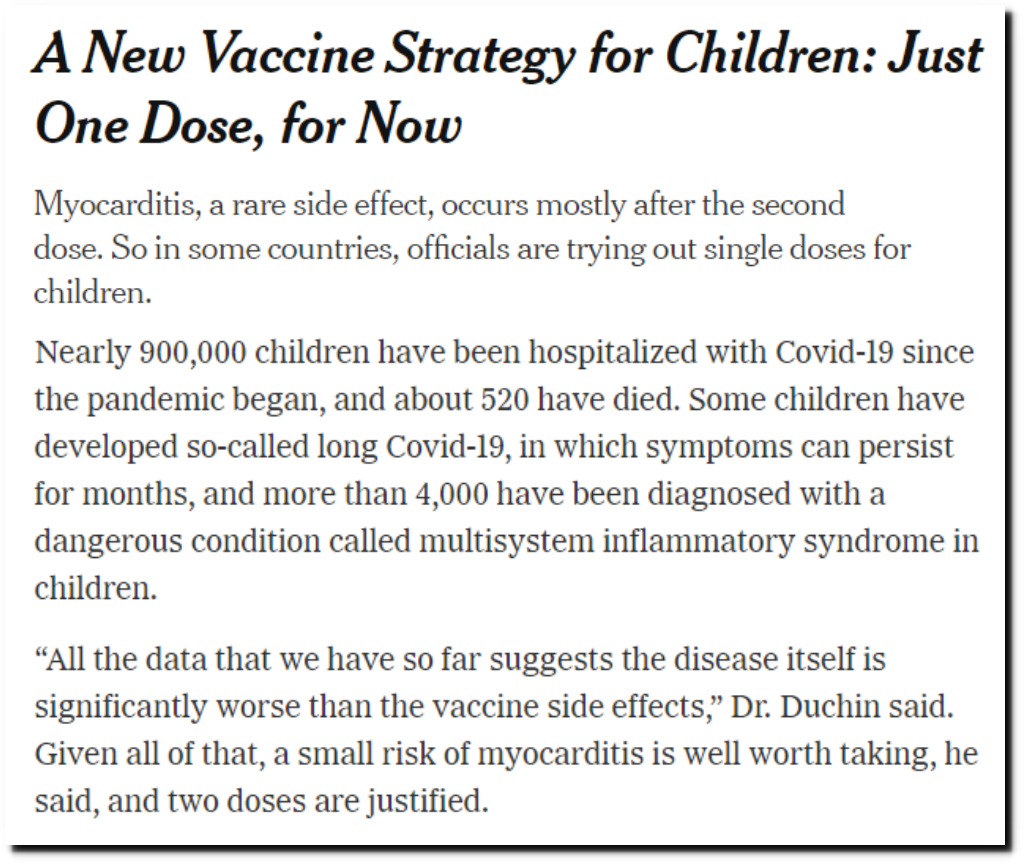
A New Vaccine Strategy for Children: Just One Dose, for Now – The New York Times
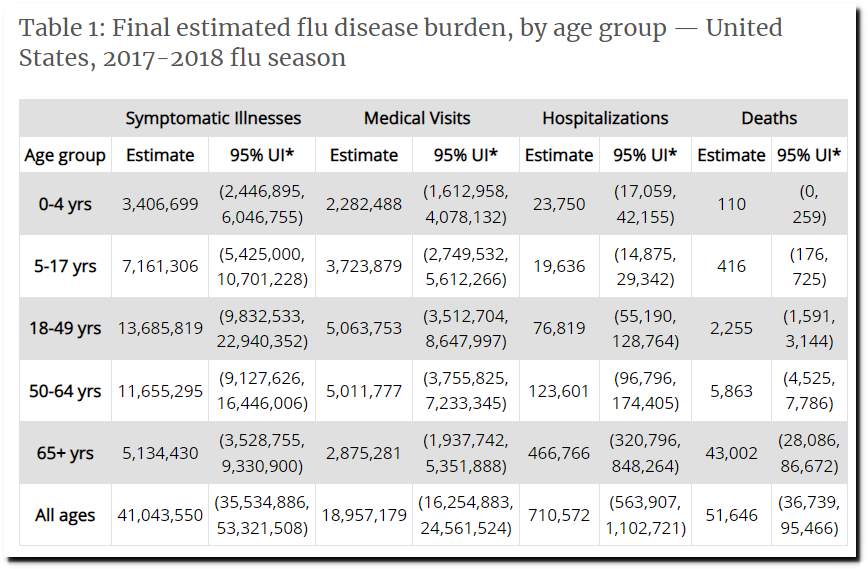
The number of children hospitalized with COVID-19 and the number of deaths is comparable with a typical flu season.
Posted in Uncategorized
Leave a comment
Arctic Reporting Report Card
Arctic sea ice extent is the highest in 18 years.
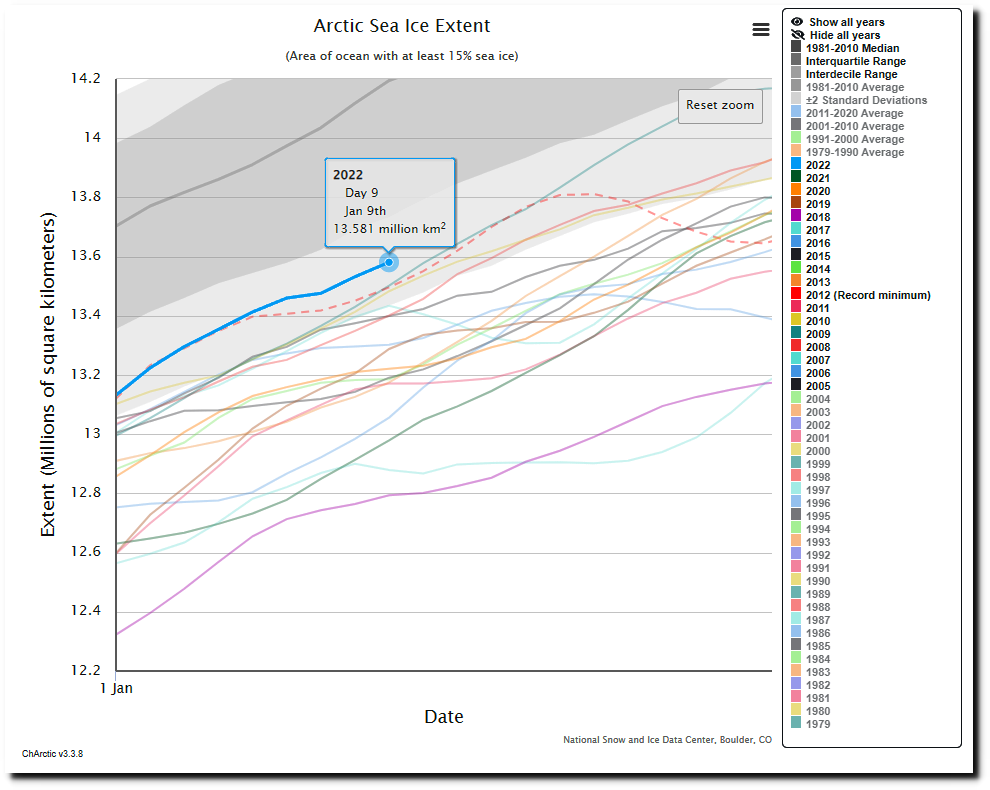
Charctic Interactive Sea Ice Graph | Arctic Sea Ice News and Analysis
Extent is nearly identical to 1991.

This is what a Google search for “Arctic sea ice” turns up.
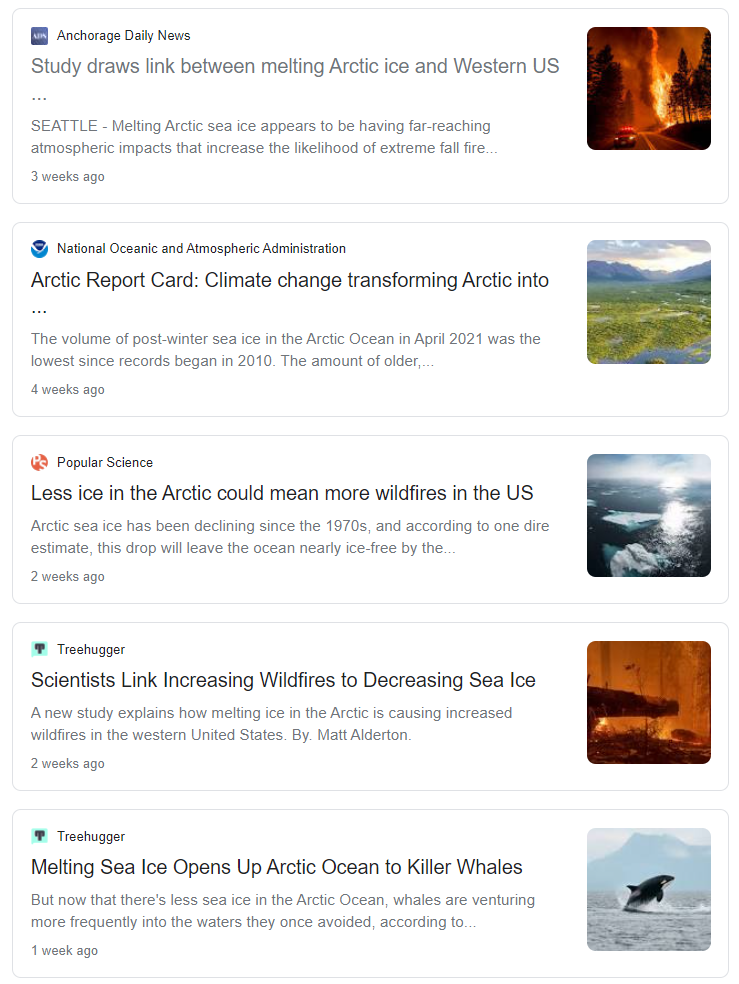
Burn acreage is down 80% since the 1930s.
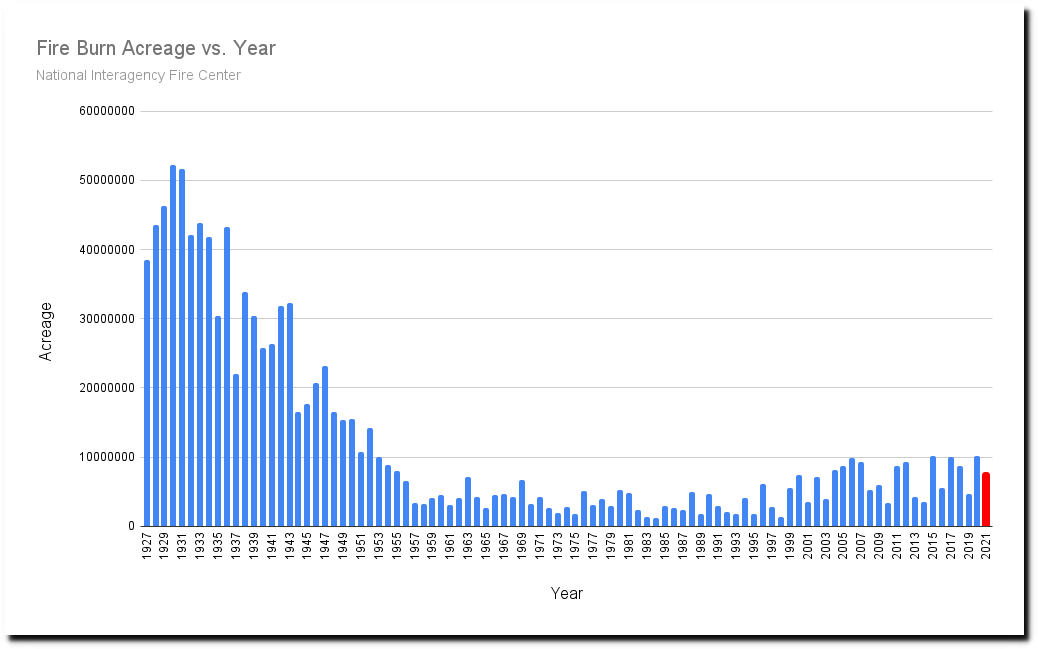
National Interagency Fire Center
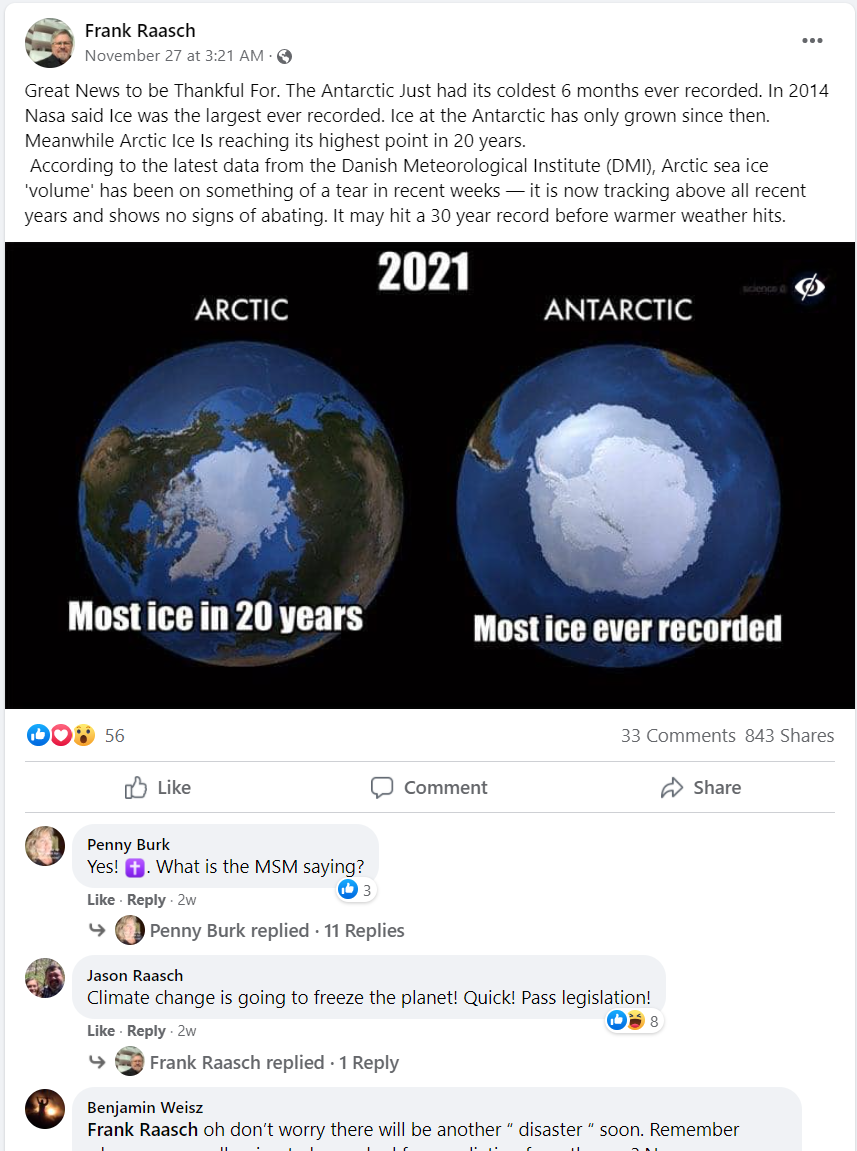
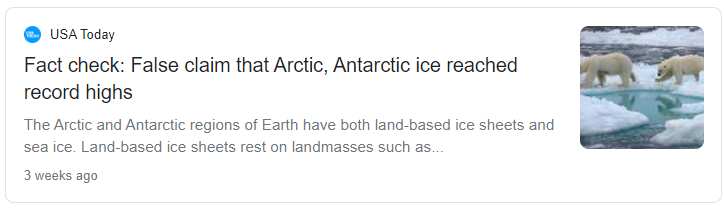
Here is another trick used by the press. Instead of fact checking their own false claim that sea ice is melting, they “fact check” another claim by mischaracterizing it.
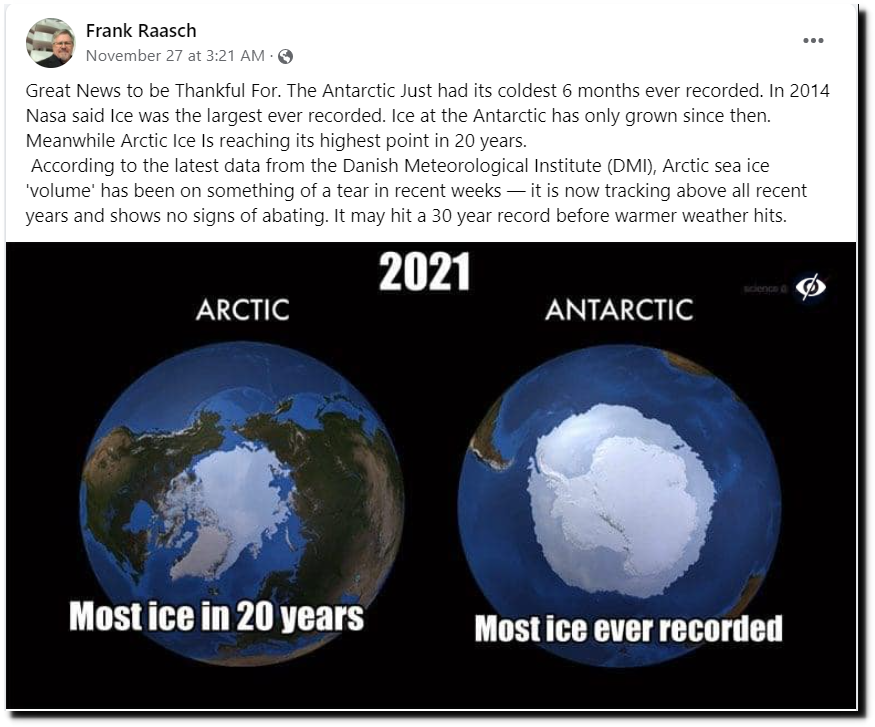
Screenshot_12_13_21_Facebook_Frank_Raash_Nov_27_post.png (857×1151)
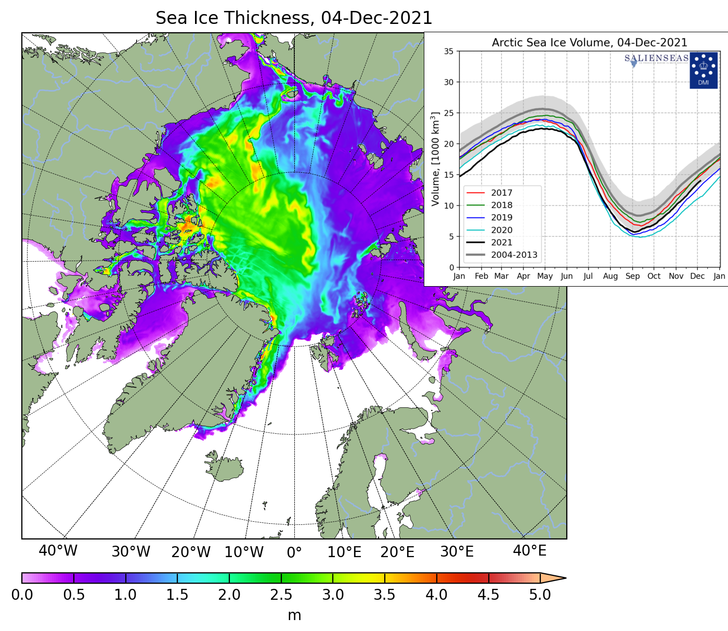
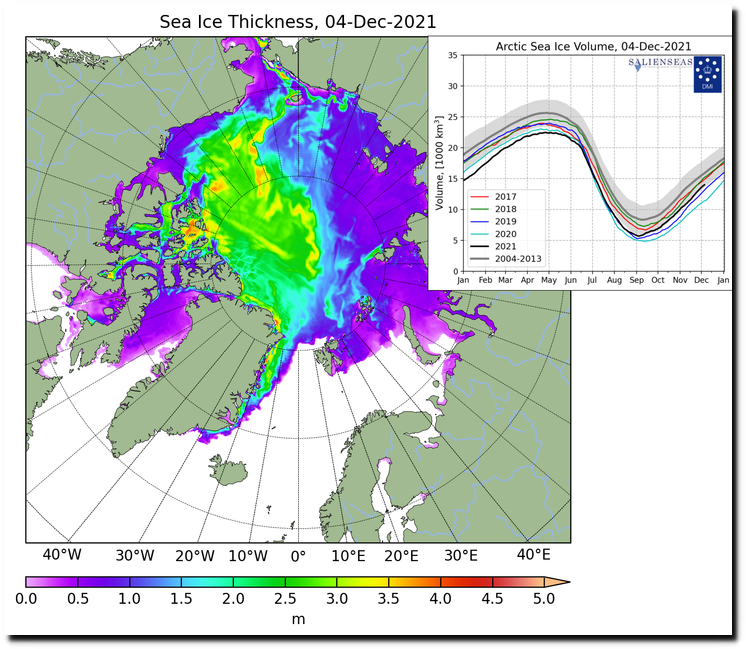
He was correct about Arctic sea ice volume.
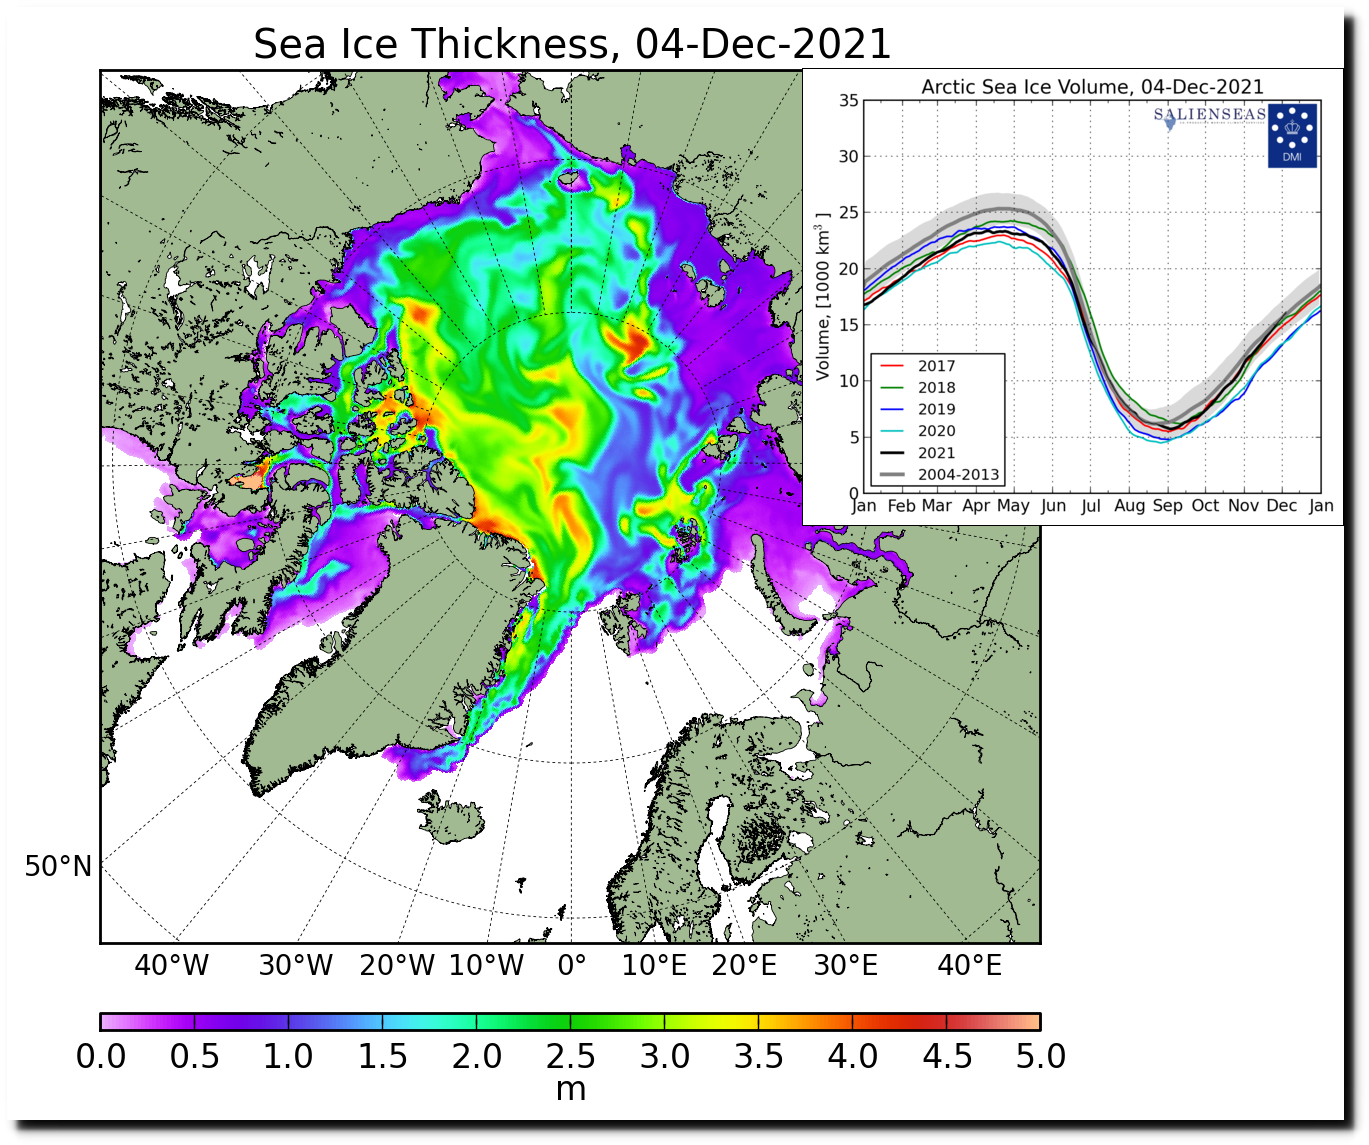
But as soon as volume got above the 2004-2013 average, DMI quite predictably altered the data.
Posted in Uncategorized
Leave a comment
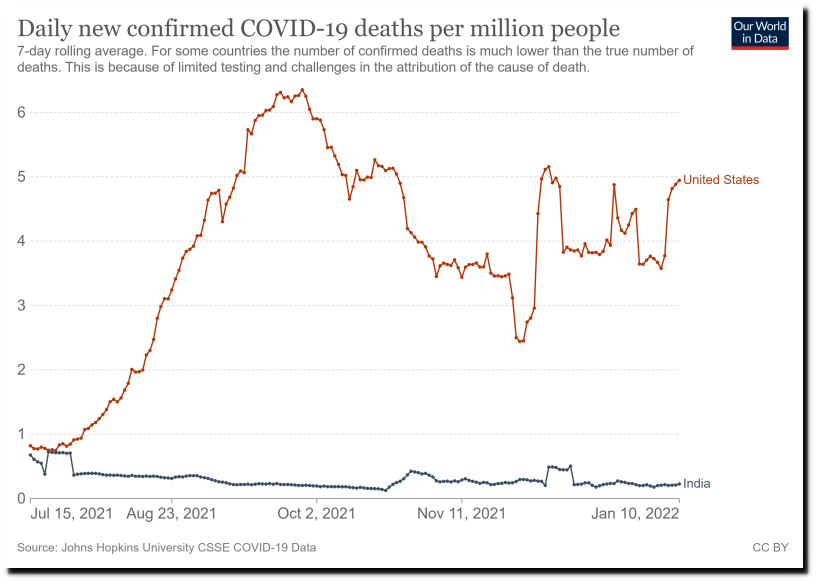
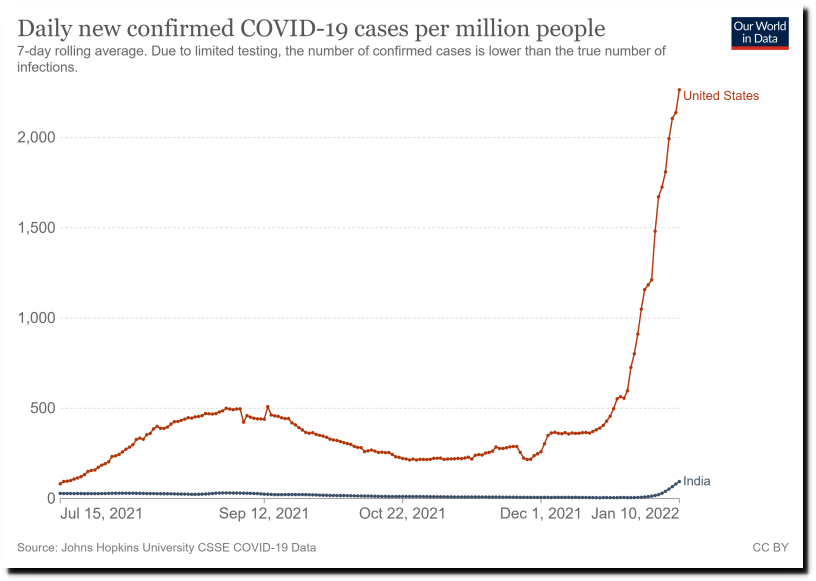
Study Shows COVID Vaccines Make Things Worse
“another independent analysis that is difficult to refute: we have been misled by the CDC, FDA, and NIH.”
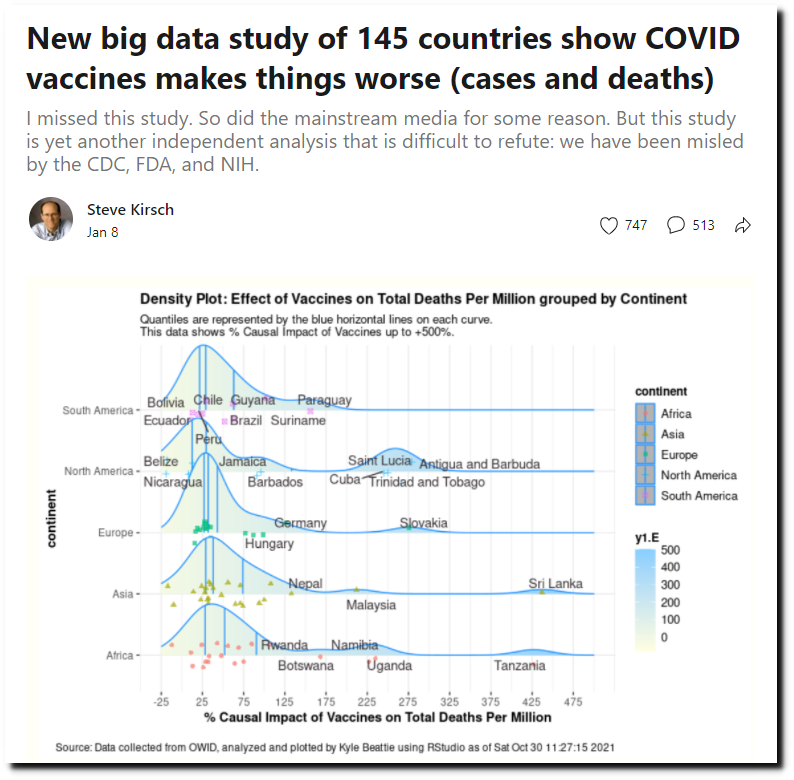
New big data study of 145 countries show COVID vaccines makes things worse (cases and deaths)
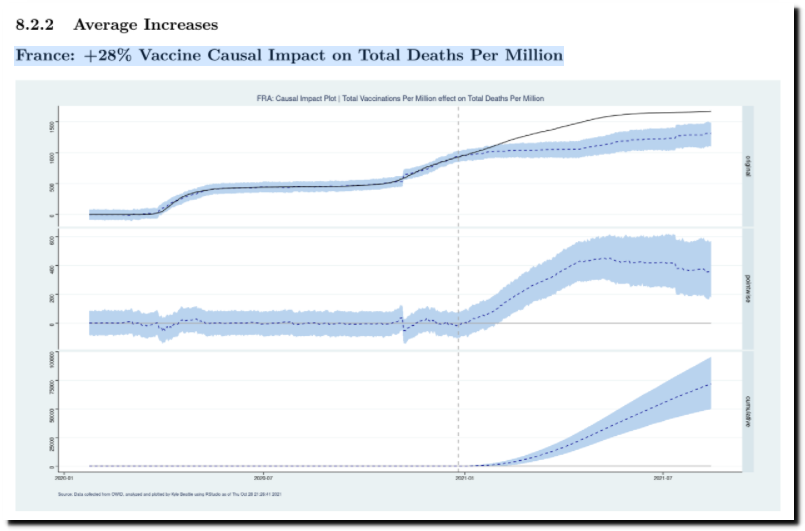
France: +28% Vaccine Causal Impact on Total Deaths Per Million
Posted in Uncategorized
Leave a comment