
Disrupting the Borg is expensive and time consuming!

Google Search
-
Recent Posts
- Analyzing The Western Water Crisis
- Gaslighting 1924
- “Why Do You Resist?”
- Climate Attribution Model
- Fact Checking NASA
- Fact Checking Grok
- Fact Checking The New York Times
- New Visitech Features
- Ice-Free Arctic By 2014
- Debt-Free US Treasury Forecast
- Analyzing Big City Crime (Part 2)
- Analyzing Big City Crime
- UK Migration Caused By Global Warming
- Climate Attribution In Greece
- “Brown: ’50 days to save world'”
- The Catastrophic Influence of Bovine Methane Emissions on Extraterrestrial Climate Patterns
- Posting On X
- Seventeen Years Of Fun
- The Importance Of Good Tools
- Temperature Shifts At Blue Hill, MA
- CO2²
- Time Of Observation Bias
- Climate Scamming For Profit
- Climate Scamming For Profit
- Back To The Future
March 2026 M T W T F S S 1 2 3 4 5 6 7 8 9 10 11 12 13 14 15 16 17 18 19 20 21 22 23 24 25 26 27 28 29 30 31 Recent Comments
- Bob G on Analyzing The Western Water Crisis
- arn on Analyzing The Western Water Crisis
- Bob G on Analyzing The Western Water Crisis
- Bob G on Analyzing The Western Water Crisis
- Bob G on Analyzing The Western Water Crisis
- Hank Phillips on Analyzing The Western Water Crisis
- Hank Phillips on Analyzing The Western Water Crisis
- Hank Phillips on Analyzing The Western Water Crisis
- Hank Phillips on Analyzing The Western Water Crisis
- Bob G on Analyzing The Western Water Crisis
Rewriting America’s History
“He who controls the past, controls the future; and he who controls the present, controls the past.”
– George Orwell “1984”
In 1998, NASA showed 1934 as the hottest year on record in the US, and declining temperatures for the rest of the century. They have since rewritten the data to eliminate the post 1930s cooling. 1998 used to be one degree Fahrenheit cooler than 1934, and now it is warmer. Note that 1998 version is in Fahrenheit and the 2019 version is in Celsius, thus the different numbers along the Y-Axis.
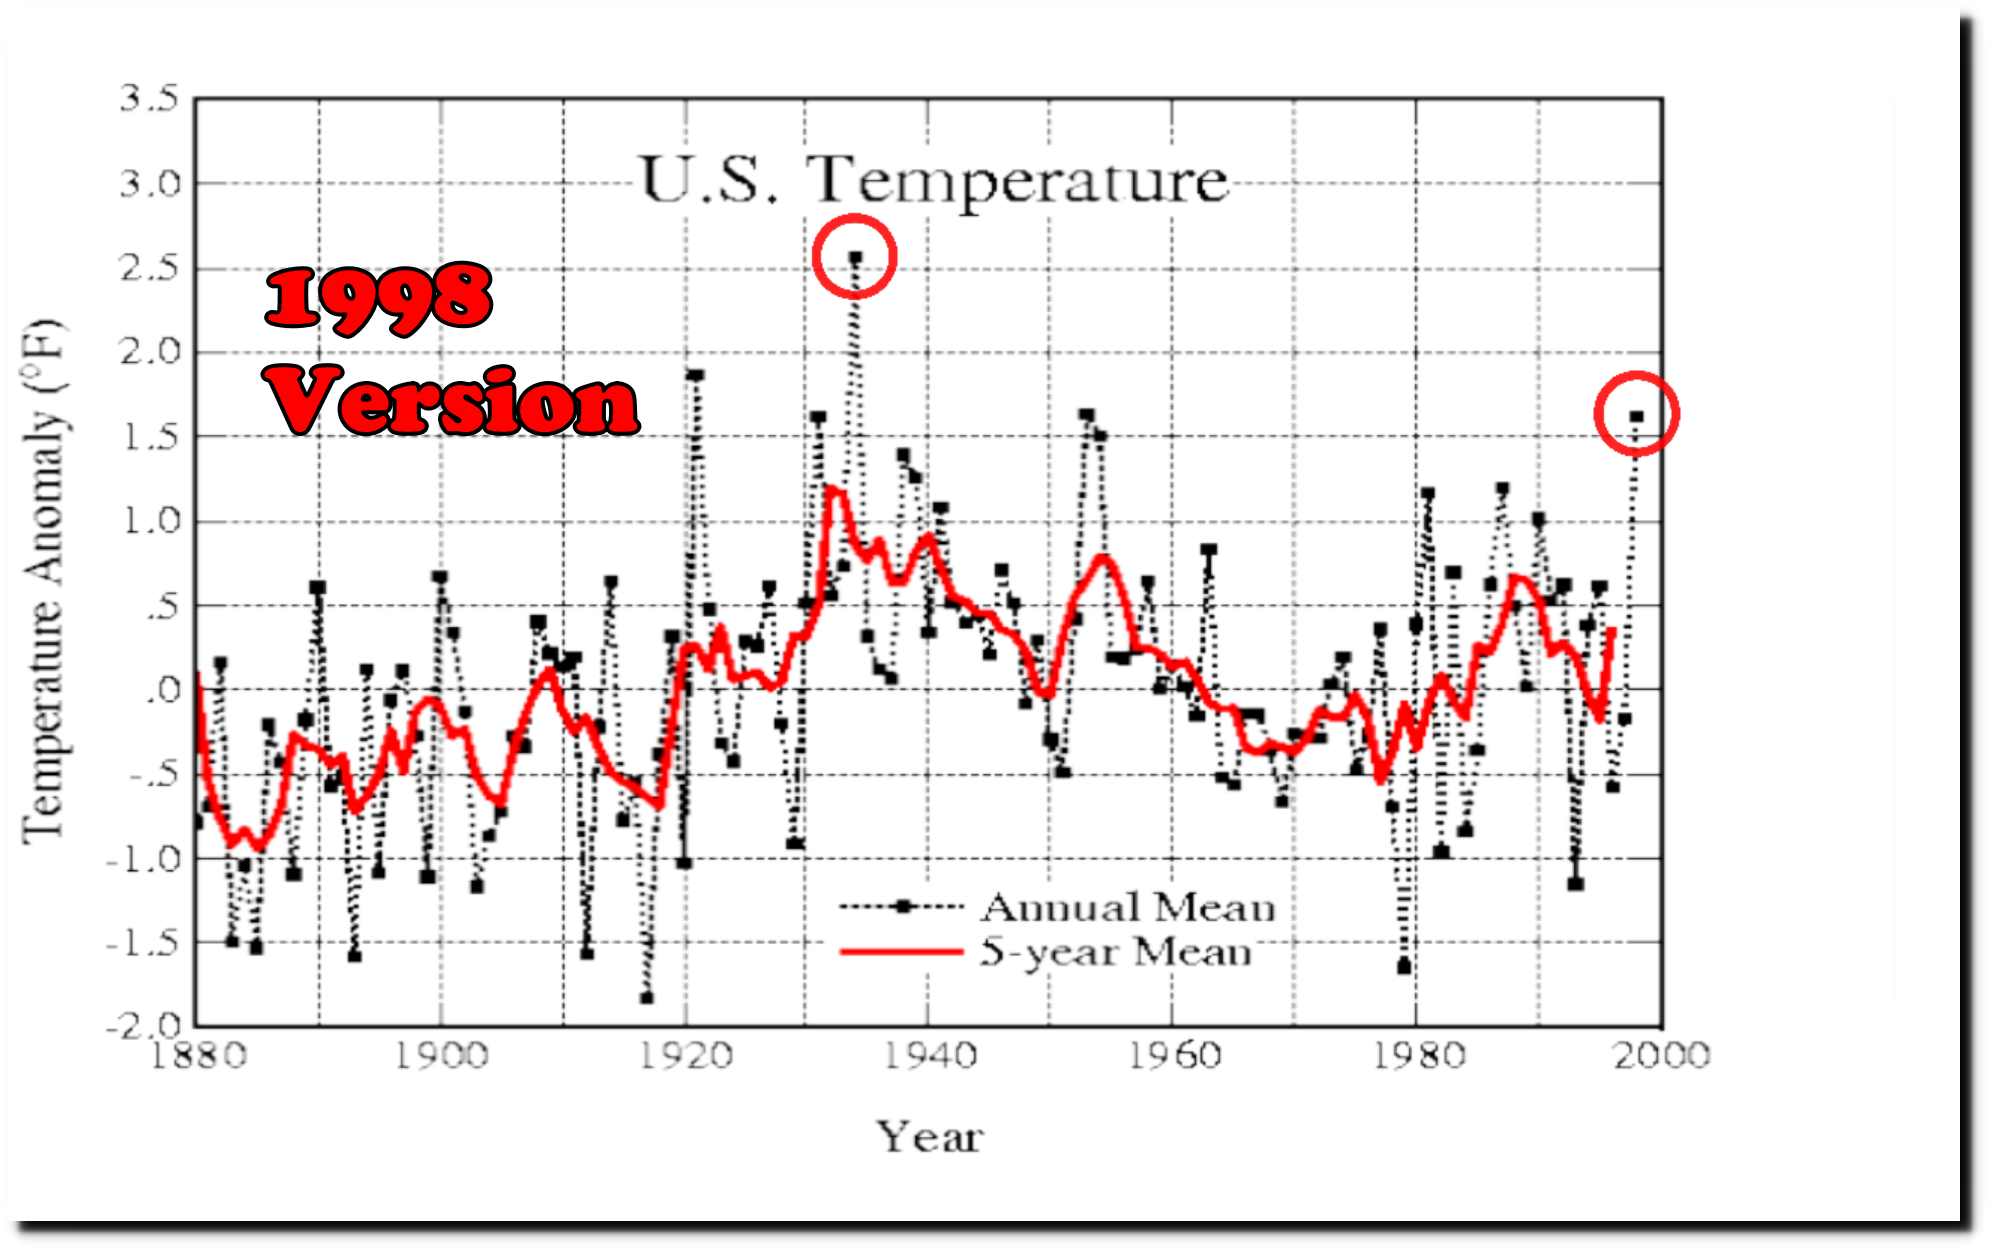
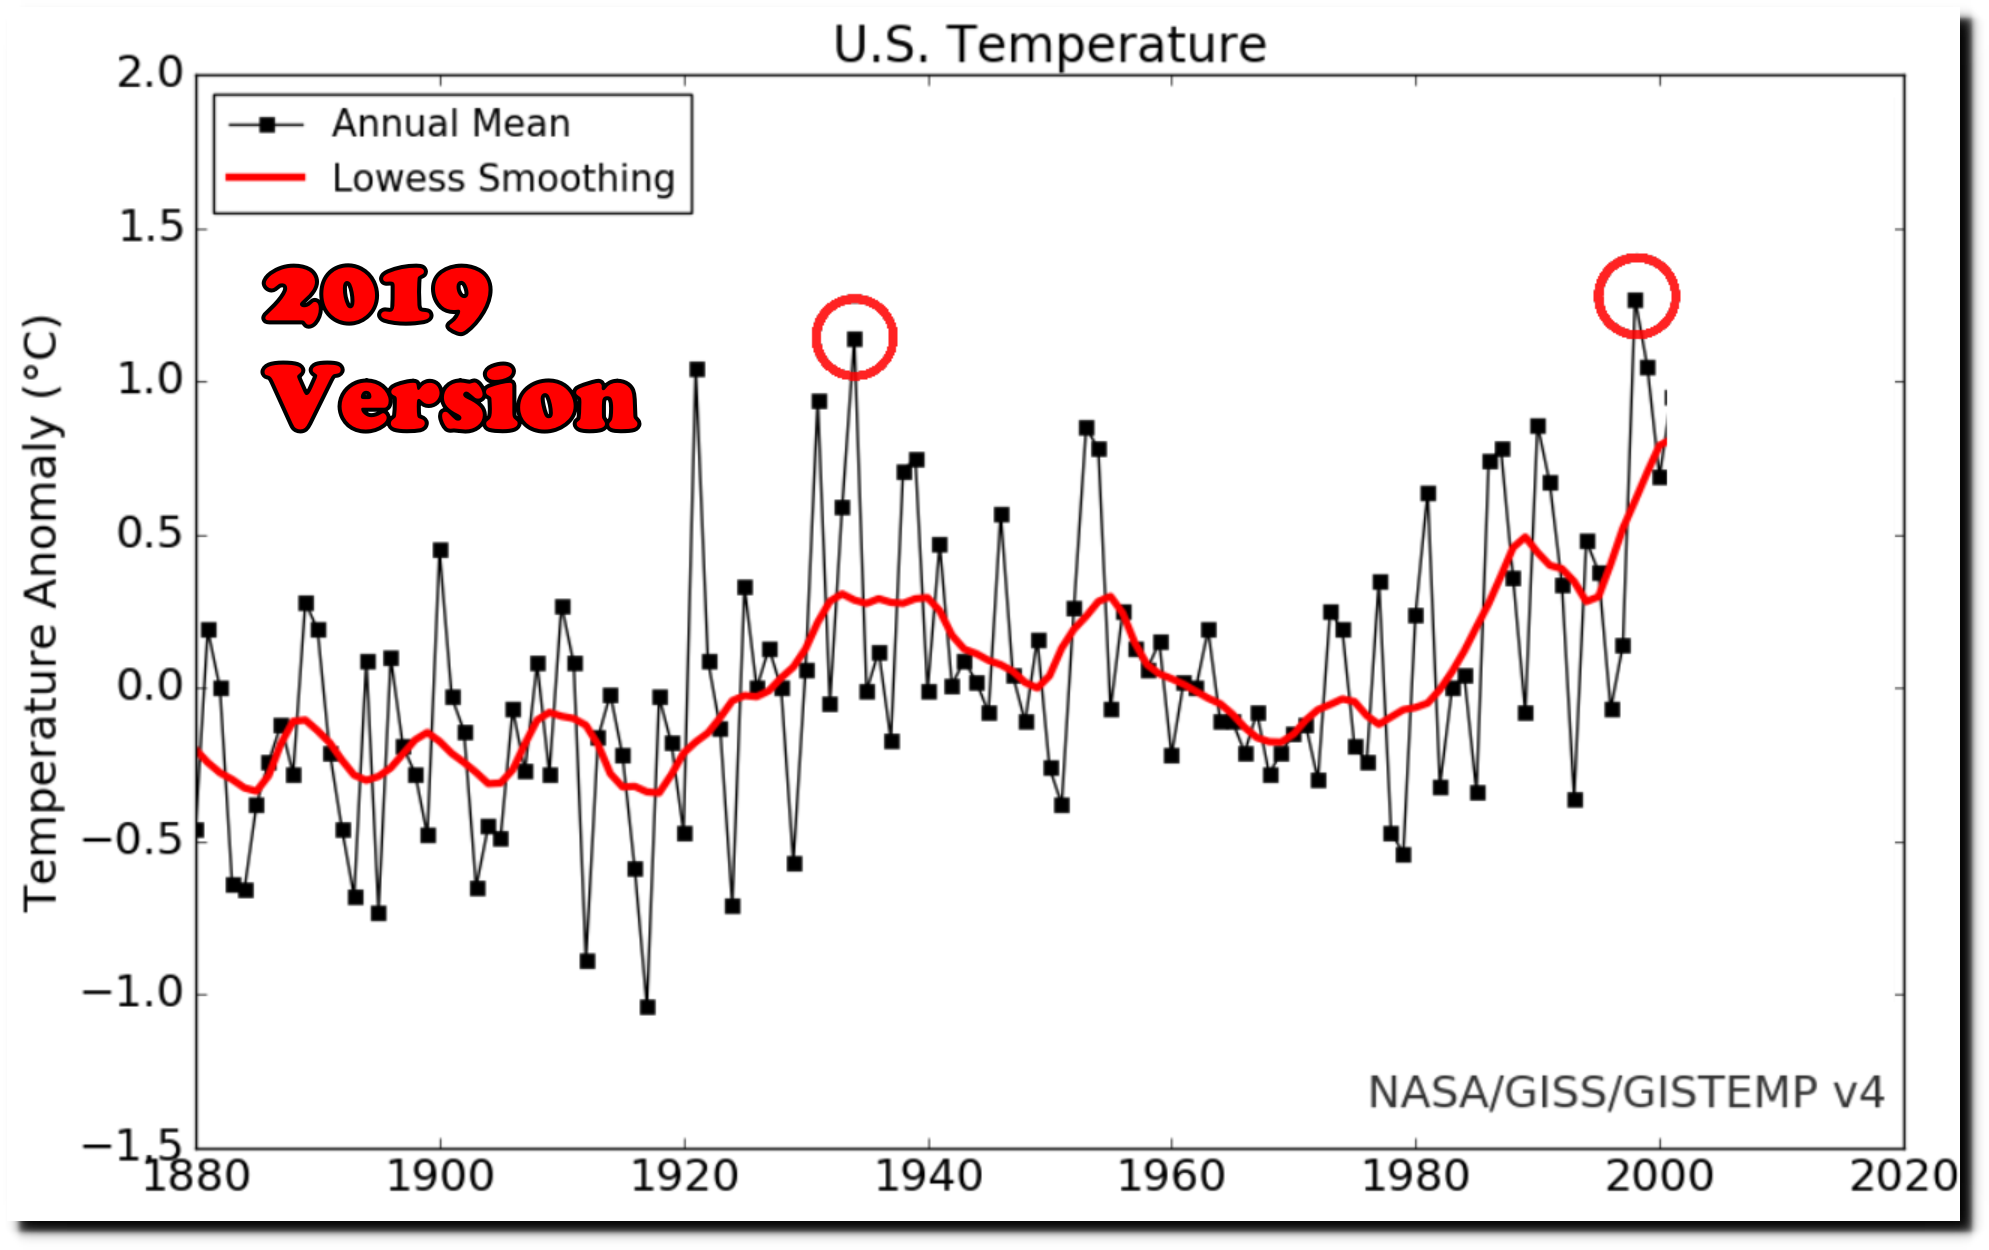
Why did they do this? The National Climate Assessment shows that the US used to be much hotter – in defiance of greenhouse gas theory and the political needs of climate alarmists.
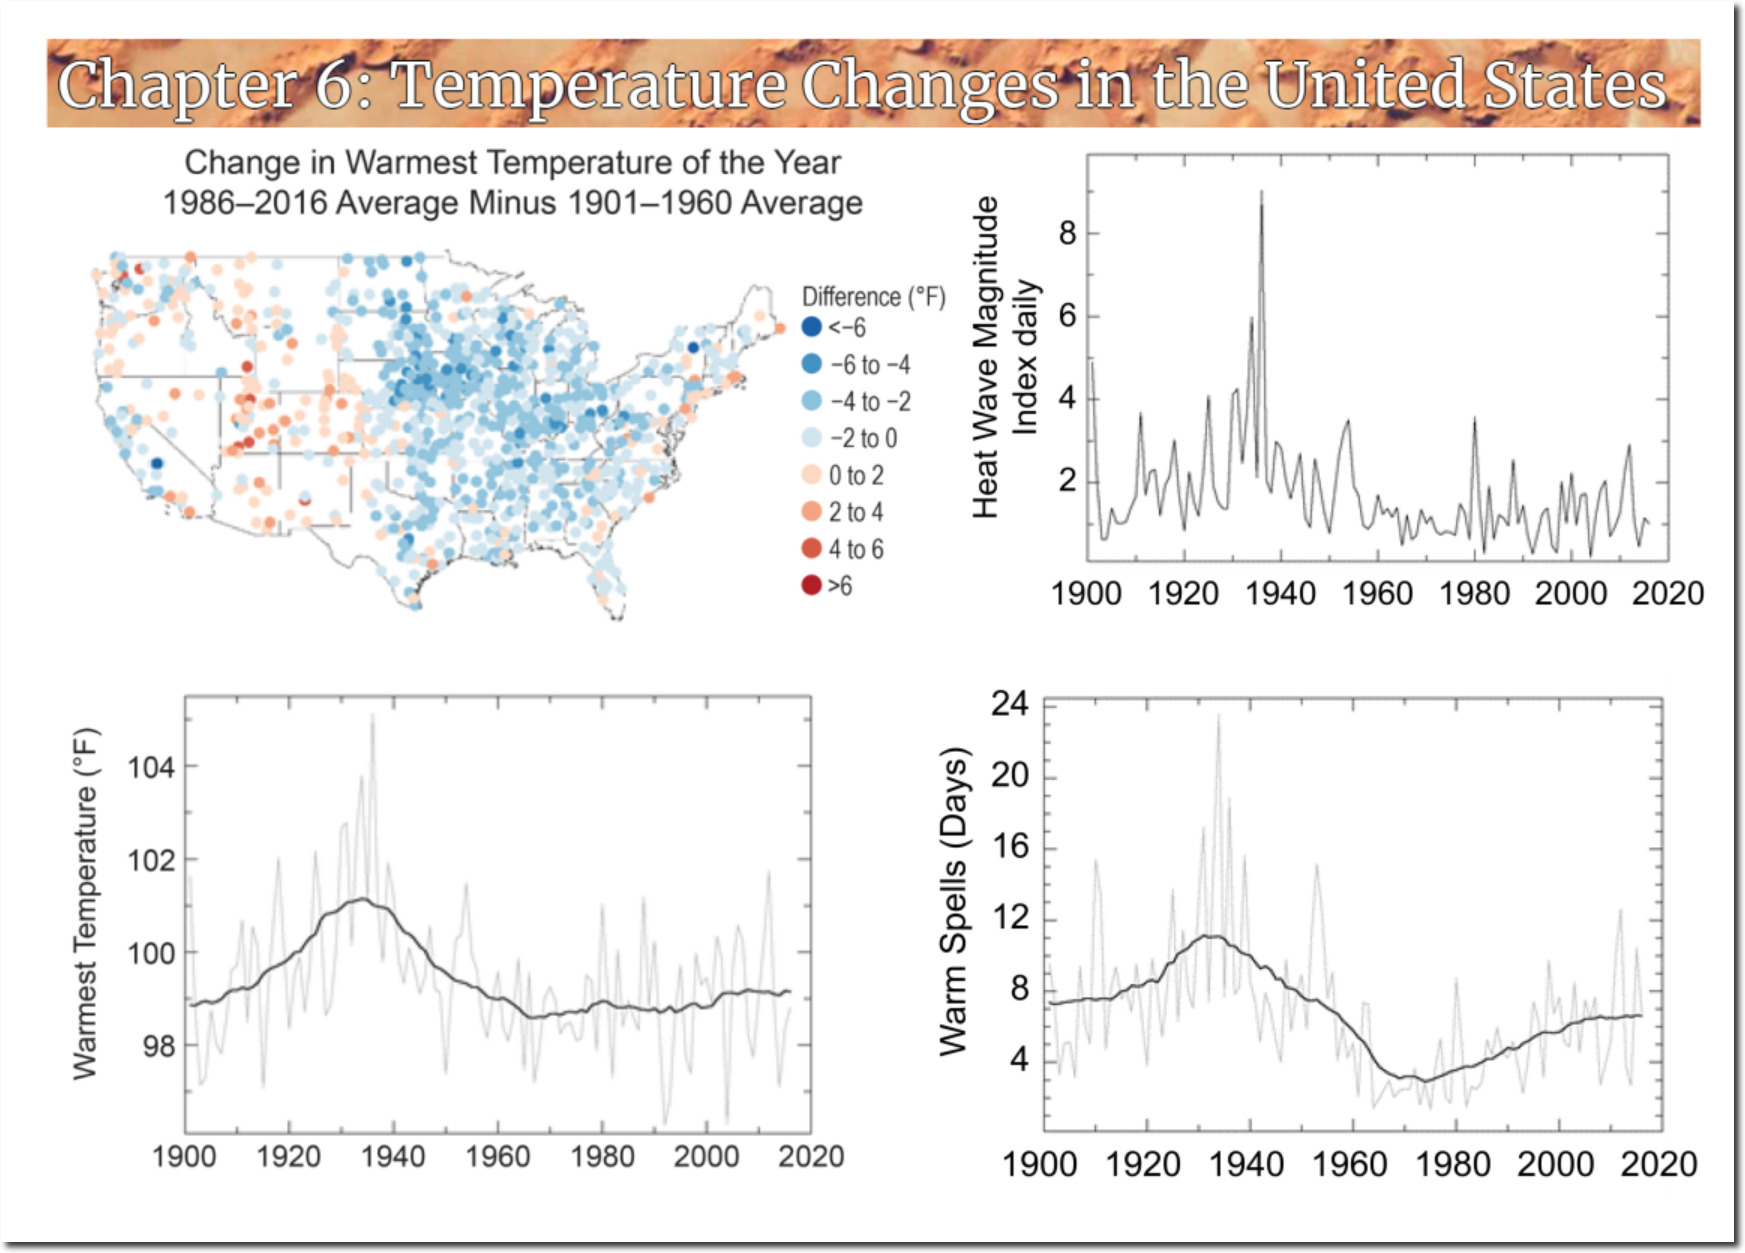
Temperature Changes in the United States – Climate Science Special Report
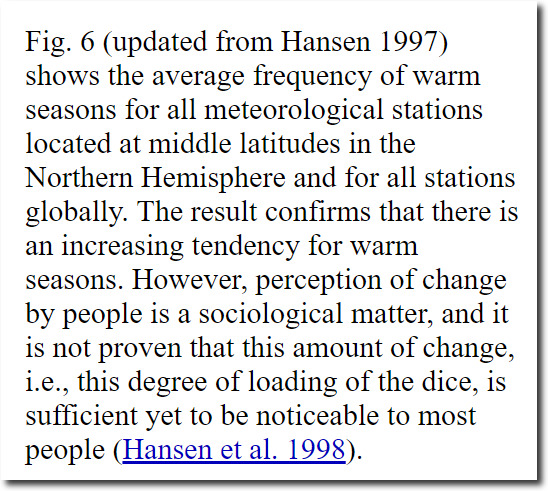
In 1998, NASA was worried that people hadn’t yet accepted their scam, so they altered the data. They said it was a “sociological matter.”
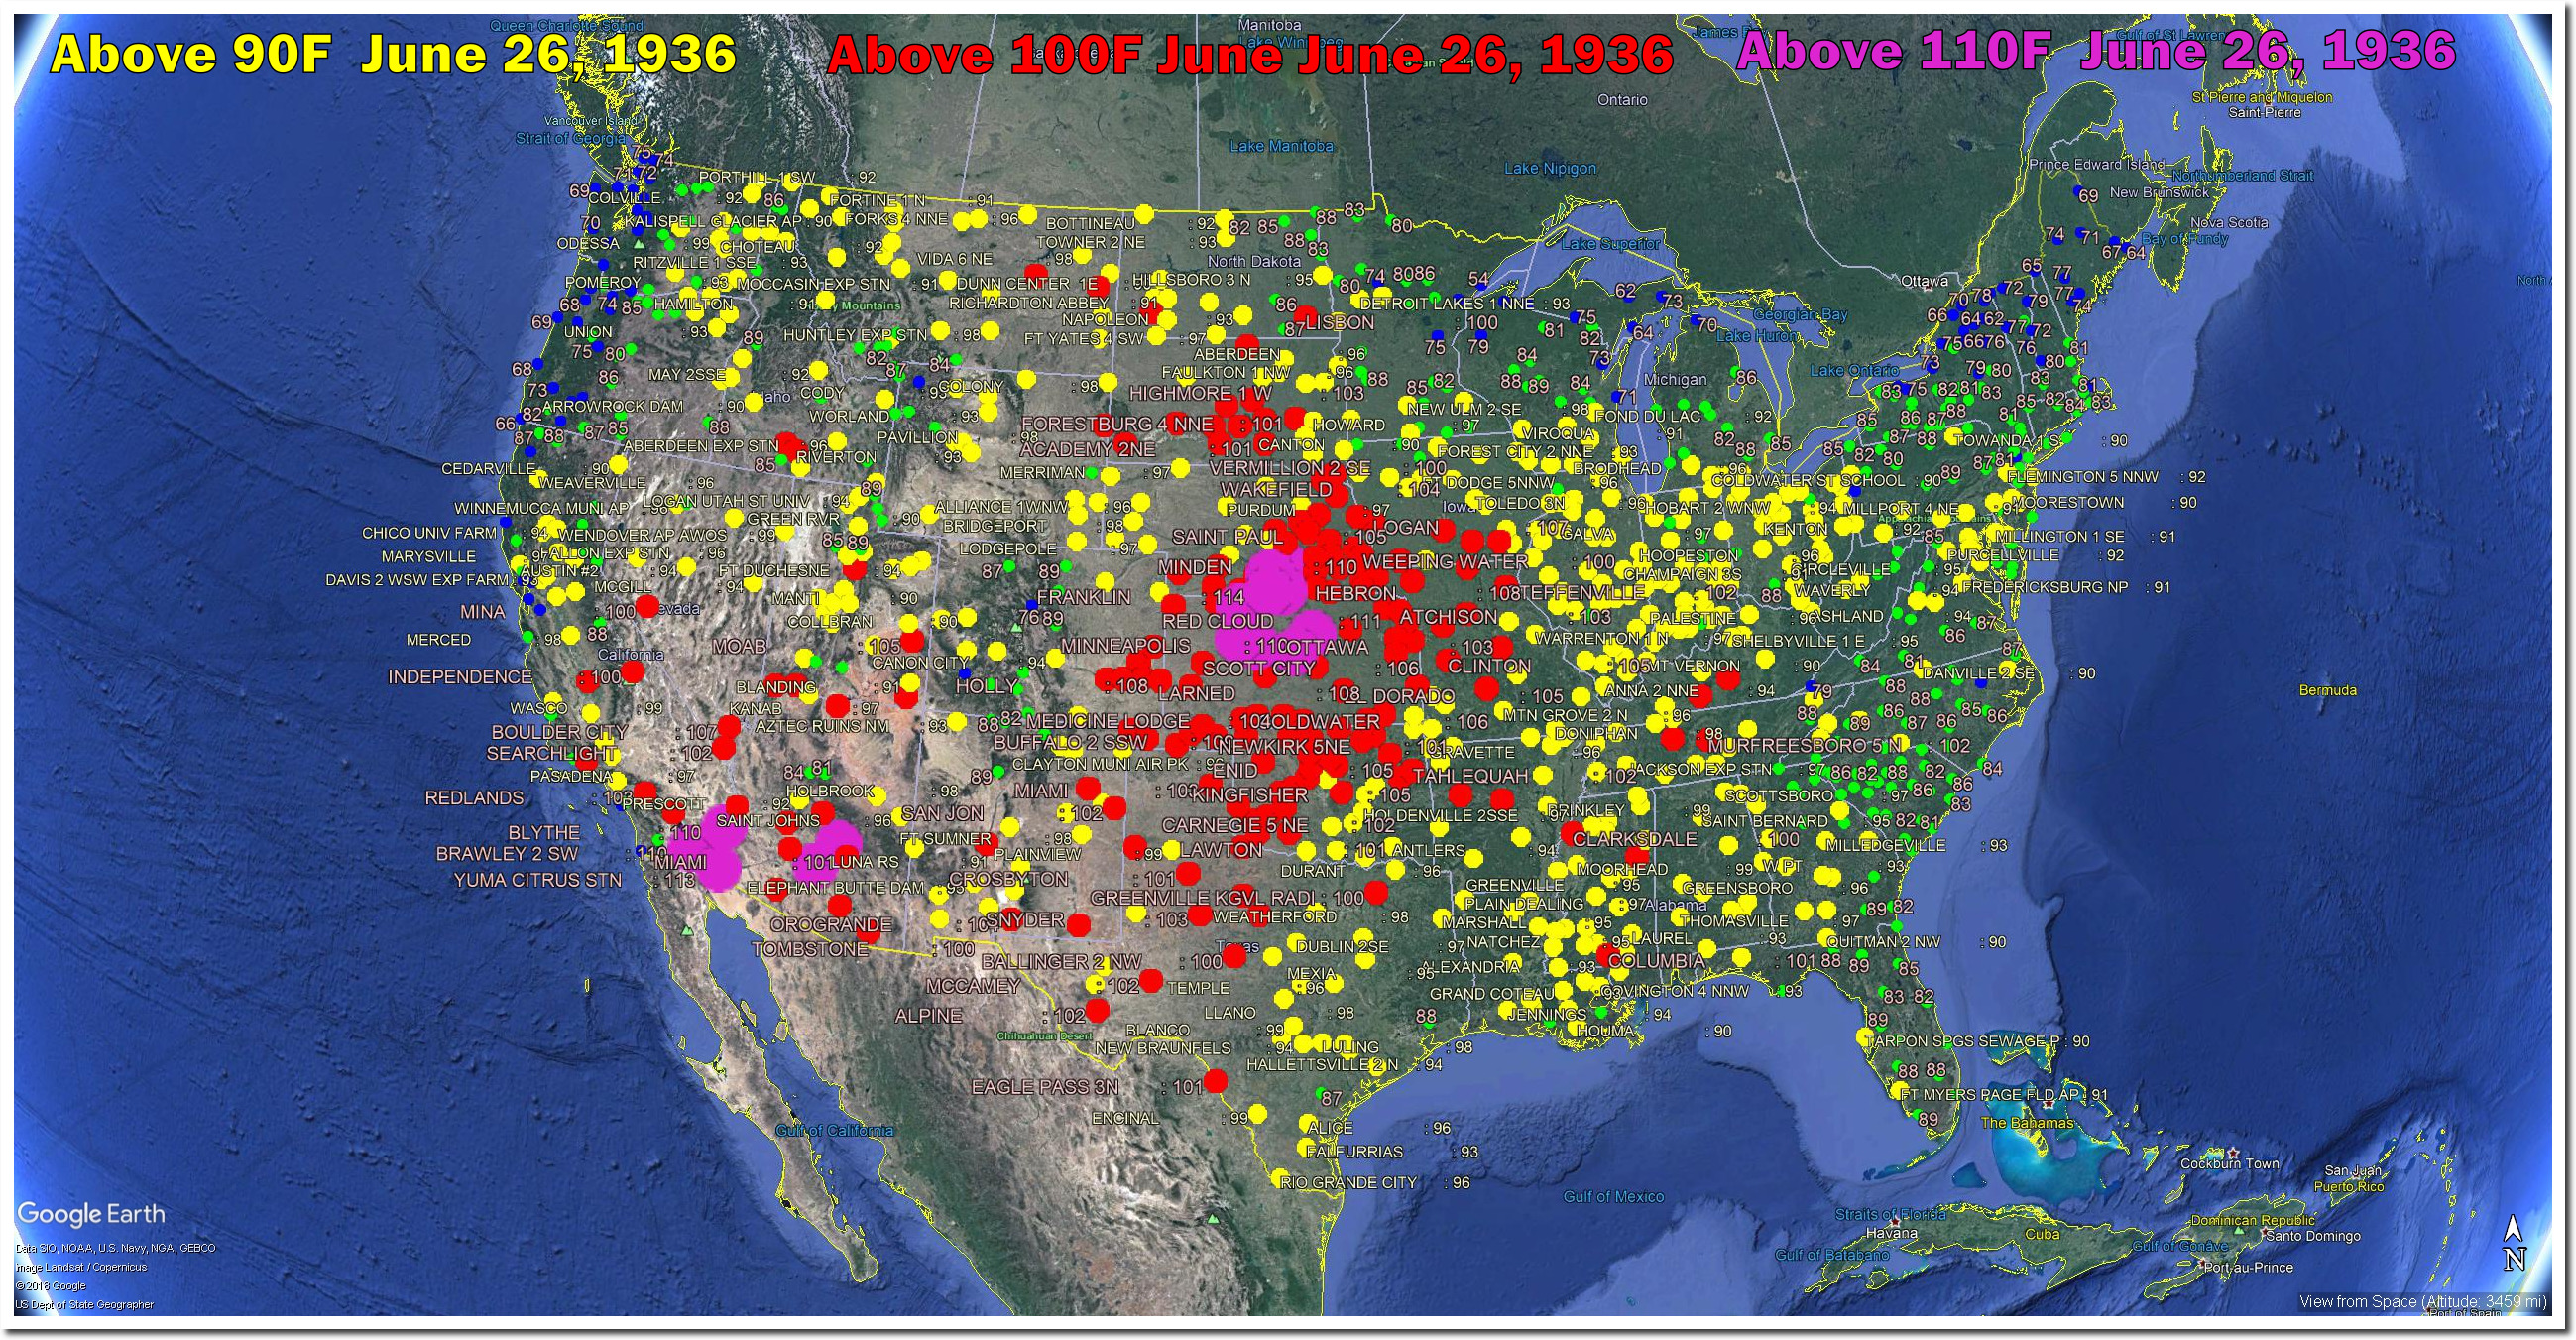
On this date in 1936, the vast majority of the US was over 90 degrees, a large section was over 100 degrees, and it was over 110 degrees in Nebraska and Kansas. Franklin, Nebraska was 114 degrees, and Hays, Kansas was 113 degrees. Nearly 20 degrees warmer than today’s hot weather.
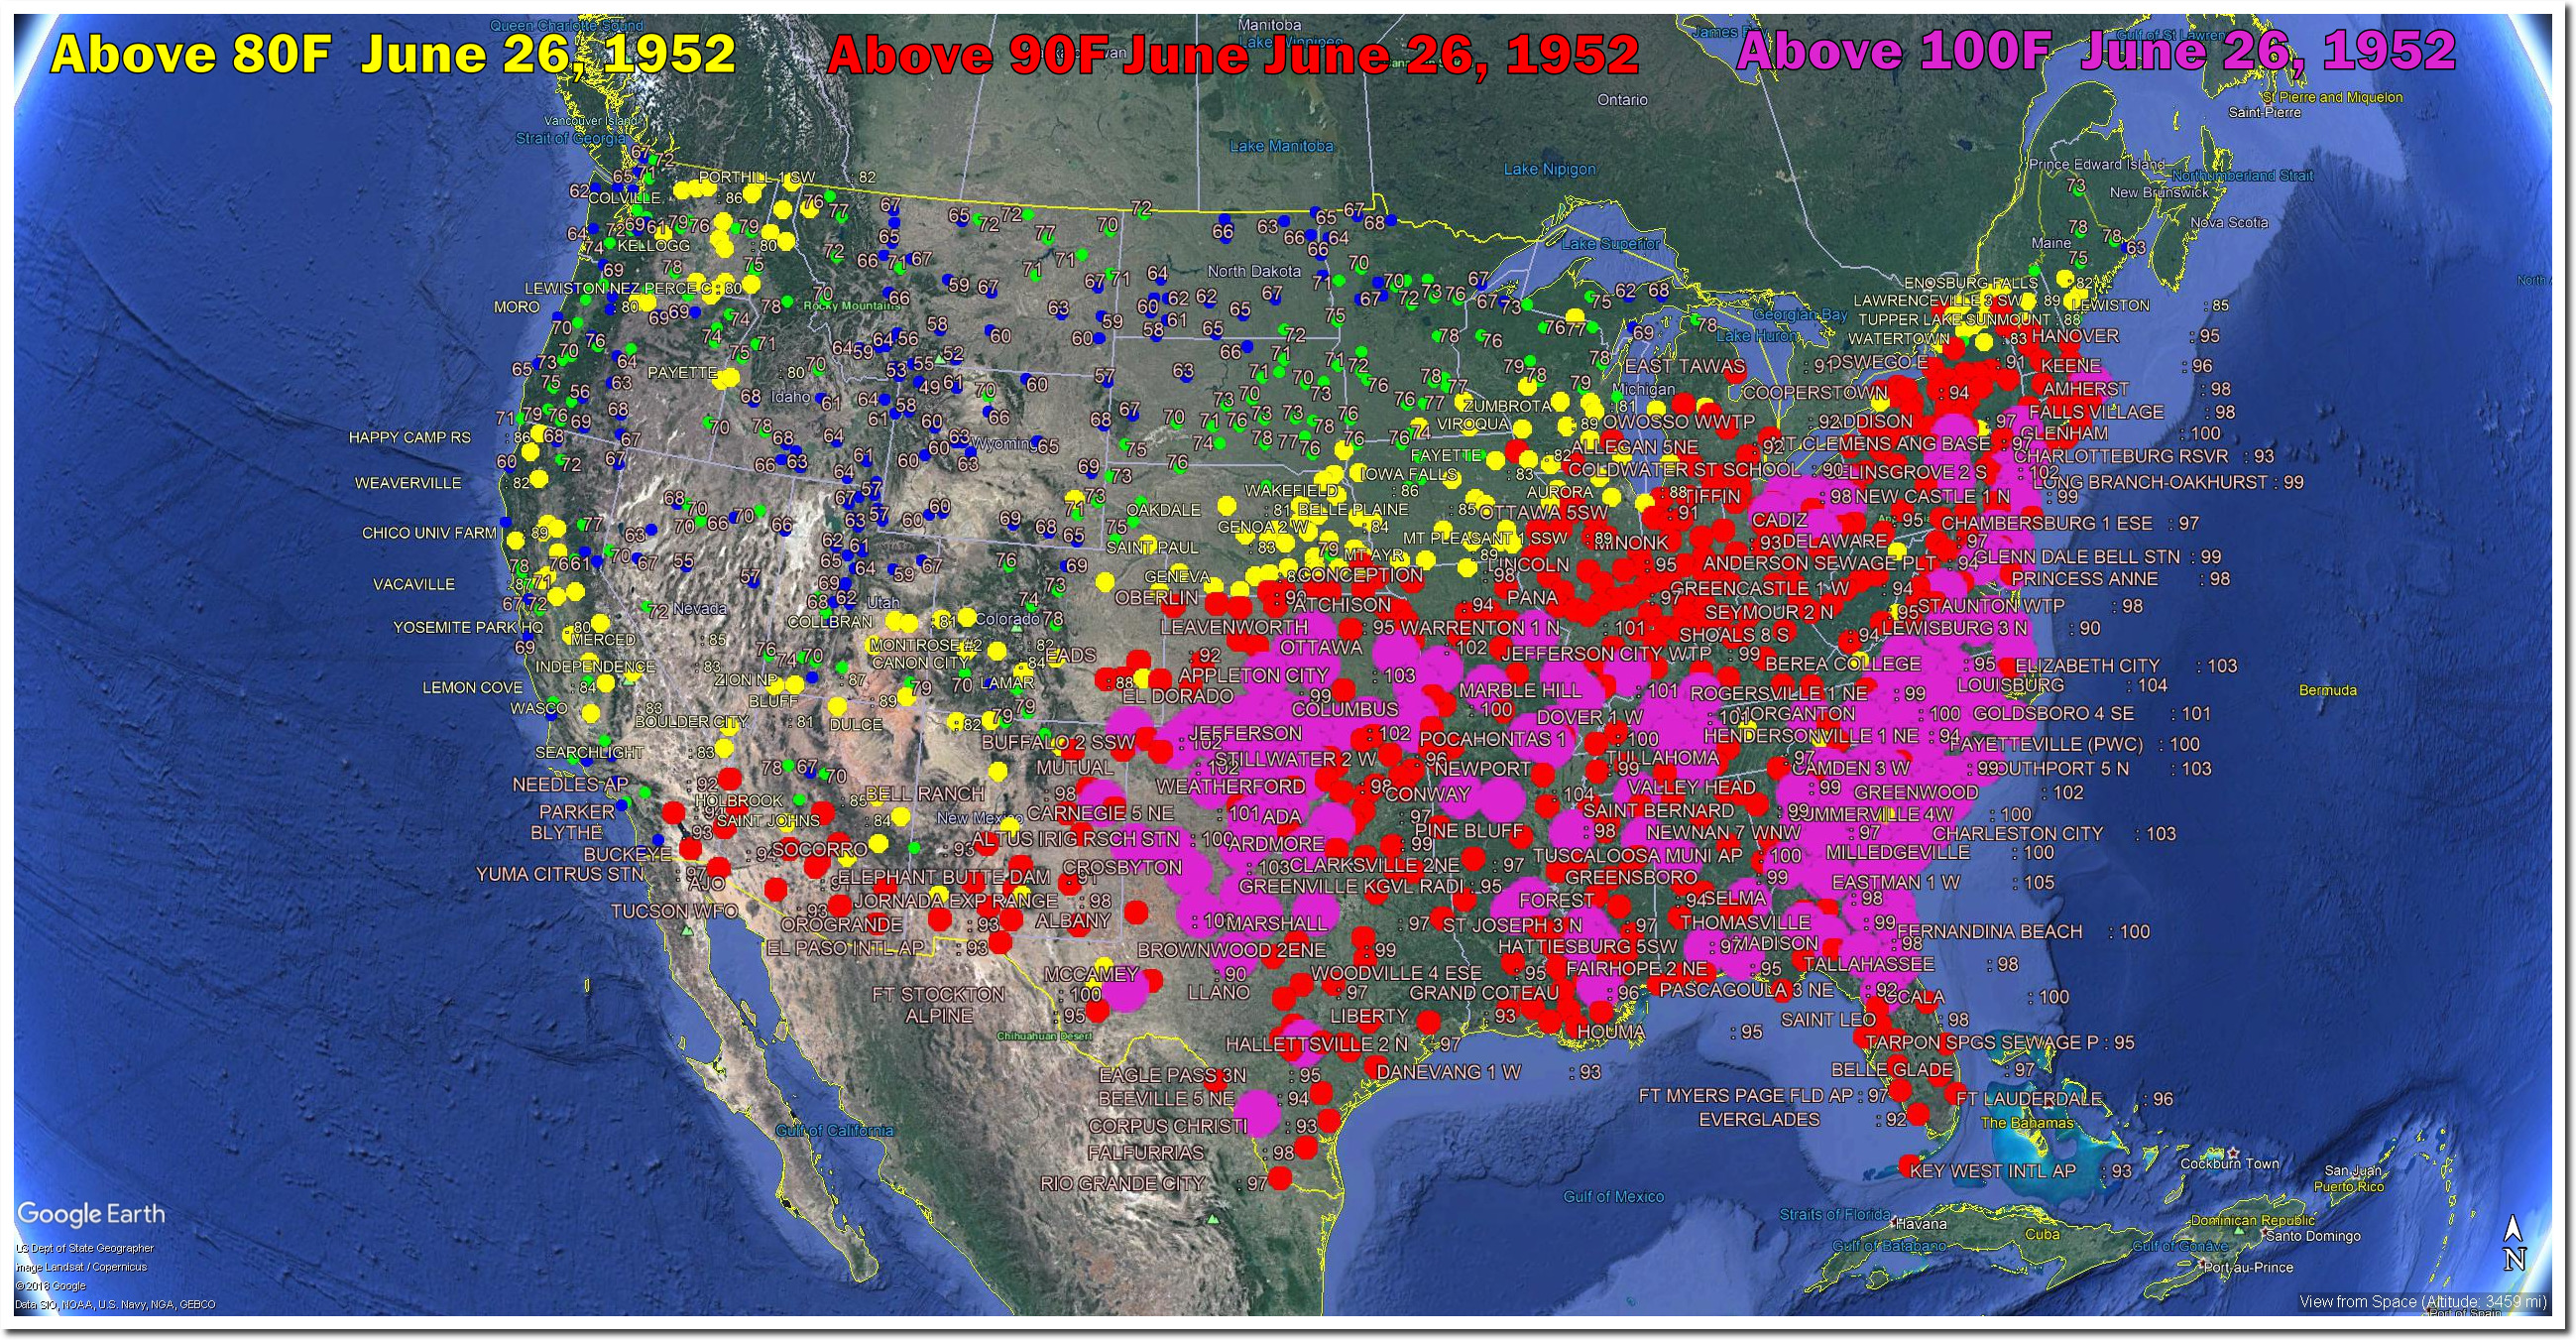
On this date in 1952, most of the eastern half of the US was over 100 degrees.
This date in 1887 was the hottest day on record in Ireland.
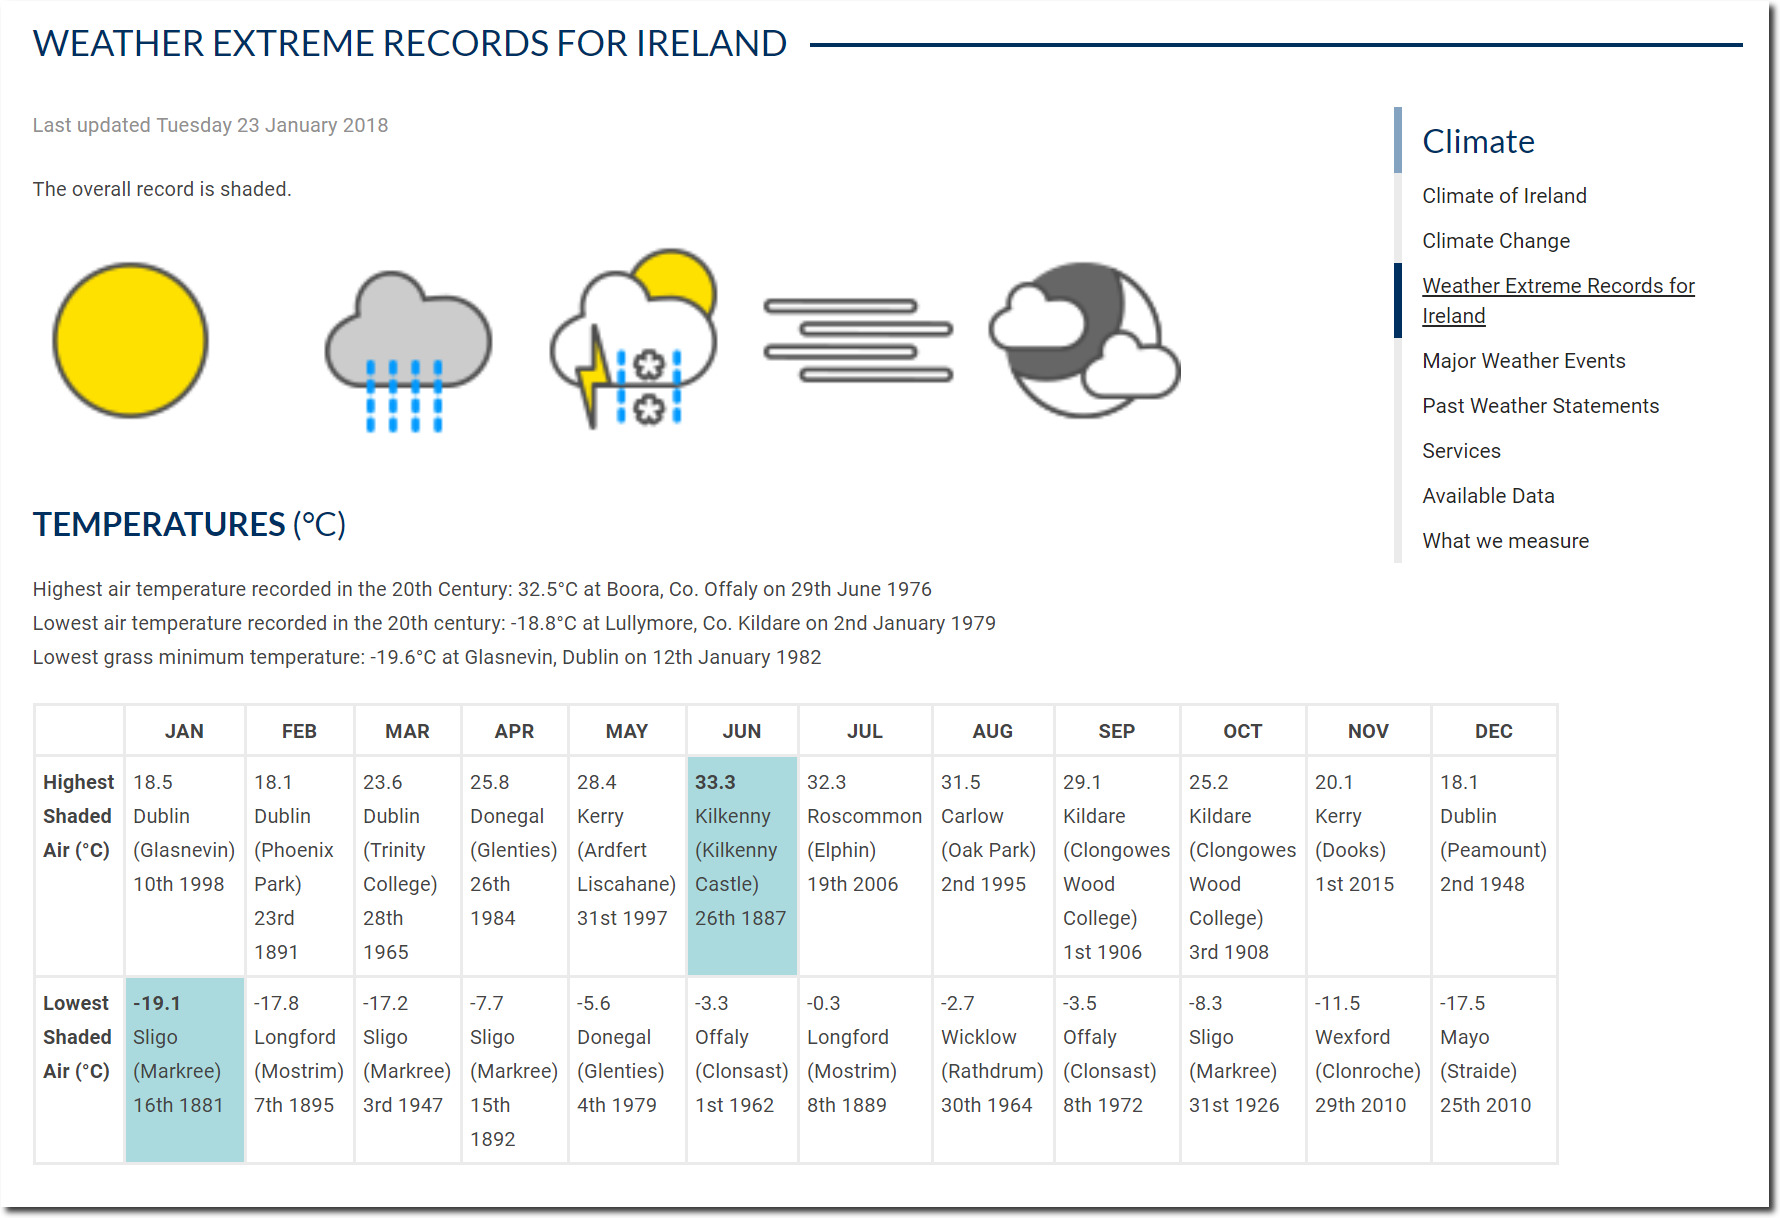
Weather Extreme Records for Ireland – Met Éireann – The Irish Meteorological Service
But propagandists have no need for actual data. Never mind that National Climate Assessment says summers are getting cooler – the New York Times says it is just your imagination.

It’s Not Your Imagination. Summers Are Getting Hotter. – The New York Times
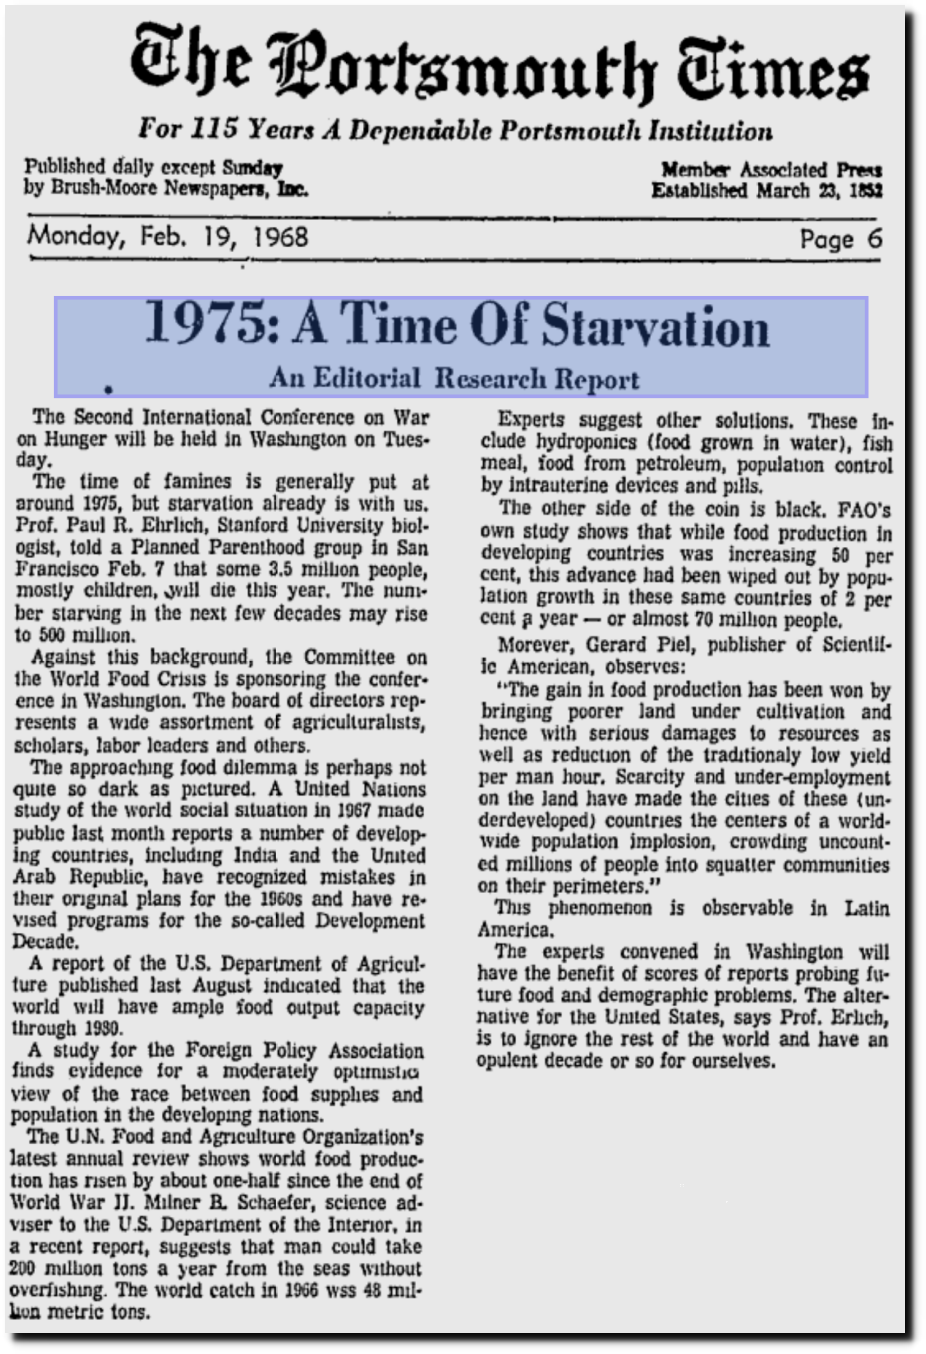
In the 1930s we had an actual climate crisis. That needed to be erased.
Posted in Uncategorized
Leave a comment
The Very Real Climate Crisis Of 1936
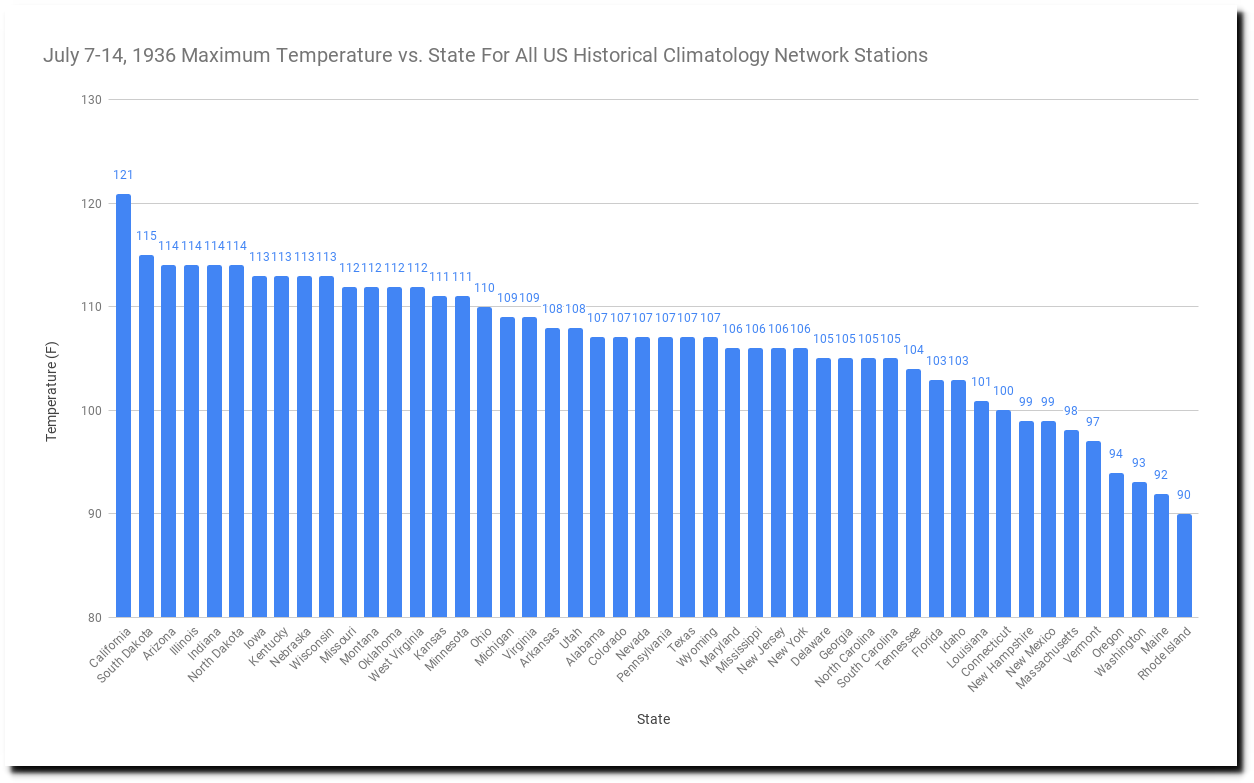
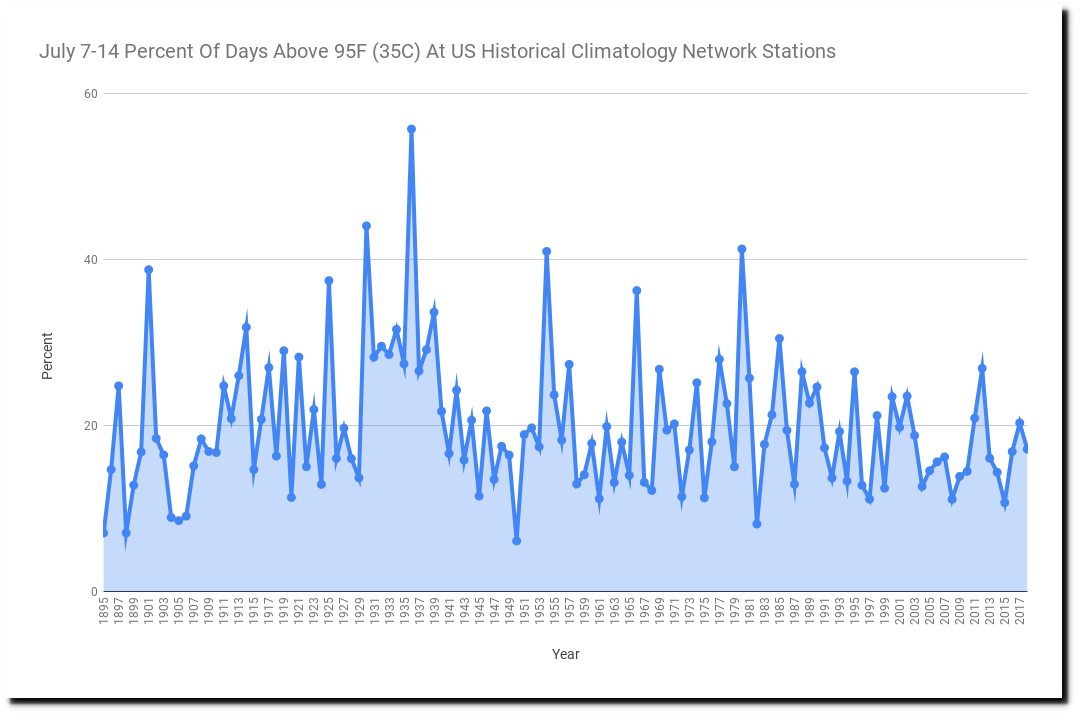
From July 7-14, 1936 every state reached 90F (32C), forty states reached 100F (38C) and sixteen states reached 110F (43C.) It was the hottest week in US history.
California, South Dakota, Arizona, Illinois, Indiana, North Dakota, Iowa, Kentucky, Nebraska, Wisconsin, Missouri, Montana, Oklahoma, West Virginia, Kansas, Minnesota and Ohio were all over 110F. South Dakota reached 115F and California was over 120F.
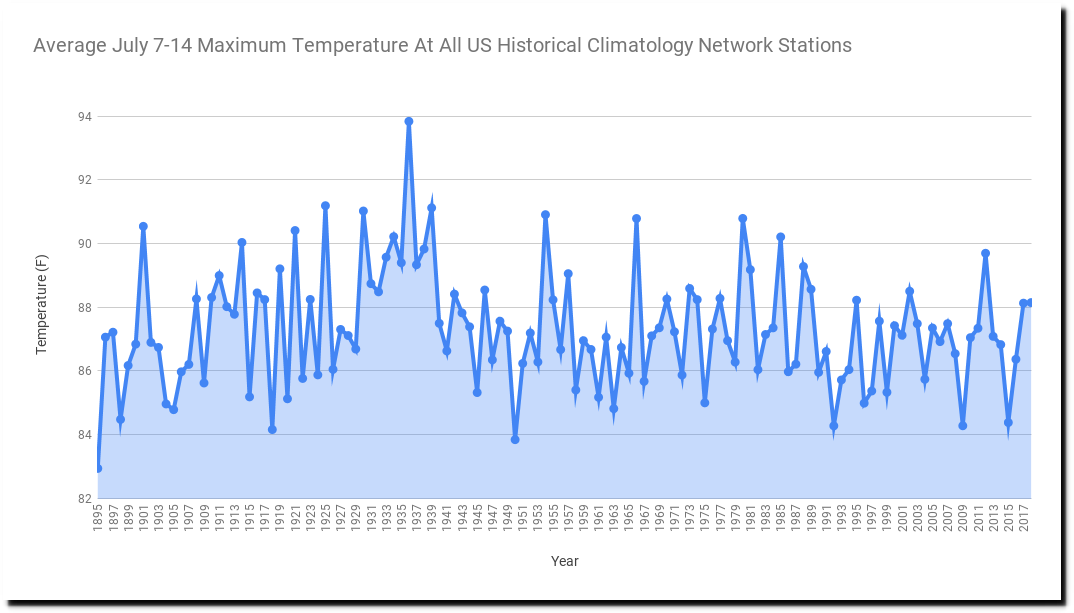
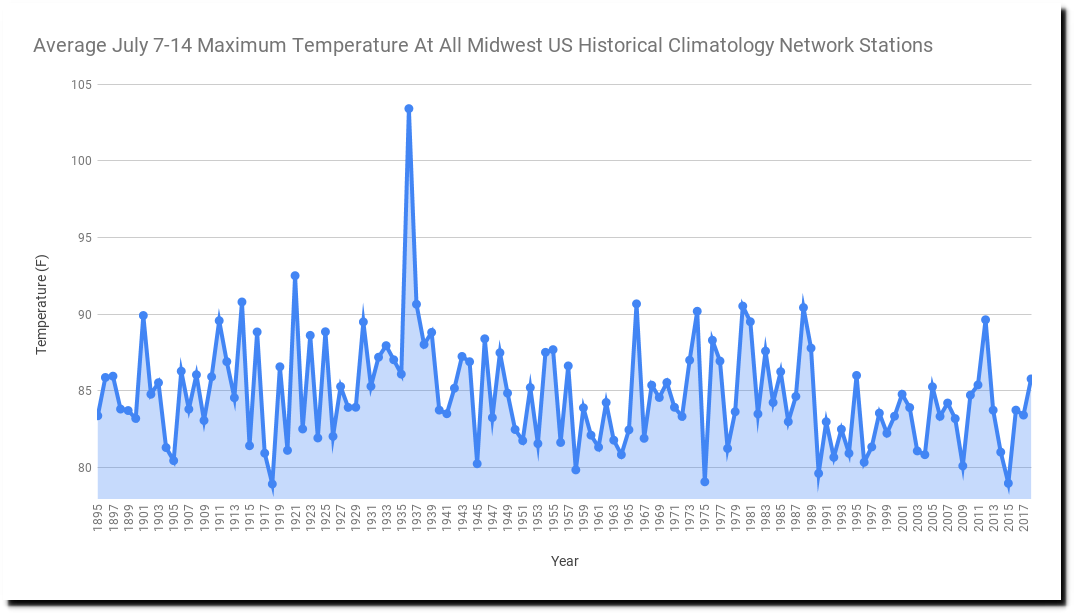
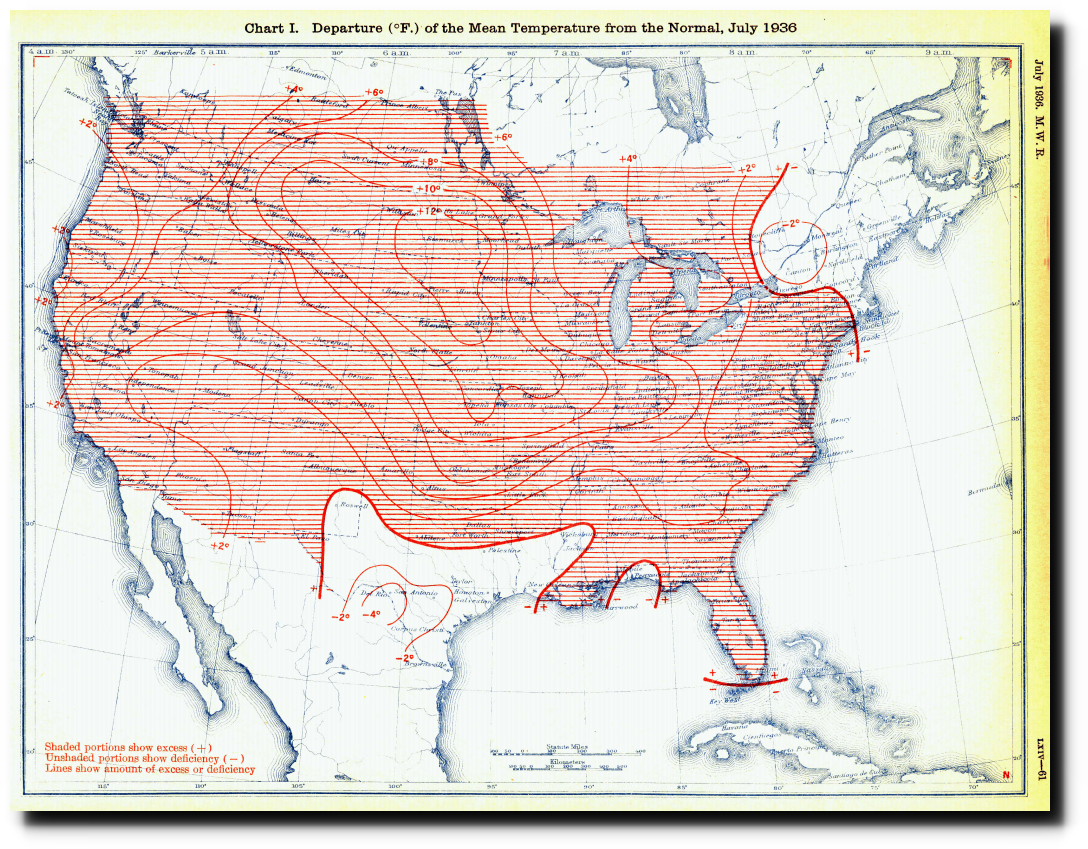
The average afternoon temperature in the US during that week was 94 degrees, seven degrees above the average since 1895.
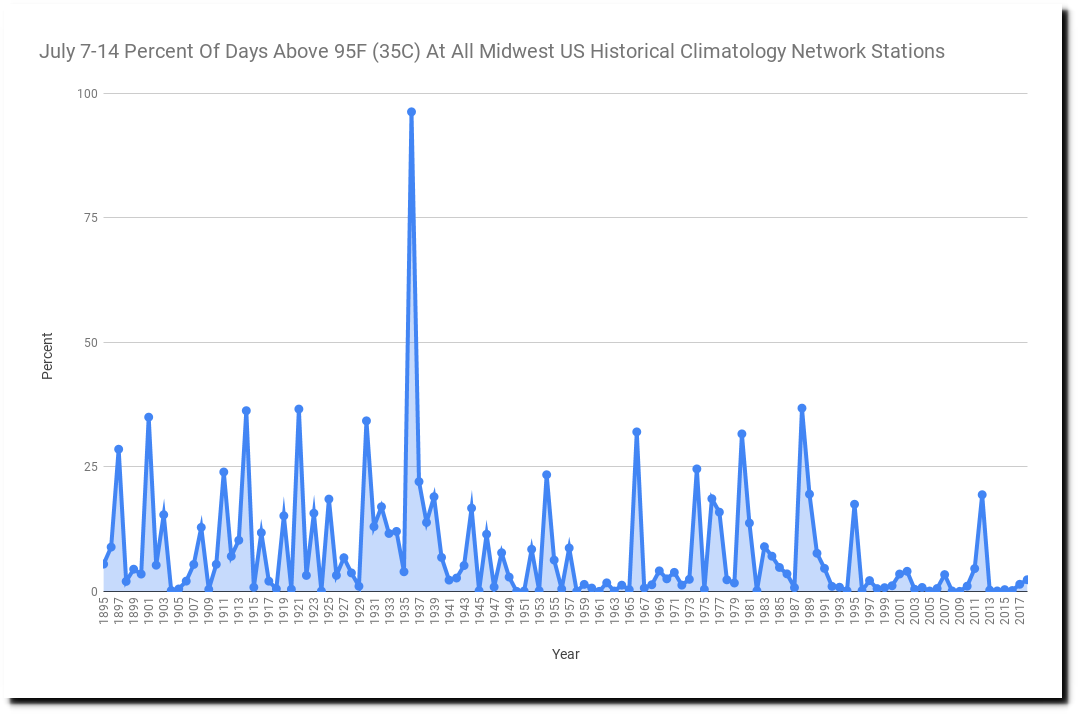
More than 50% of temperature readings were above 95F (35C.)
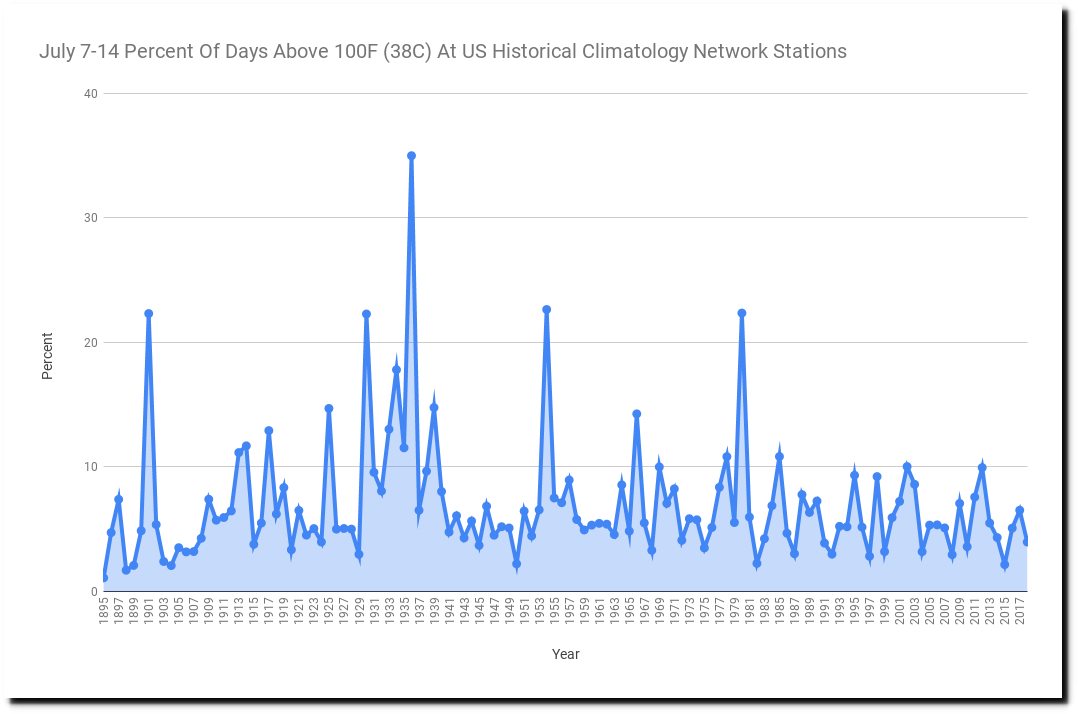
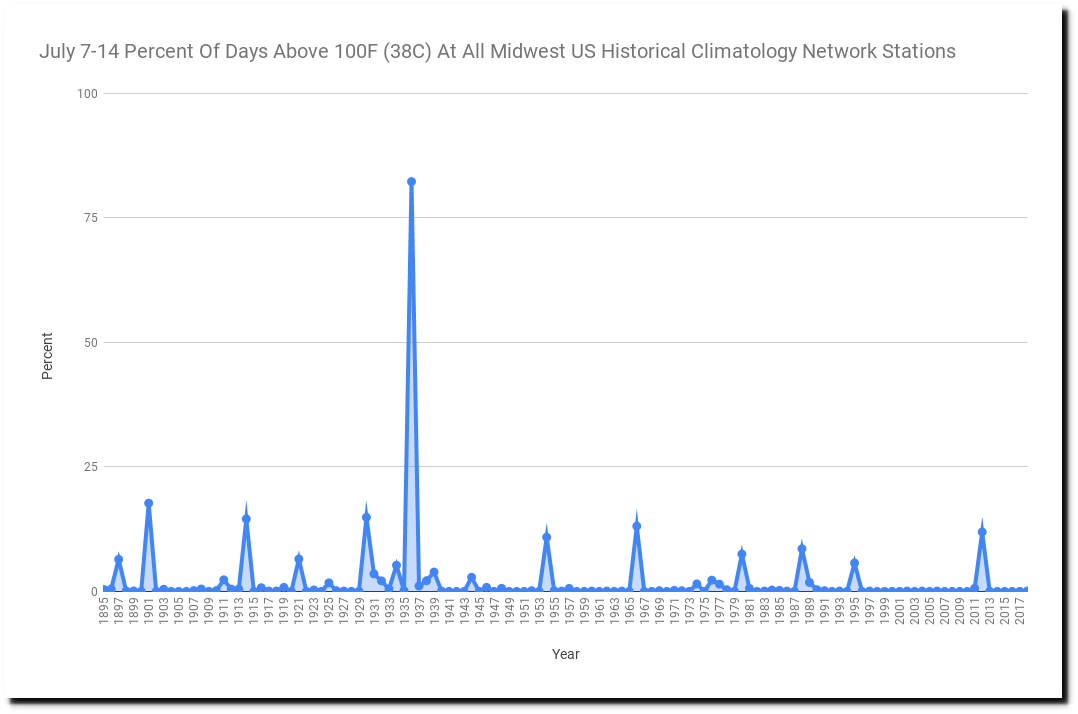
More than a third of temperature readings were over 100F (38C)

The animated gif below shows the progression of the heatwave.
The most remarkable statistics were for the Midwest, which averaged 103F.
Almost 100% of Midwest temperature readings were over 95F that week.
And more than three-fourths of Midwest temperature readings were over 100F.
July, 1936 was the hottest month on record in the US.
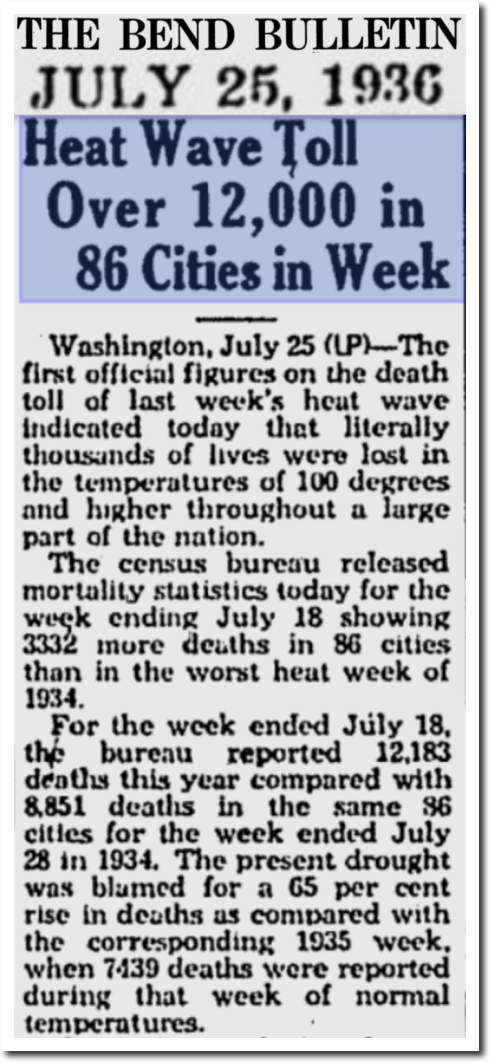
The Bulletin – Google News Archive Search
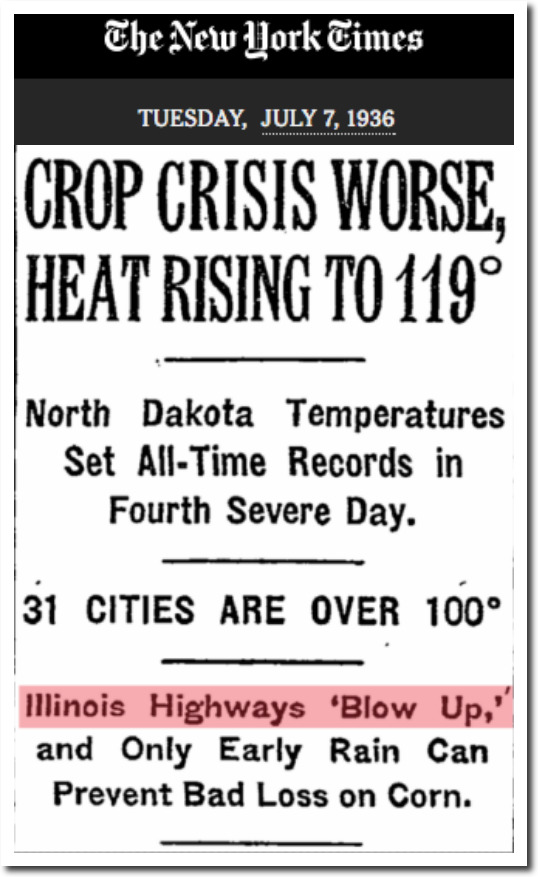
TimesMachine: July 7, 1936 – NYTimes.com
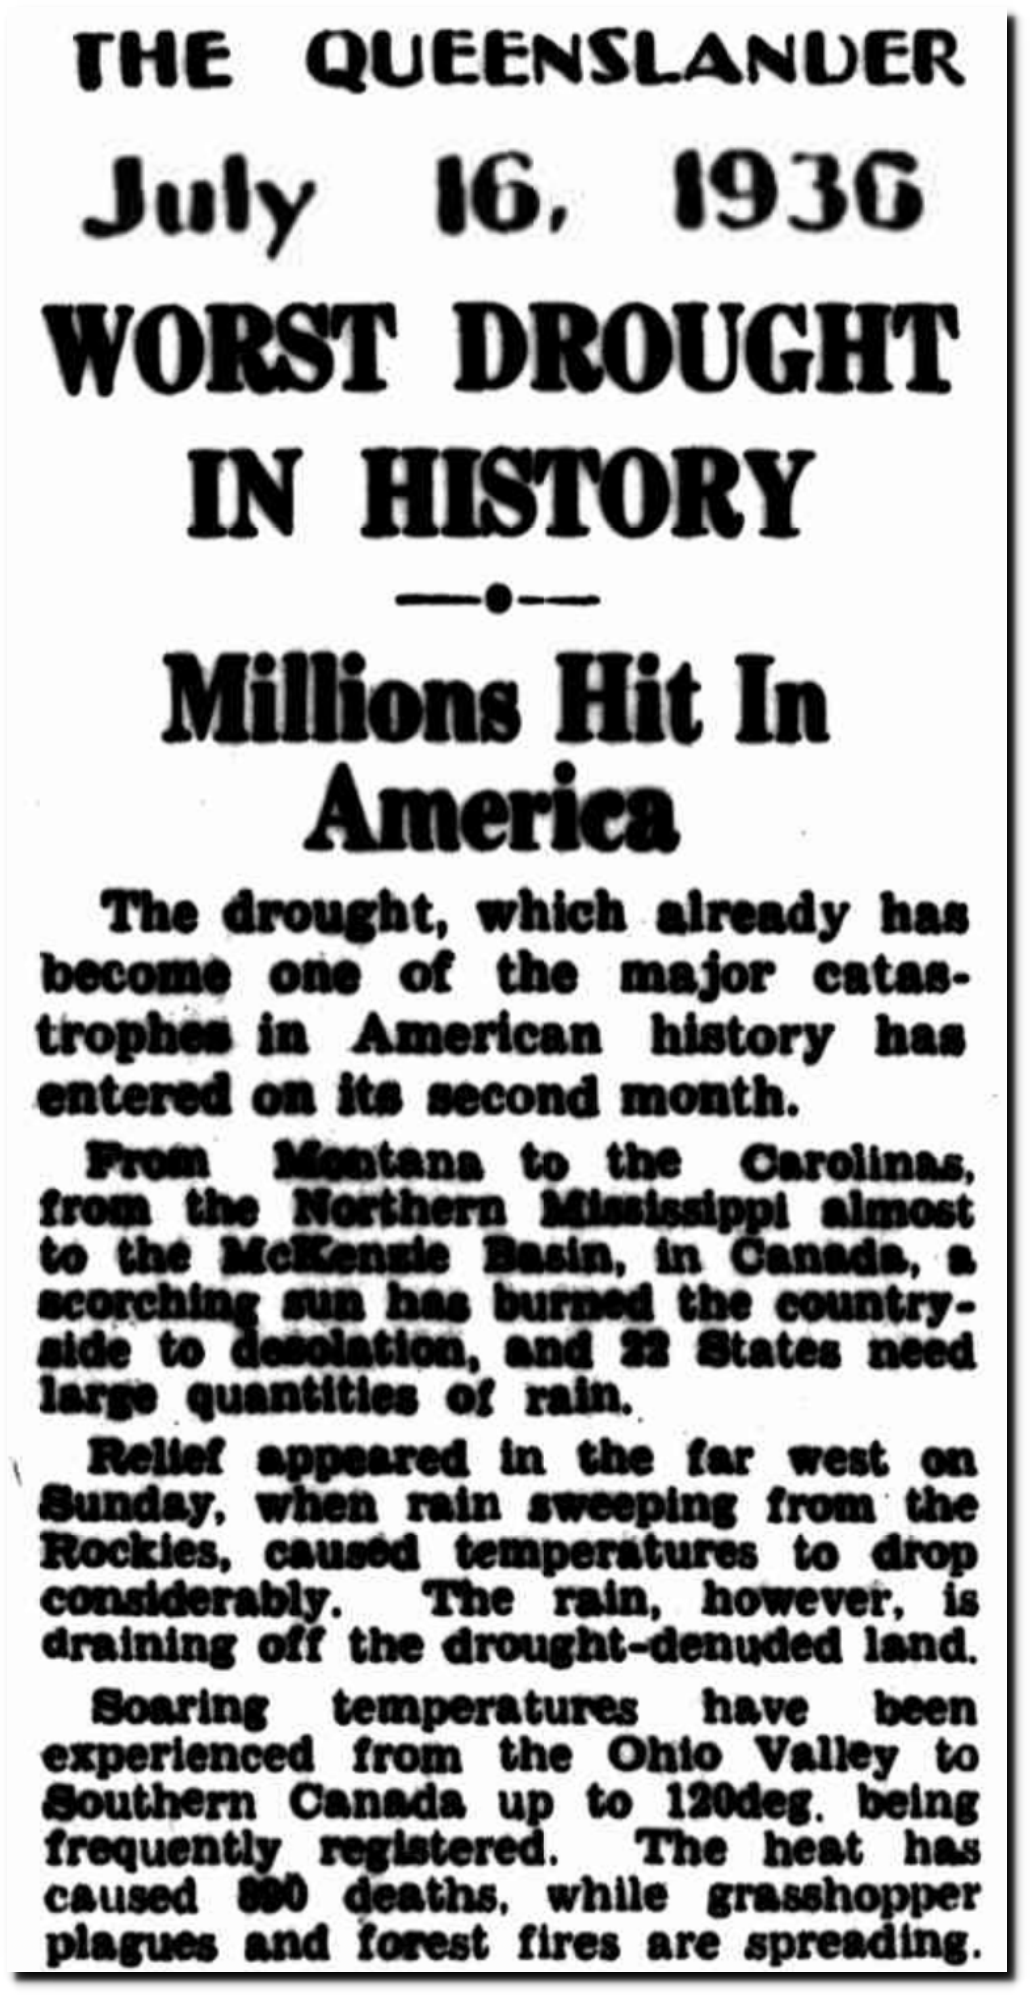
16 Jul 1936 – WORST DROUGHT IN HISTORY – Trove
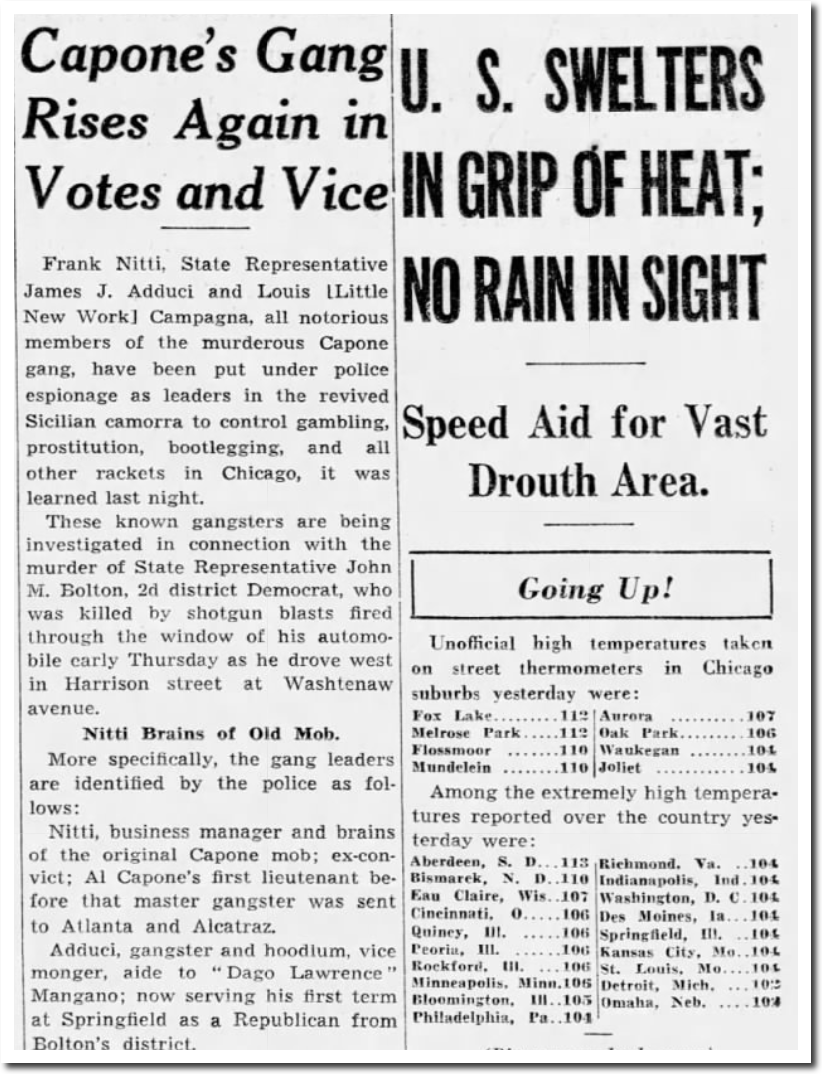
11 Jul 1936, 1 – Chicago Tribune at Newspapers.com
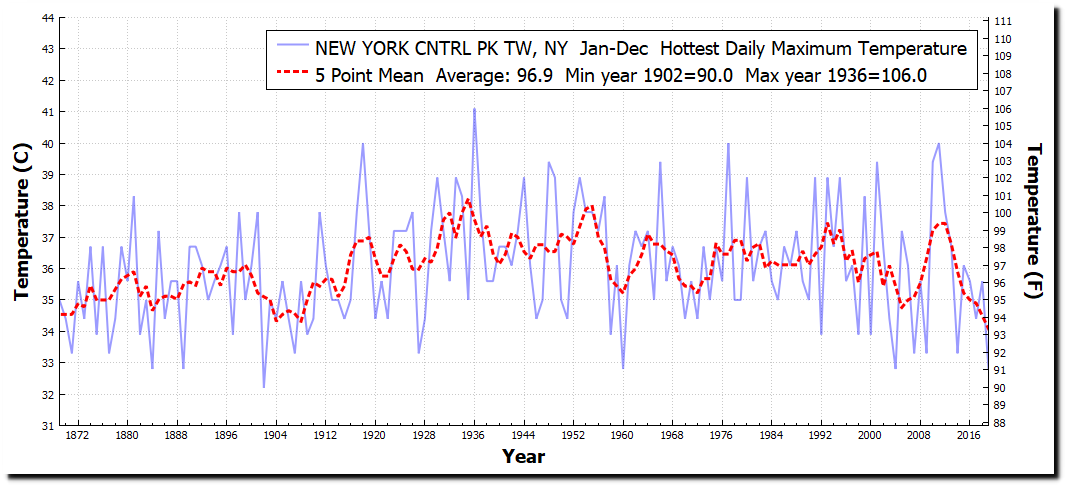
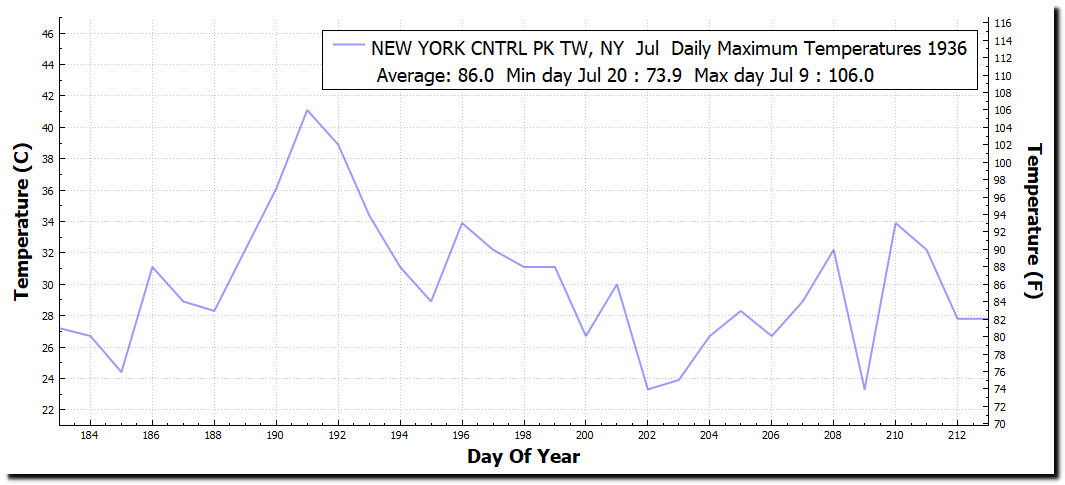
The hottest temperature ever recorded in New York City (106F) occurred on July 9, 1936.
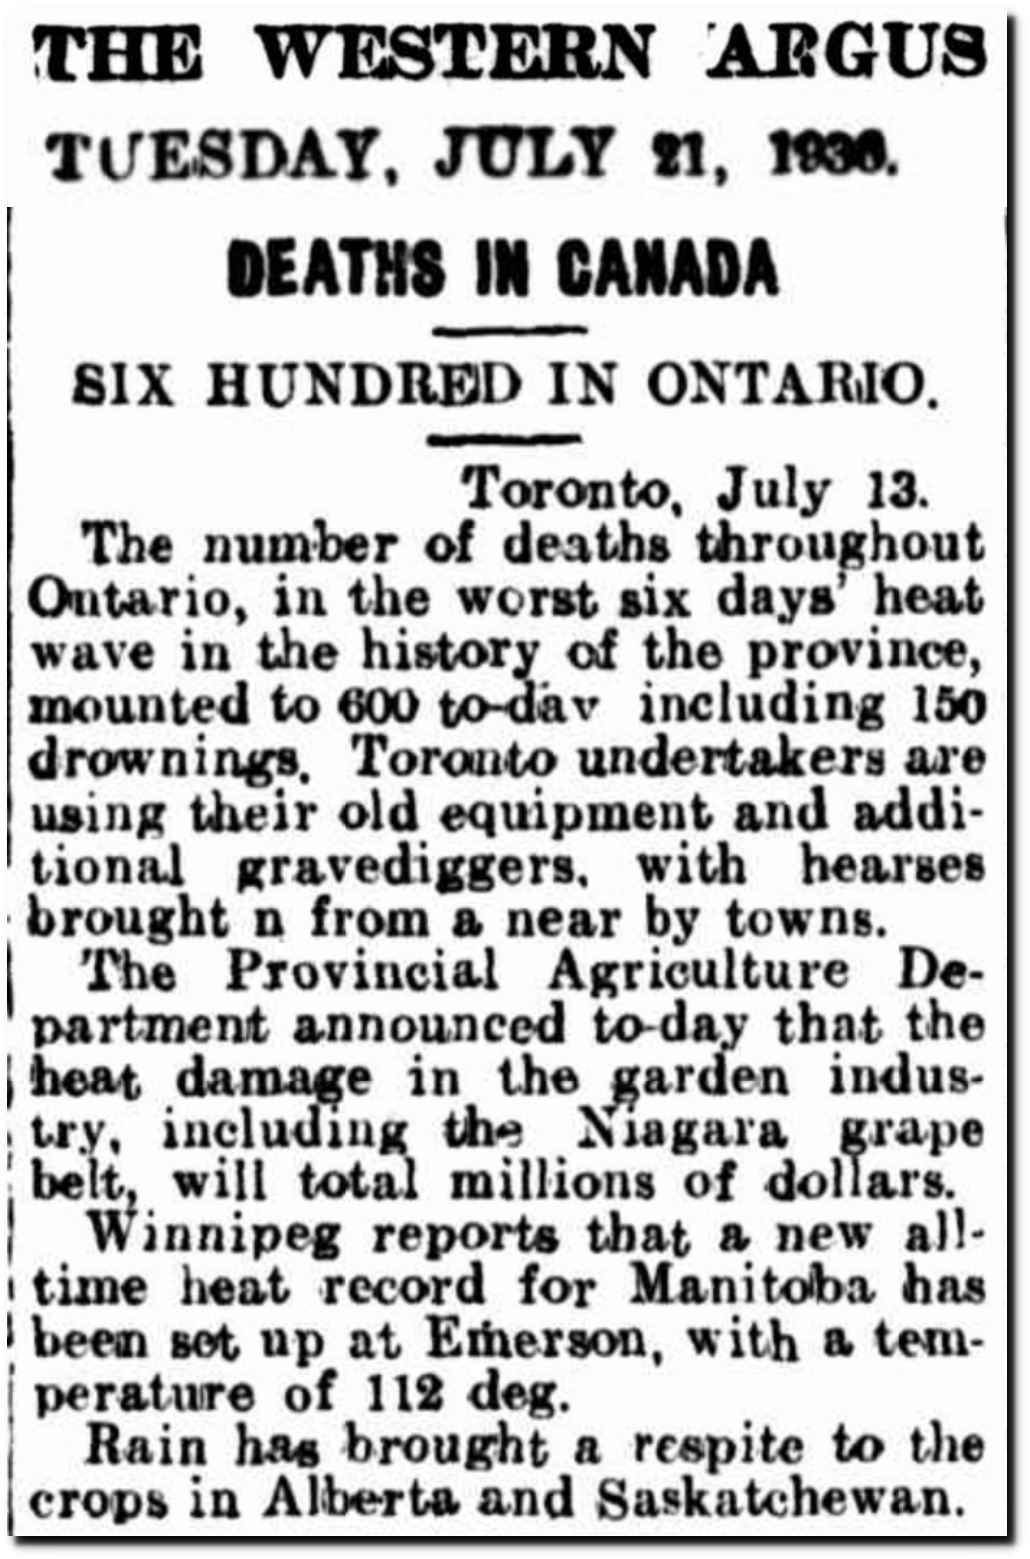
21 Jul 1936 – DEATHS IN CANADA – Trove
Fortunately, we don’t get hot weather like that any more.
Page 1 – Carroll Daily Herald at Newspapers.com
This came after the coldest February on record in the US.

14 Feb 1936 – INTENSE COLD – Trove

A few weeks later was some of the worst floods in US history.
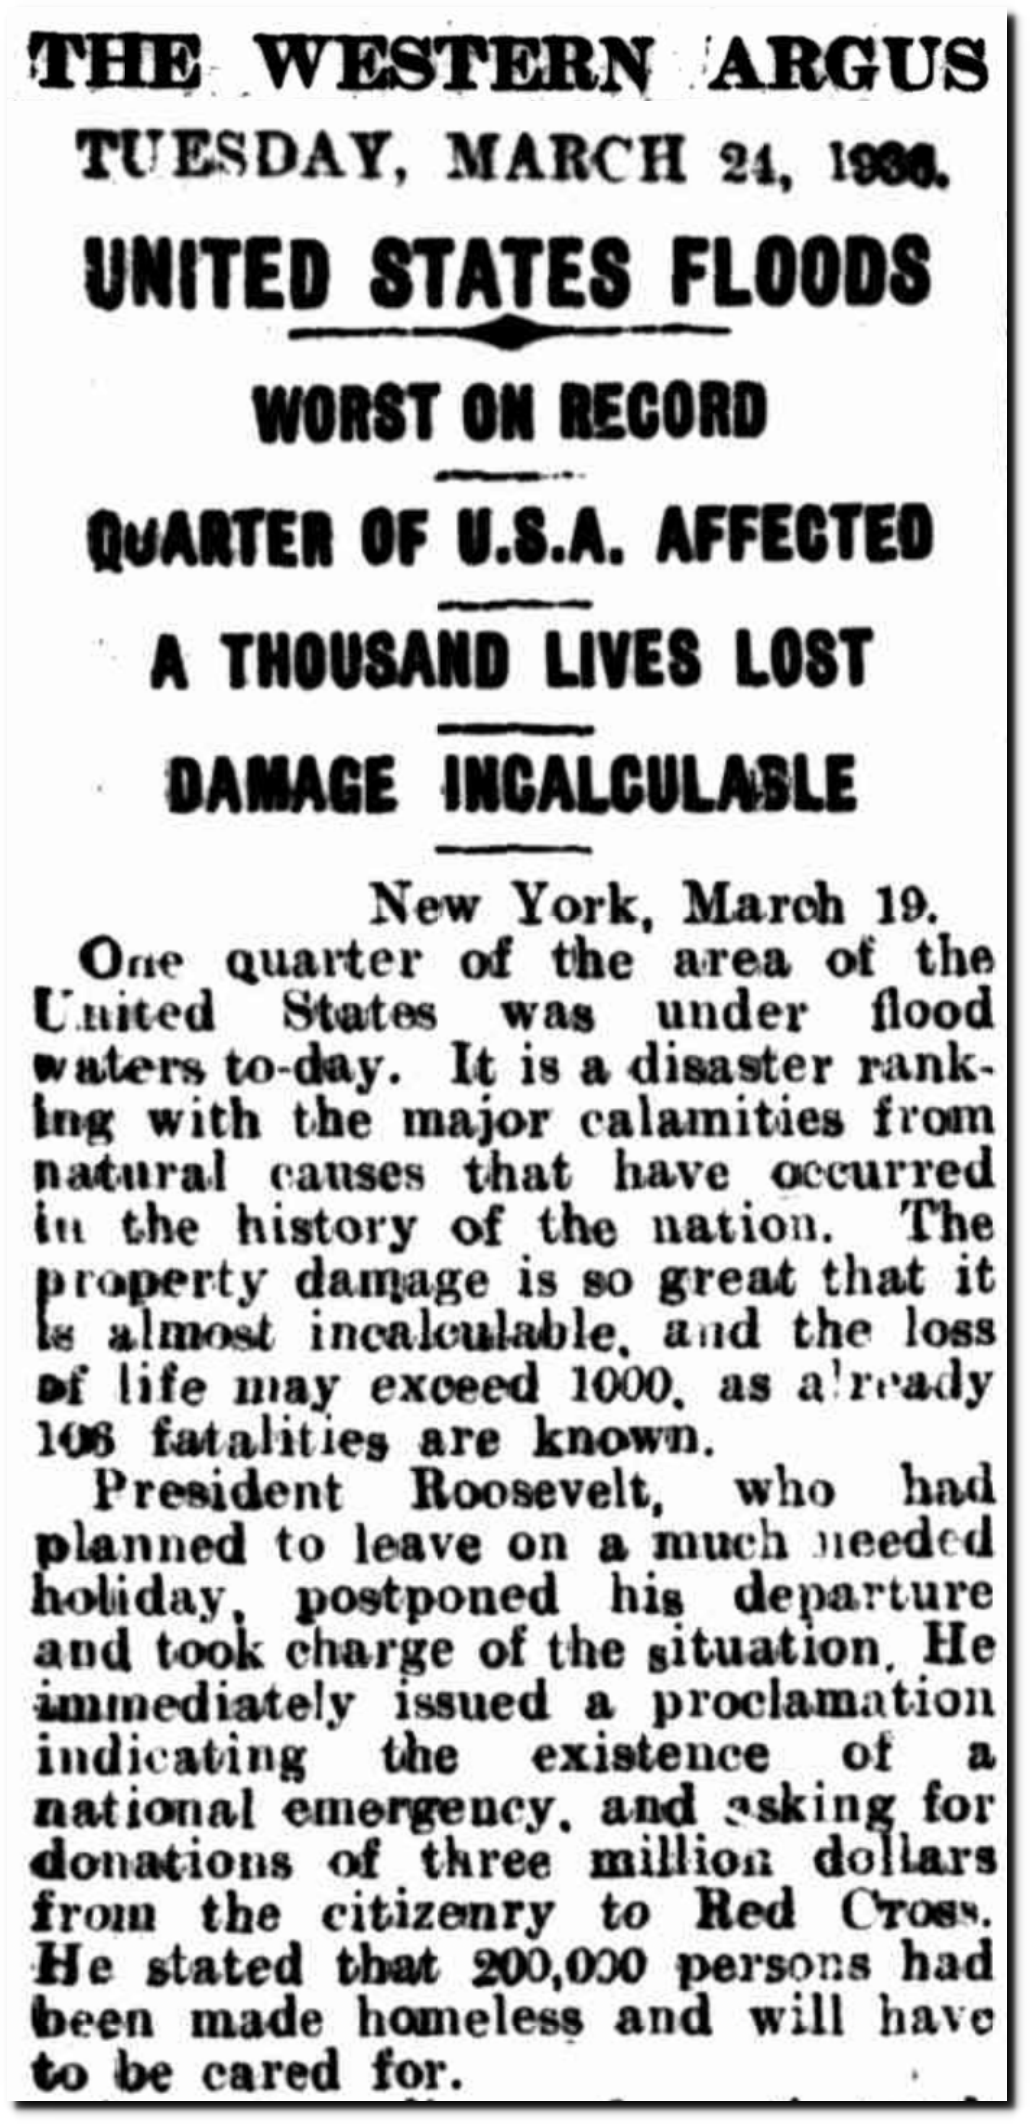
24 Mar 1936 – UNITED STATES FLOODS – Trove
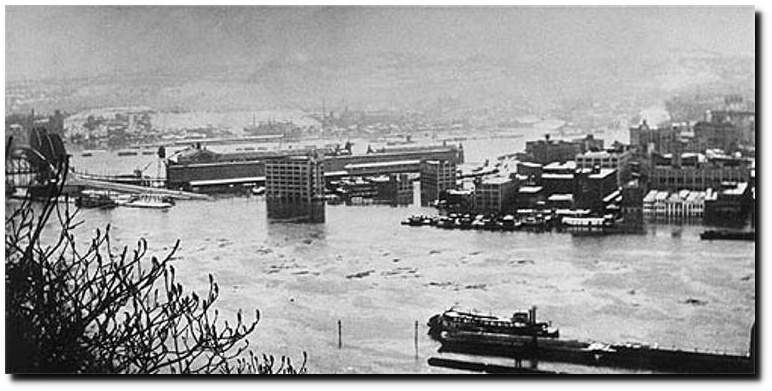
20 Mar 1936 – ALL EASTERN AMERICA UNDER FLOOD WATERS
And a few weeks after that was some of the worst tornado outbreaks in US history.
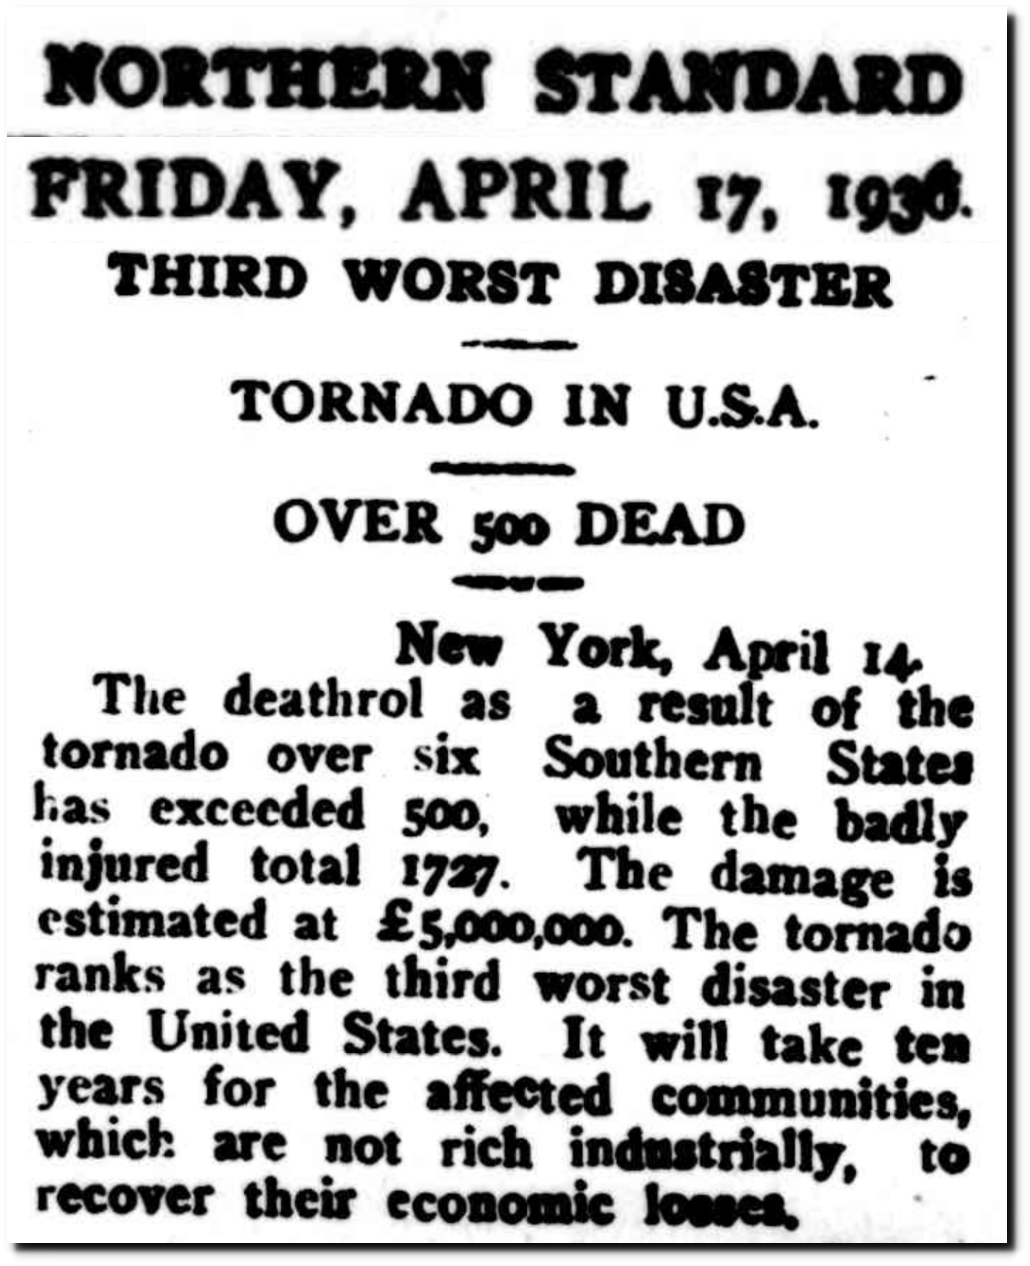
17 Apr 1936 – THIRD WORST DISASTER – Trove


11 Apr 1936, Page 1 – Weekly Town Talk
Weather disasters were striking all over the world.

25 Jul 1936 – TYPHOON SWEEPS JAPANESE ISLAND. – Trove

14 Oct 1936 – PHILIPPINES TYPHOON – Trove
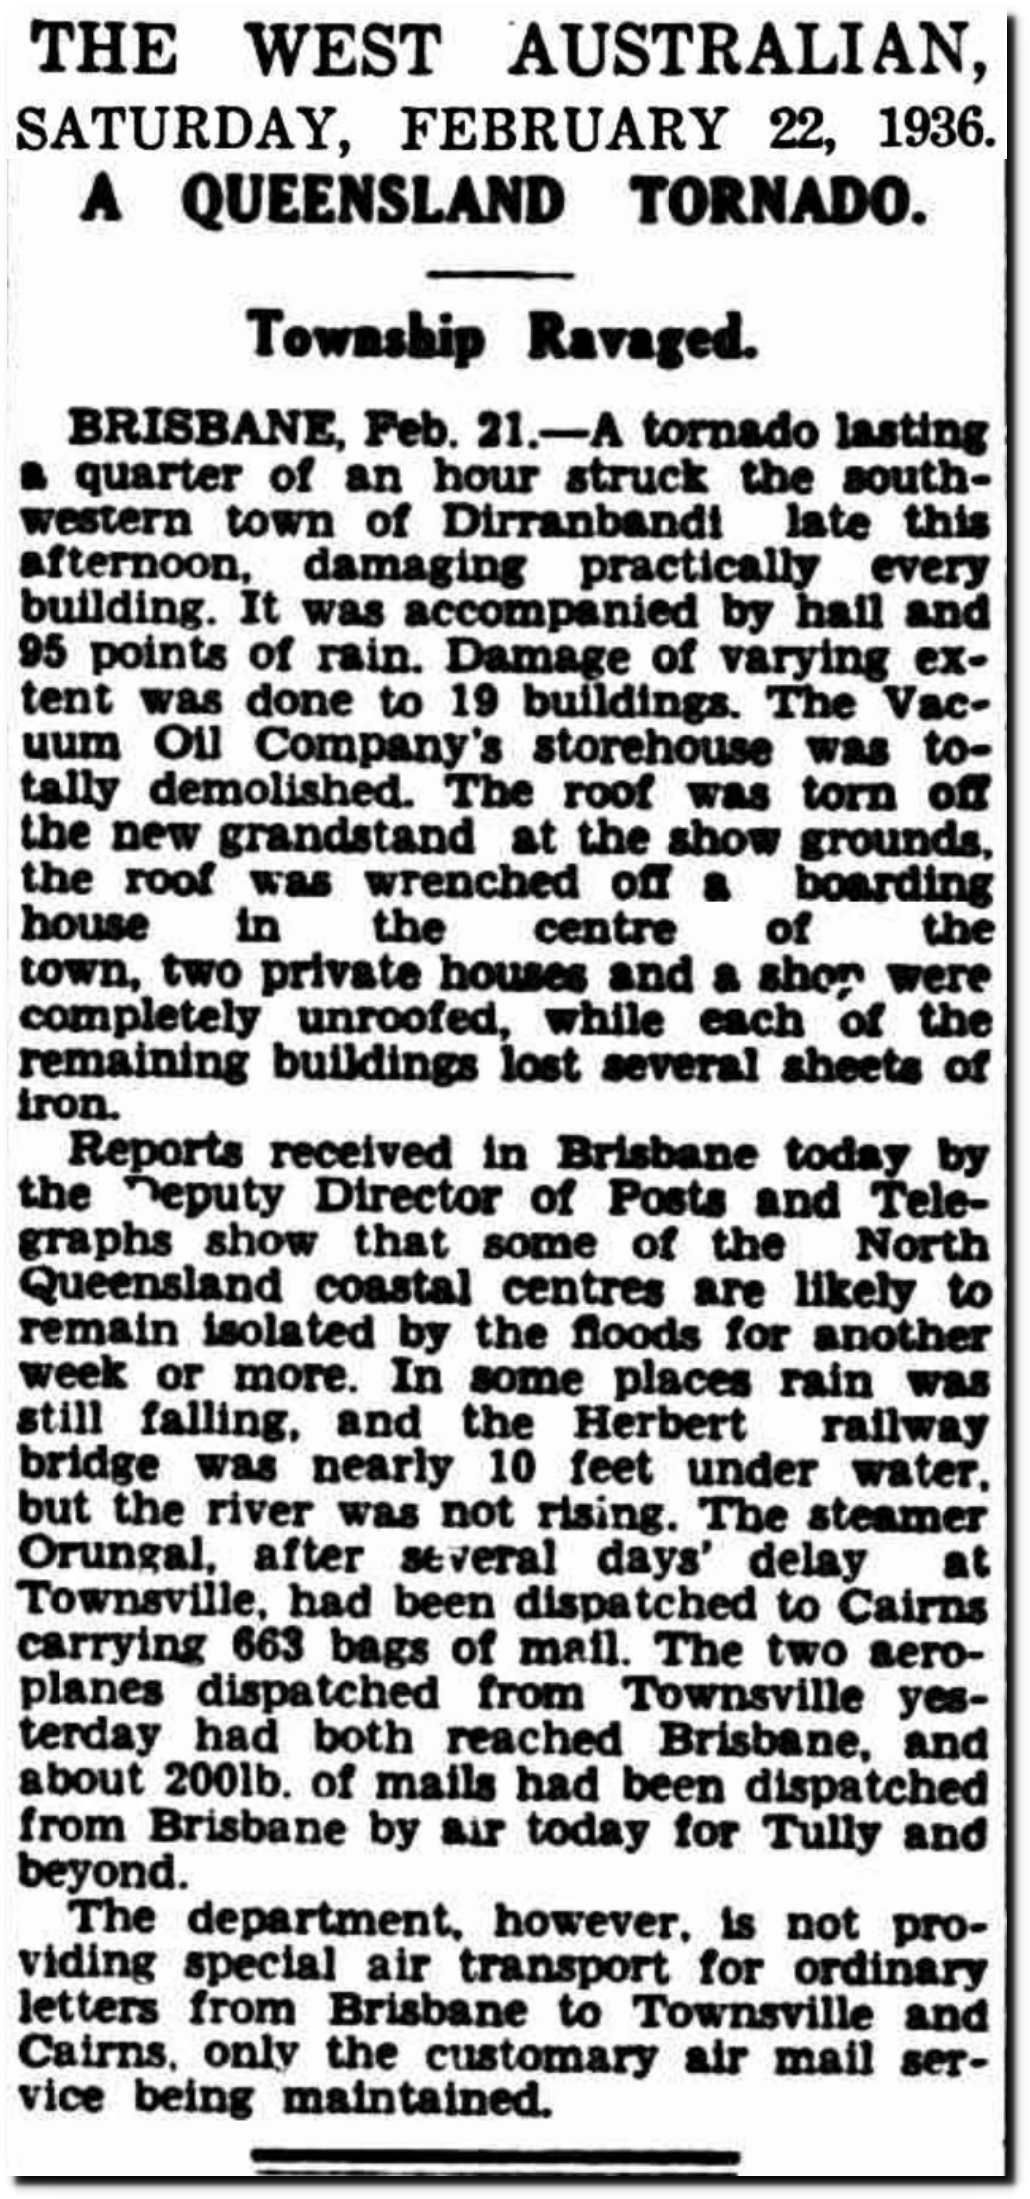
22 Feb 1936 – A QUEENSLAND TORNADO. – Trove
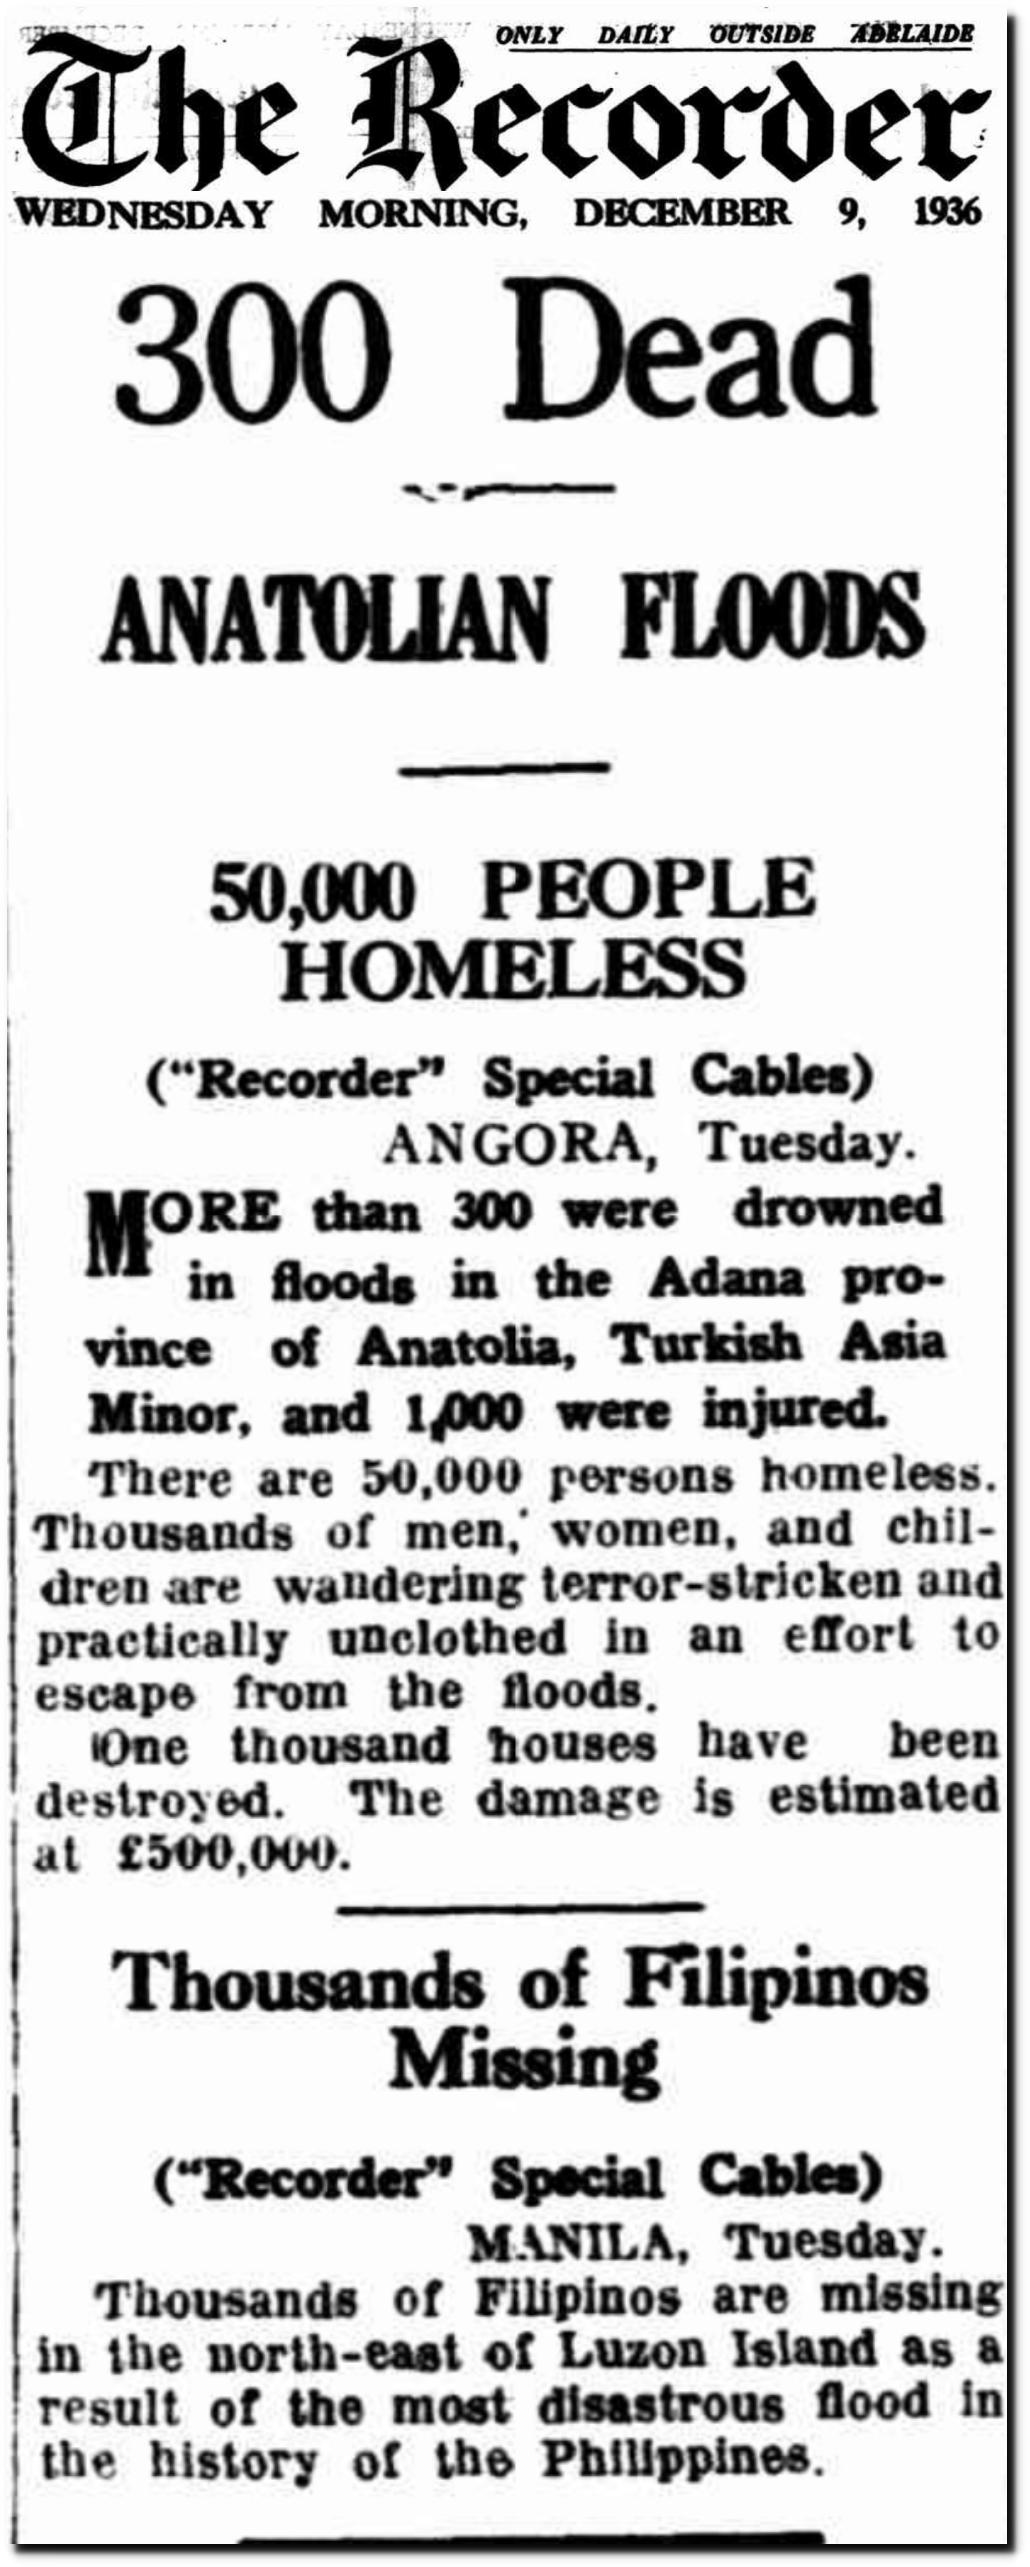
09 Dec 1936 – 300 Dead – Trove

27 Feb 1936 – Cattle Dying in Hundreds – Trove
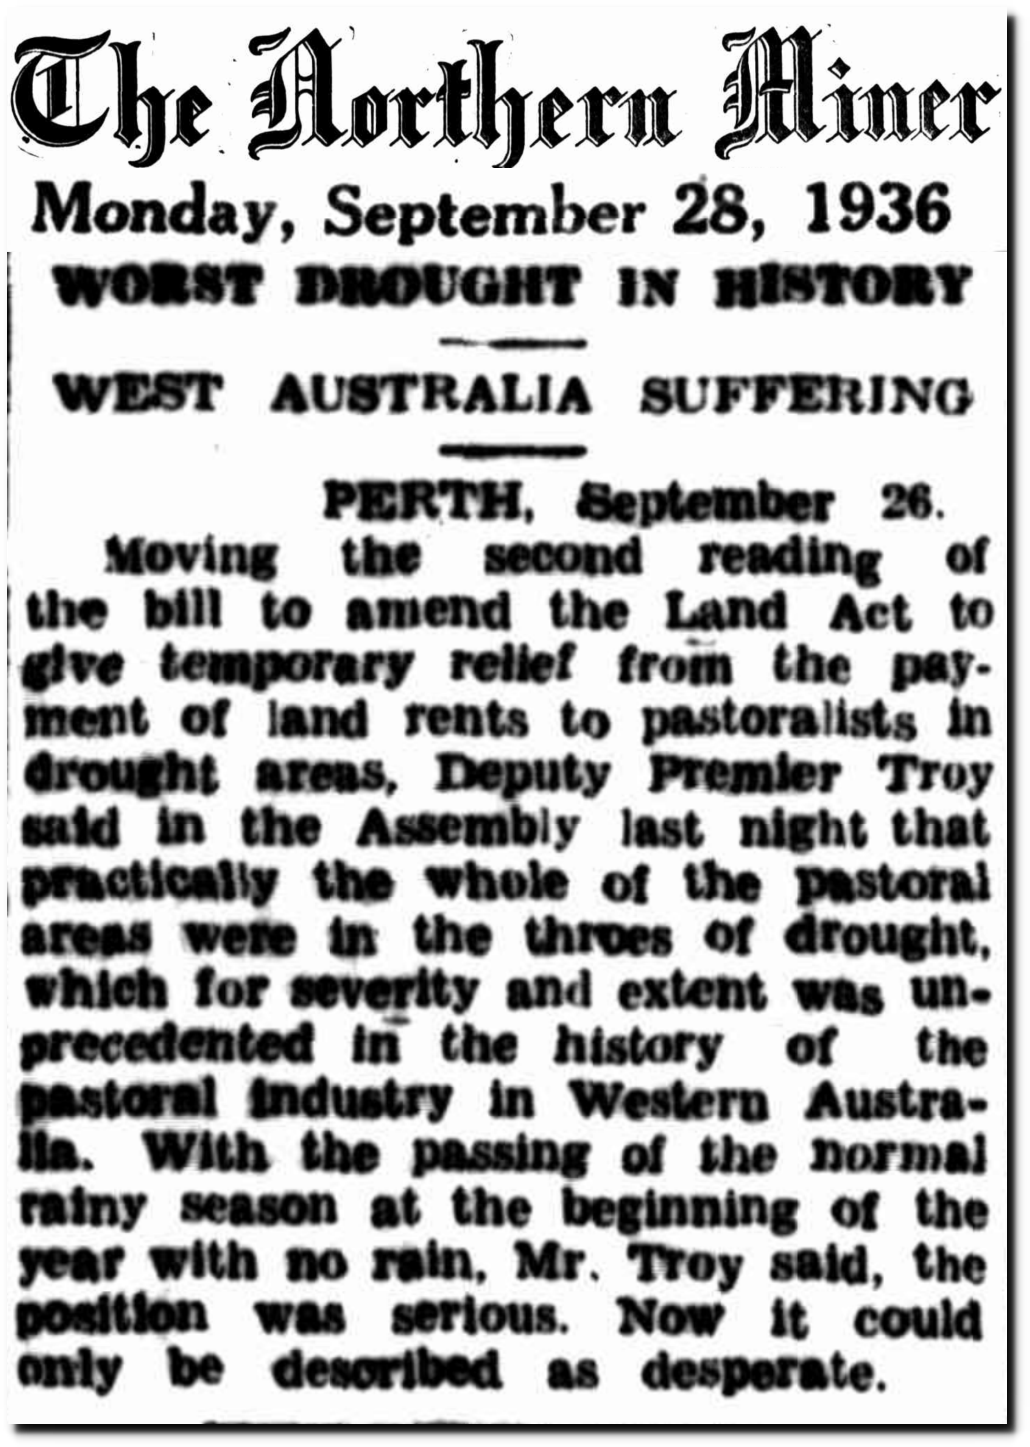
28 Sep 1936 – WORST DROUGHT IN HISTORY – Trove
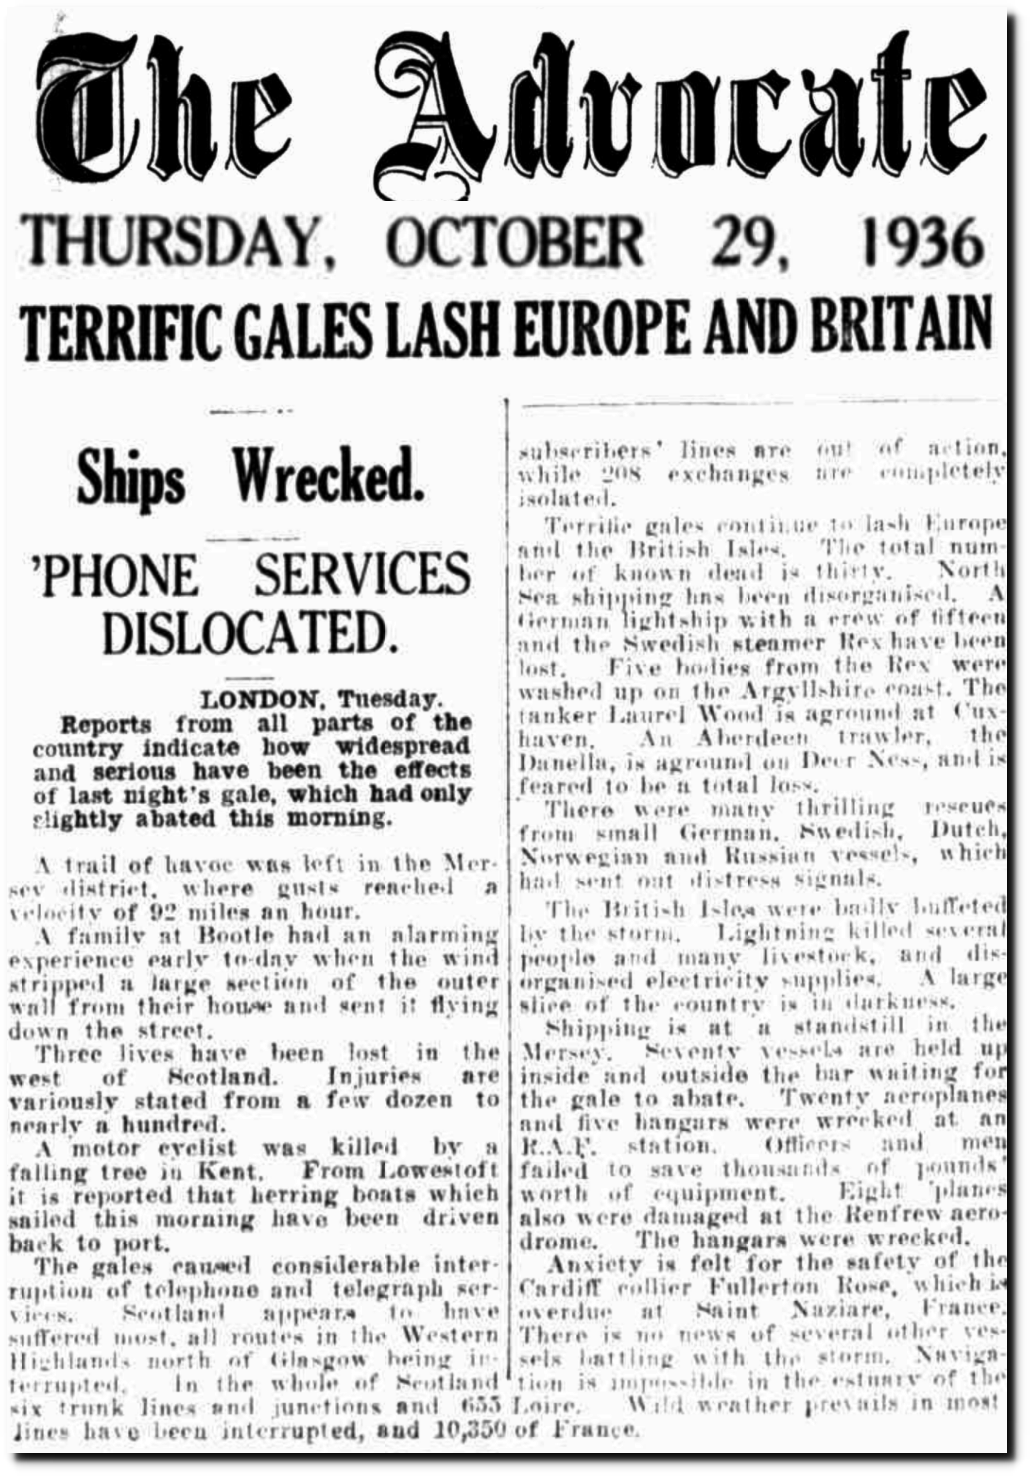
29 Oct 1936 – TERRIFIC GALES LASH EUROPE AND BRITAIN – Trove
Unlike now, the US was run by Democrats and was in a terrible economic depression. People had very real problems to deal with, and didn’t need to manufacture imaginary crises in order to keep themselves entertained.
Posted in Uncategorized
Leave a comment
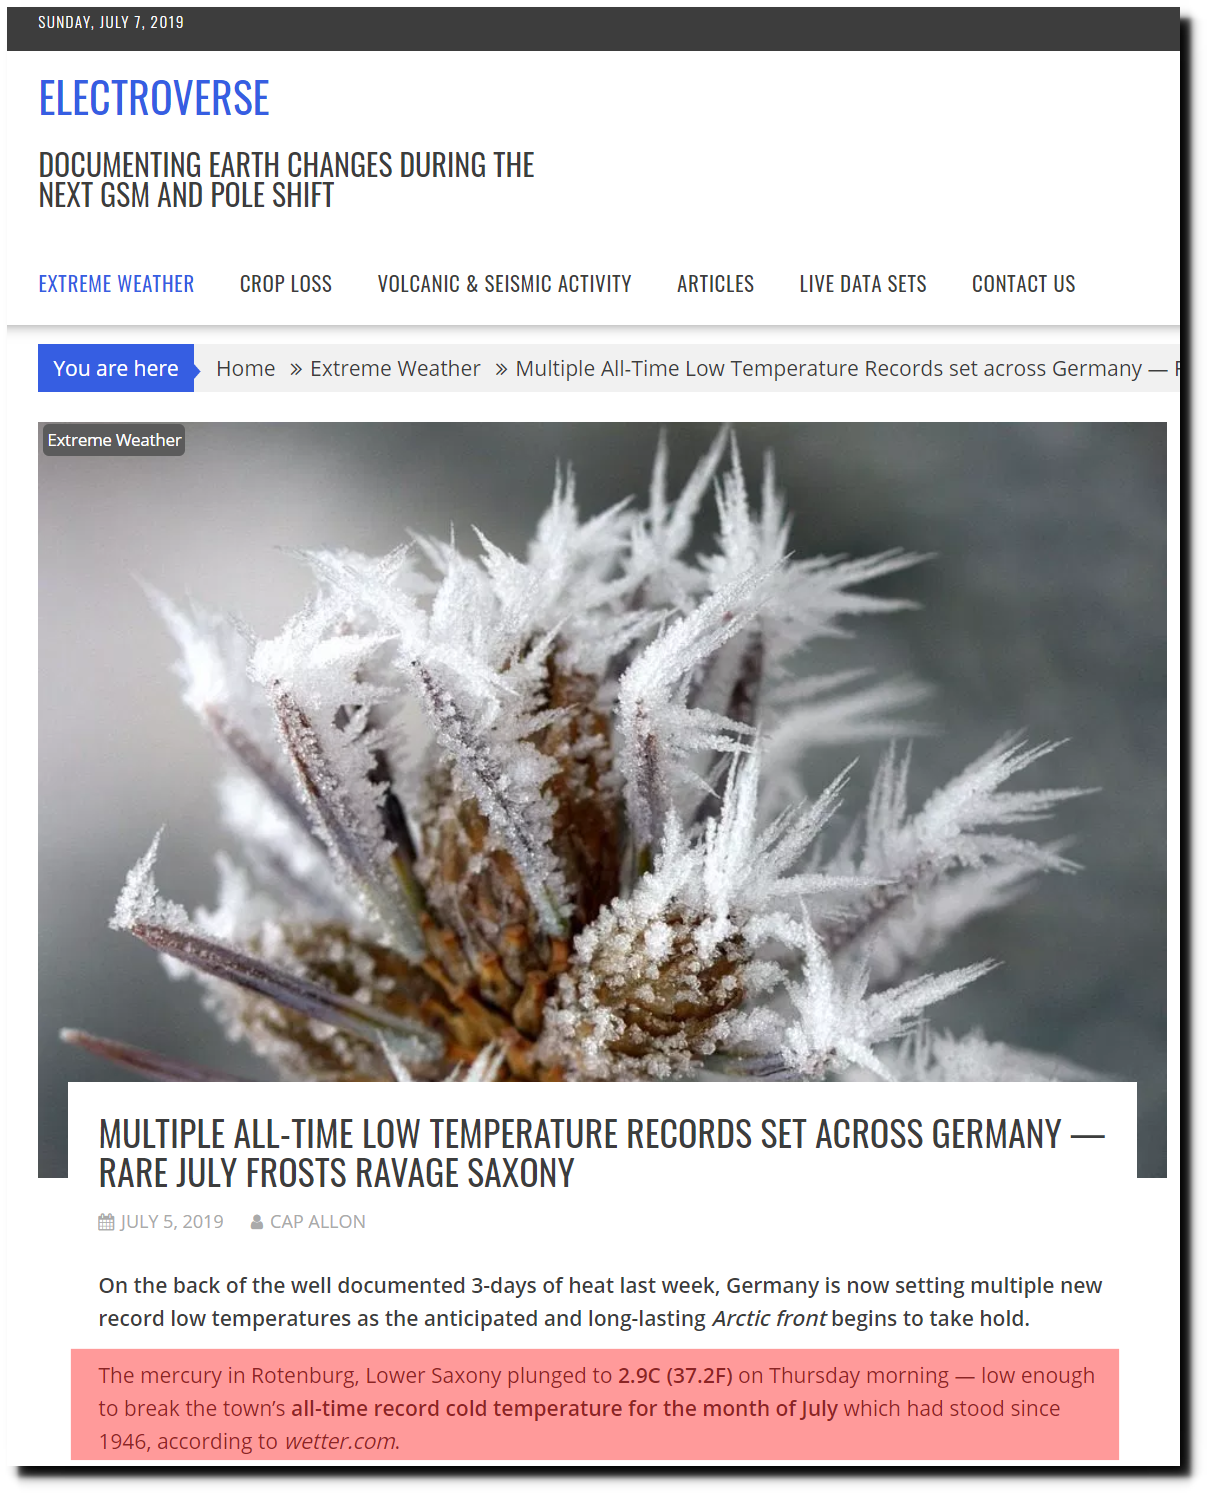
European Heatwave Update
Europe is experiencing record cold, and the Washington Post says leaders must take the “scorching heat” seriously.

Posted in Uncategorized
Leave a comment
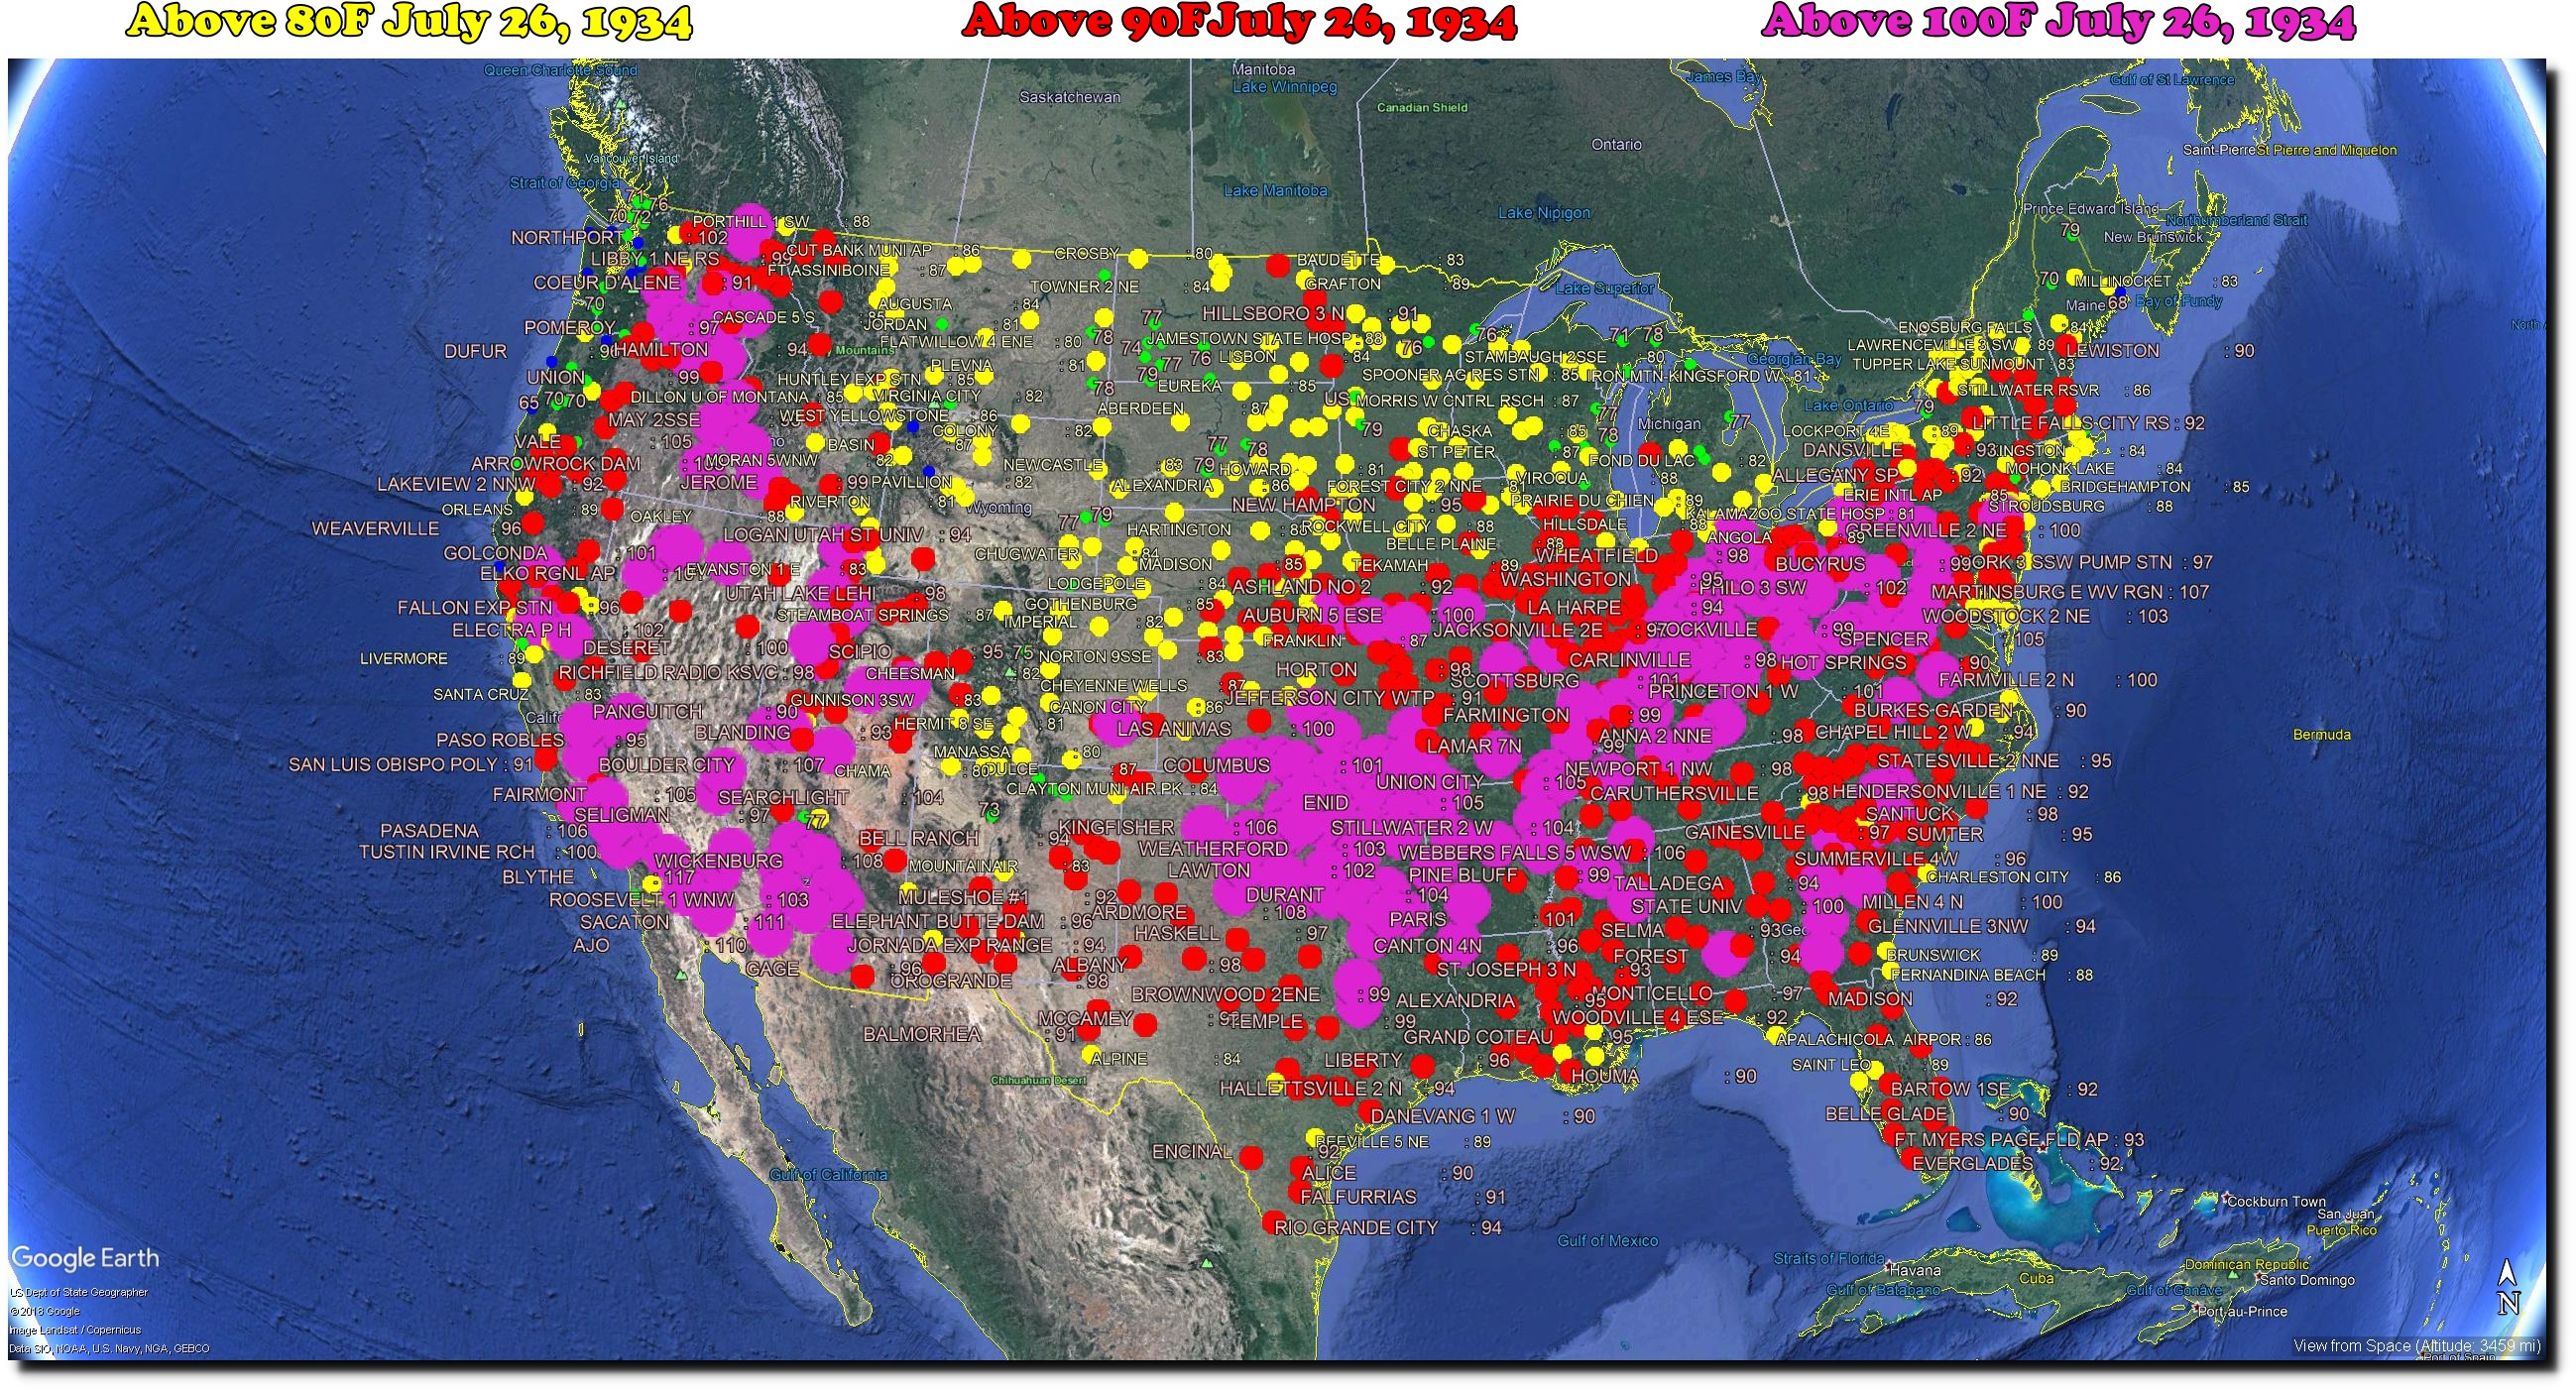
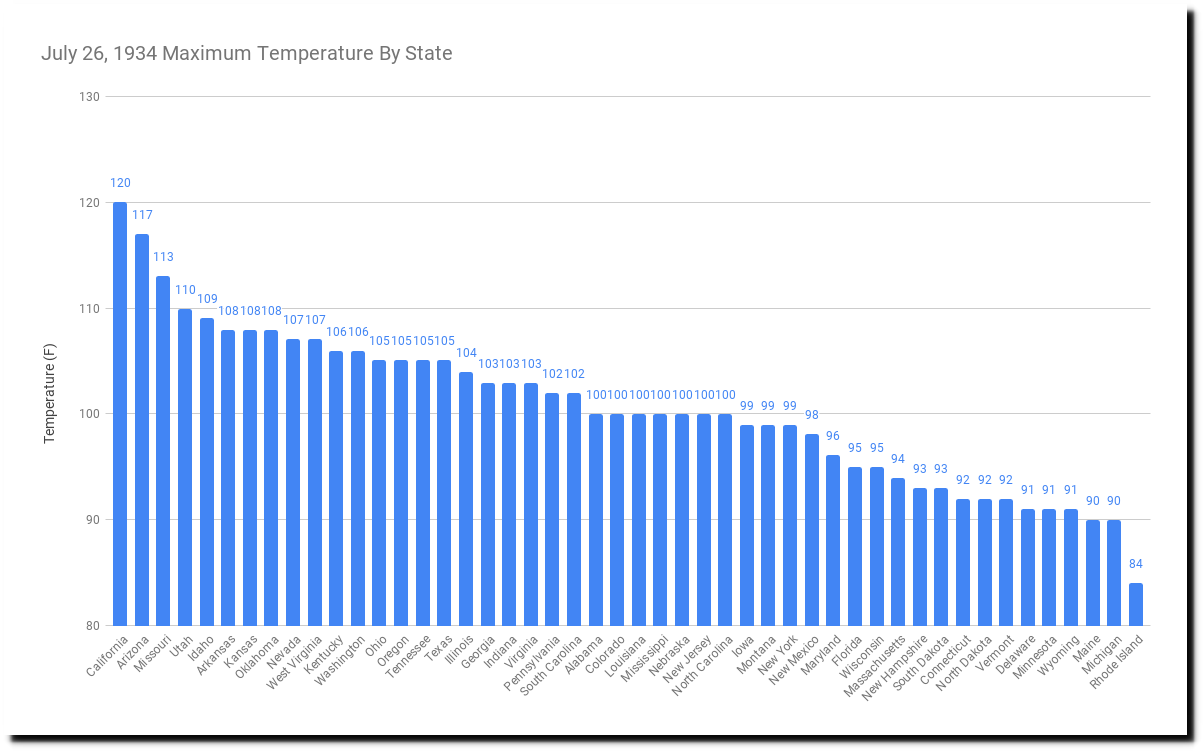
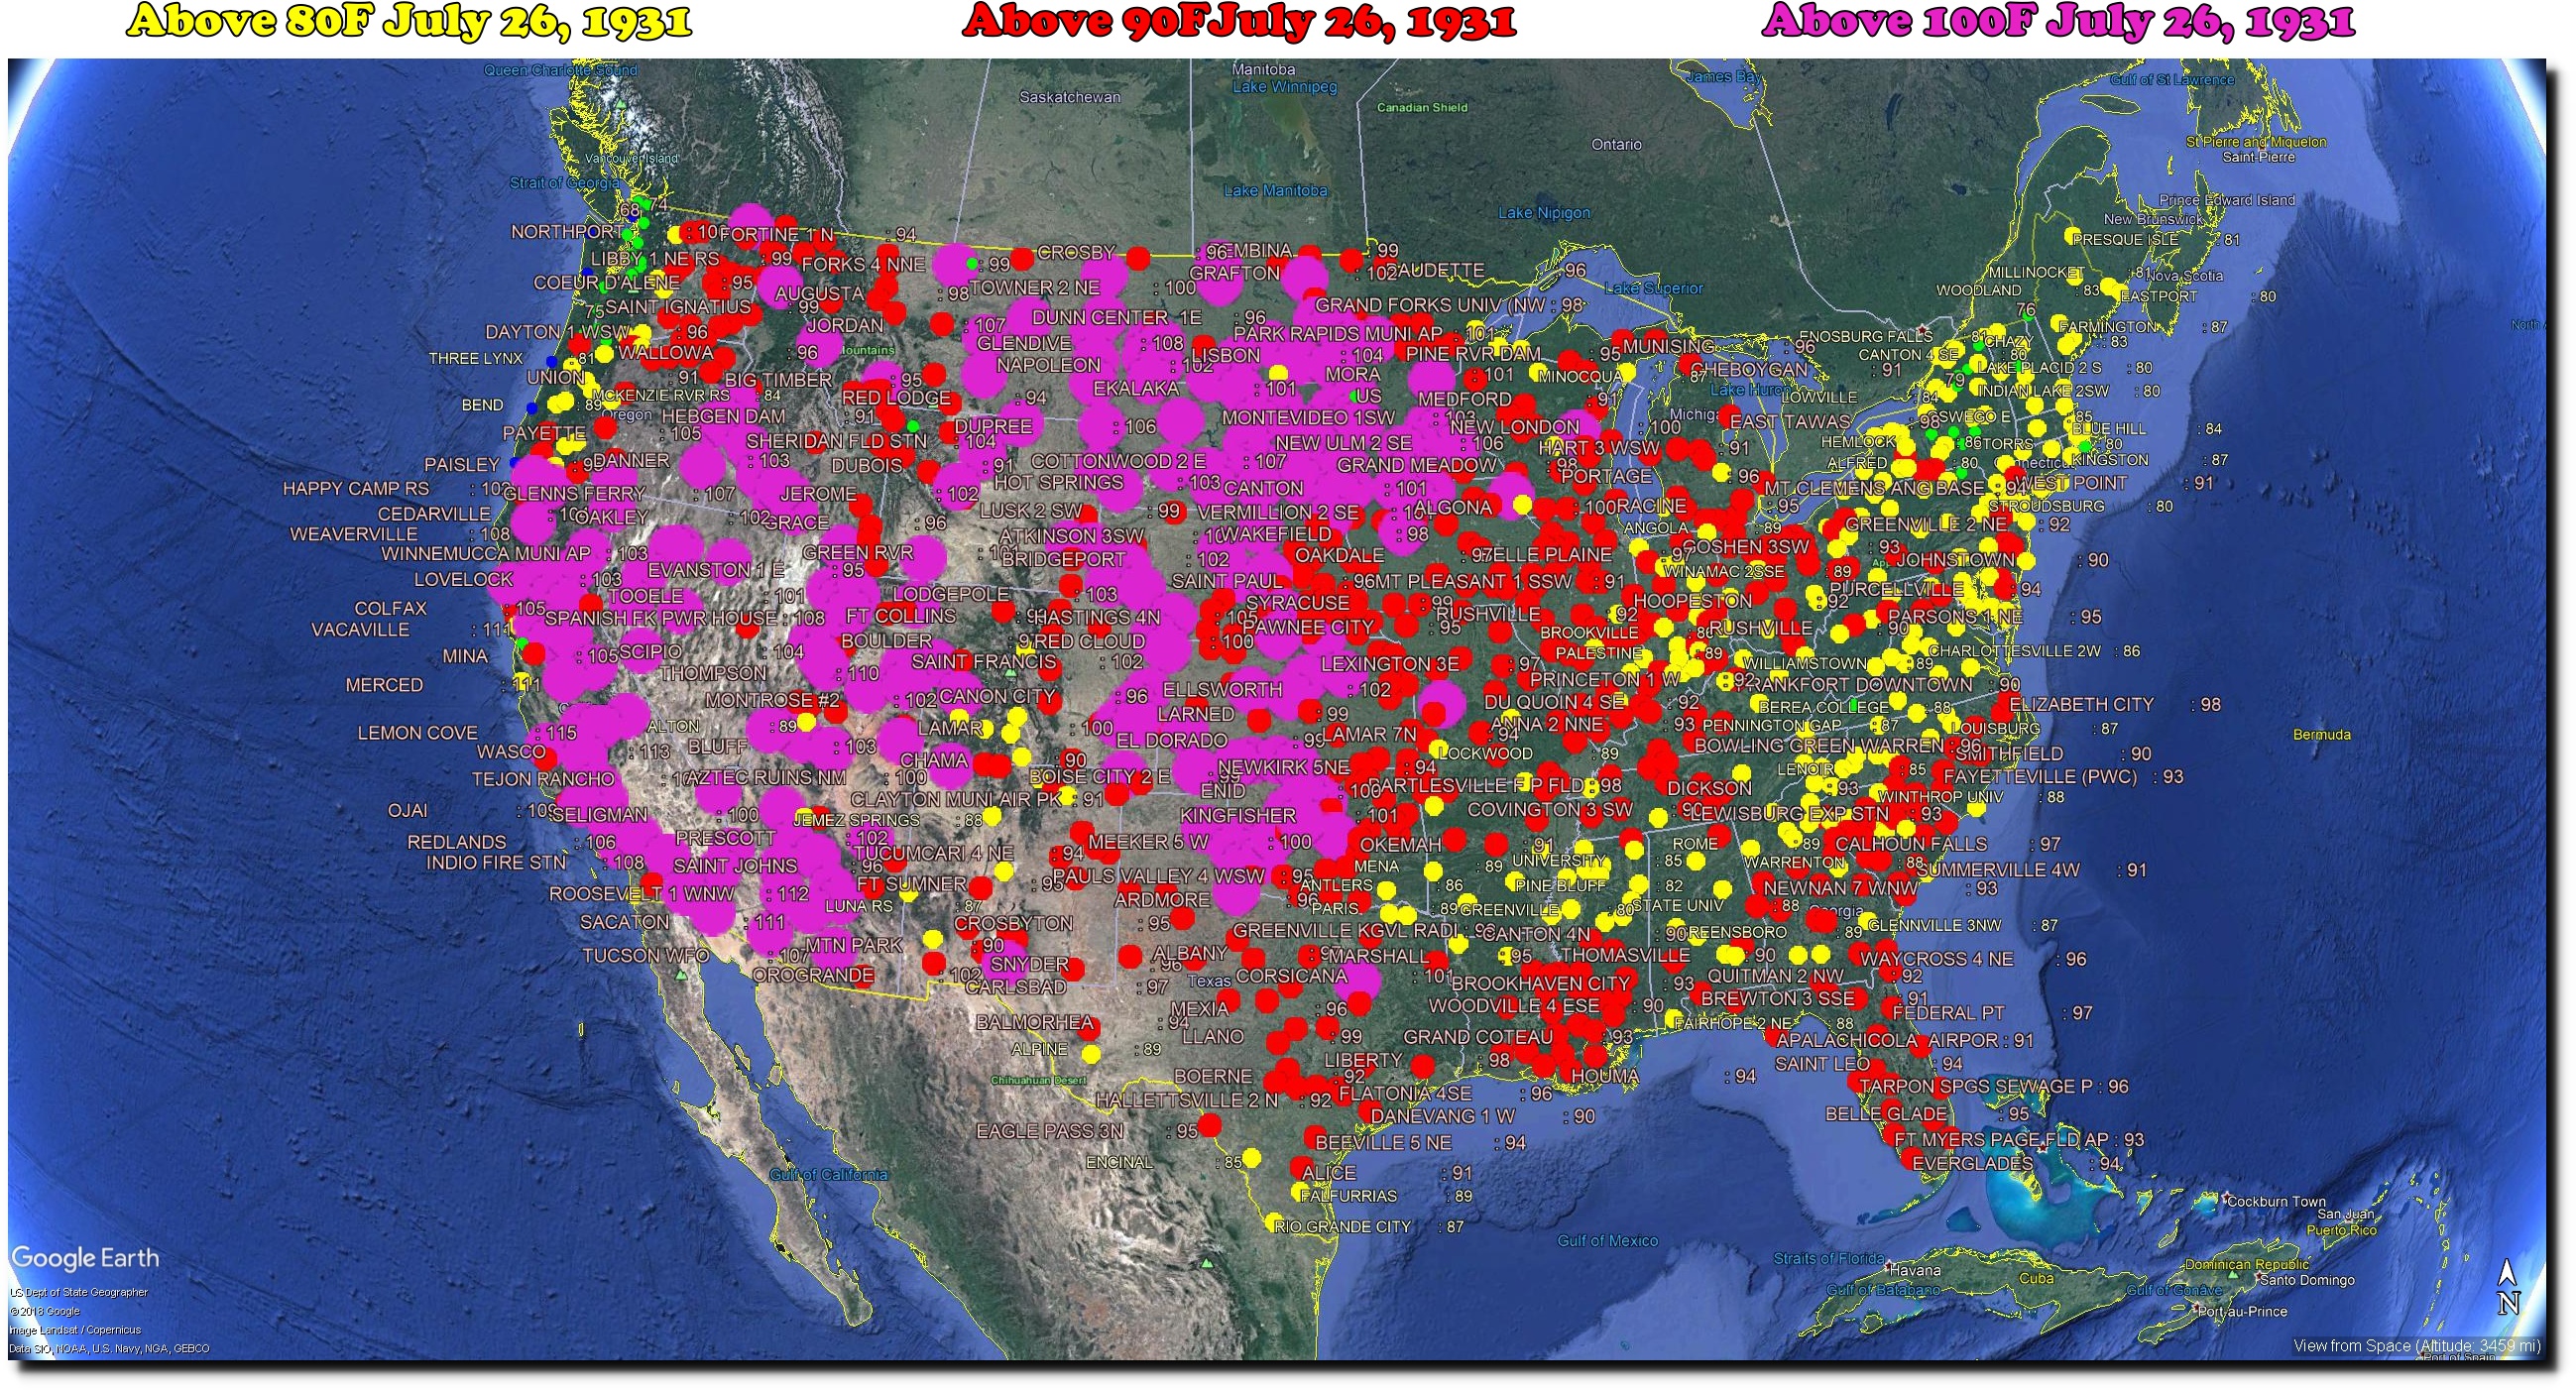
1934 : 100 Degrees In Alaska
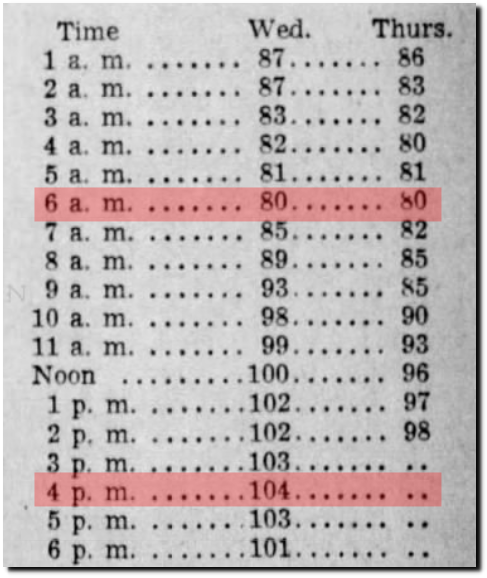
On July 26, 1934, thirty states (including Alaska) were over 100 degrees. The only state which didn’t make it above 90 degrees was Rhode Island. Many people died, and Dayton, Ohio never cooled below 80 degrees over a two day period.
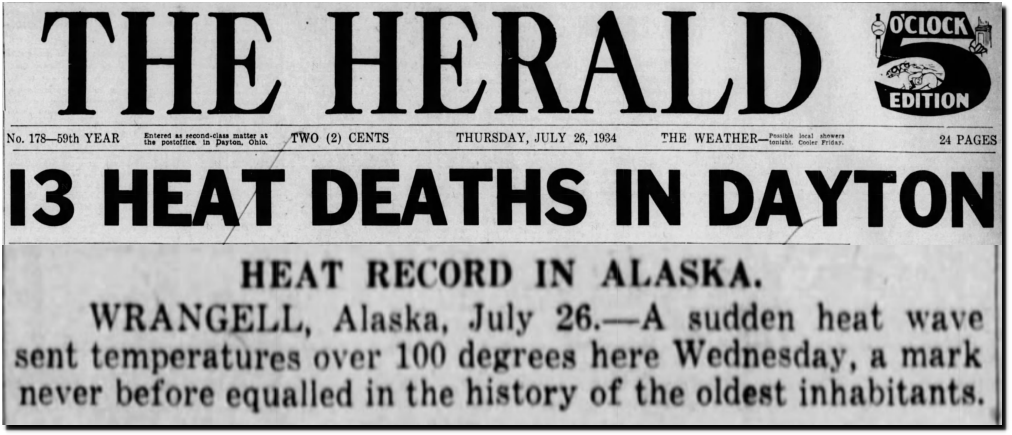
26 Jul 1934, 1 – The Dayton Herald at Newspapers.com
But 1934 wasn’t hottest July 26 – 1930, 1931, 1936, 1939, 1952 and 1914 were all hotter.

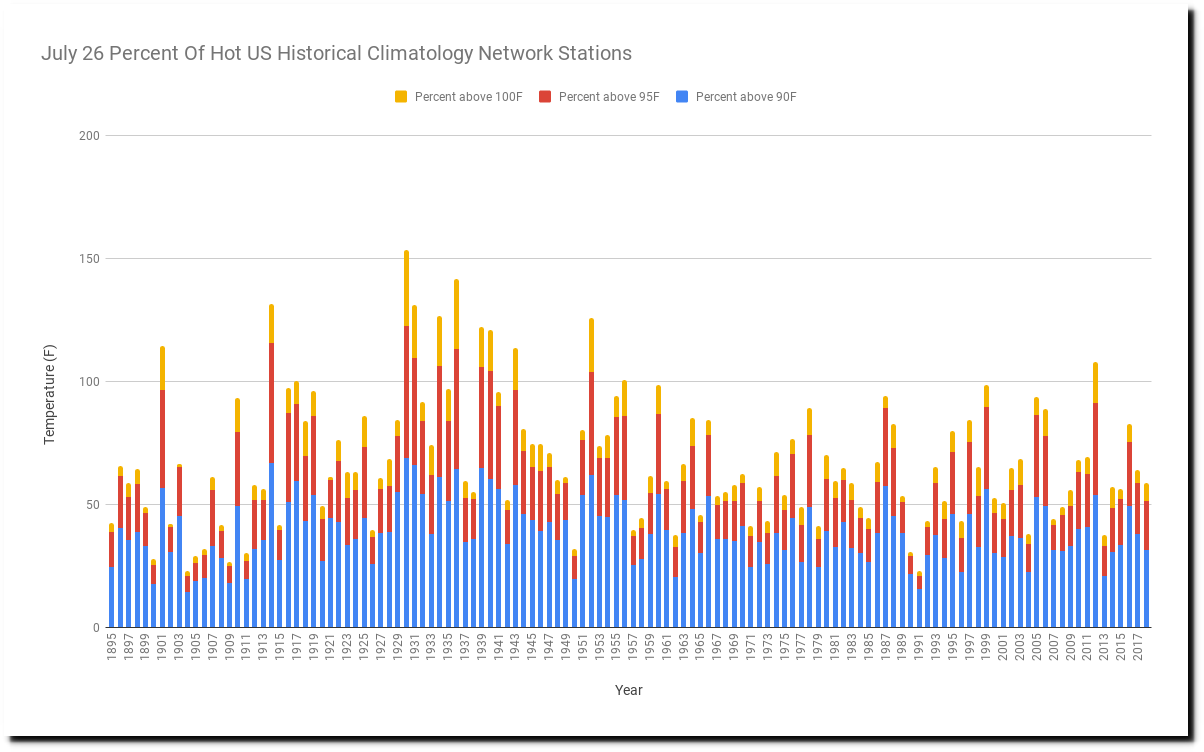
There hasn’t been a really hot July 26 in over 60 years, and weather as hot as the 1930’s is inconceivable now.

On July 14, 1915 – Juneau, Alaska was 90 degrees.
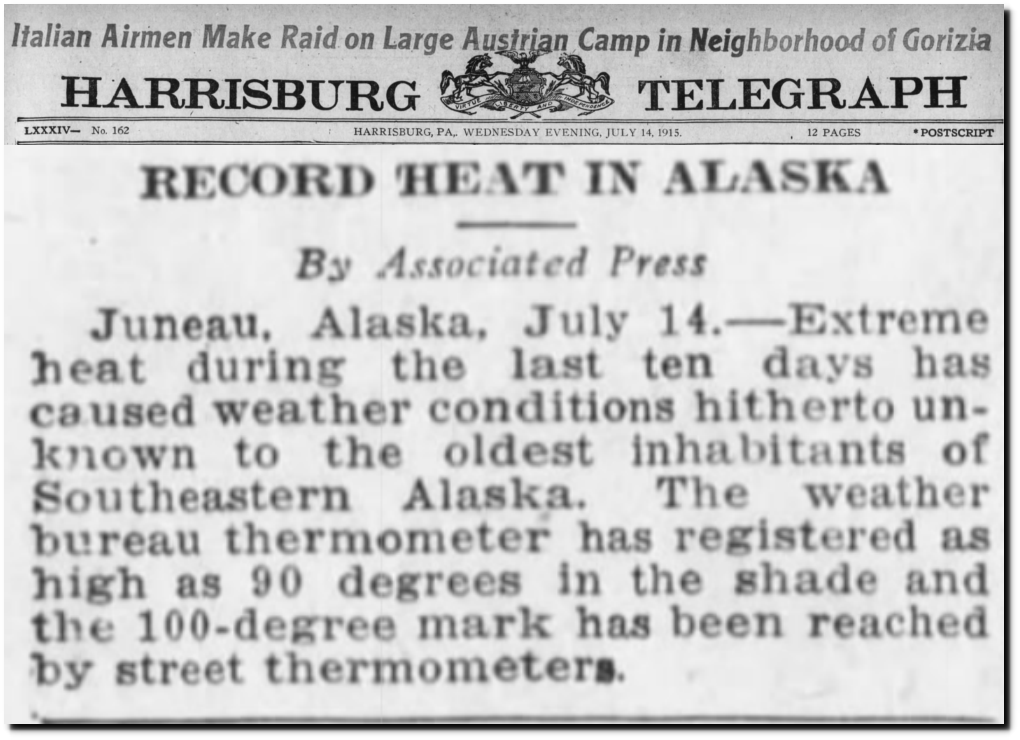
14 Jul 1915, Page 1 – Harrisburg Telegraph at Newspapers.com
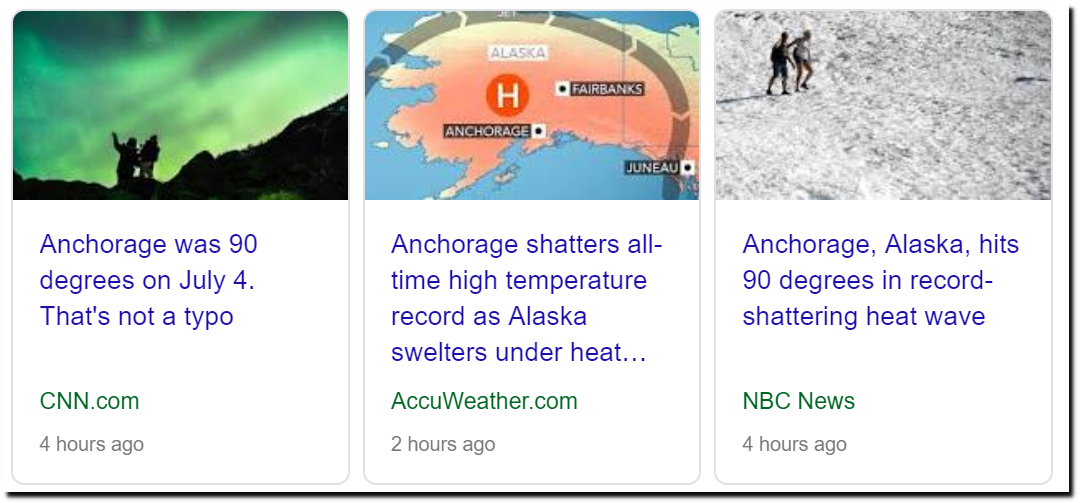
But the press is certain that 90 degrees in southern Alaska is a sign of the apocalypse. They scan the globe for one localized hot temperature to prove that weather is climate.
Posted in Uncategorized
Leave a comment
Still No Ships In The Arctic ….
Sixty years ago, the New York Times predicted an ice-free Arctic and ships sailing over the North Pole within a generation.

TimesMachine: October 19, 1958 – NYTimes.com
Fifty years ago, they predicted an ice-free Arctic by 1989, with catastrophic shifts in the climate.
Expert Says Arctic Ocean Will Soon Be an Open Sea – Catastrophic Shifts in Climate Feared
It is now July, and there are no ships traversing the Arctic. Perhaps the ship captains forgot to read the New York Times.
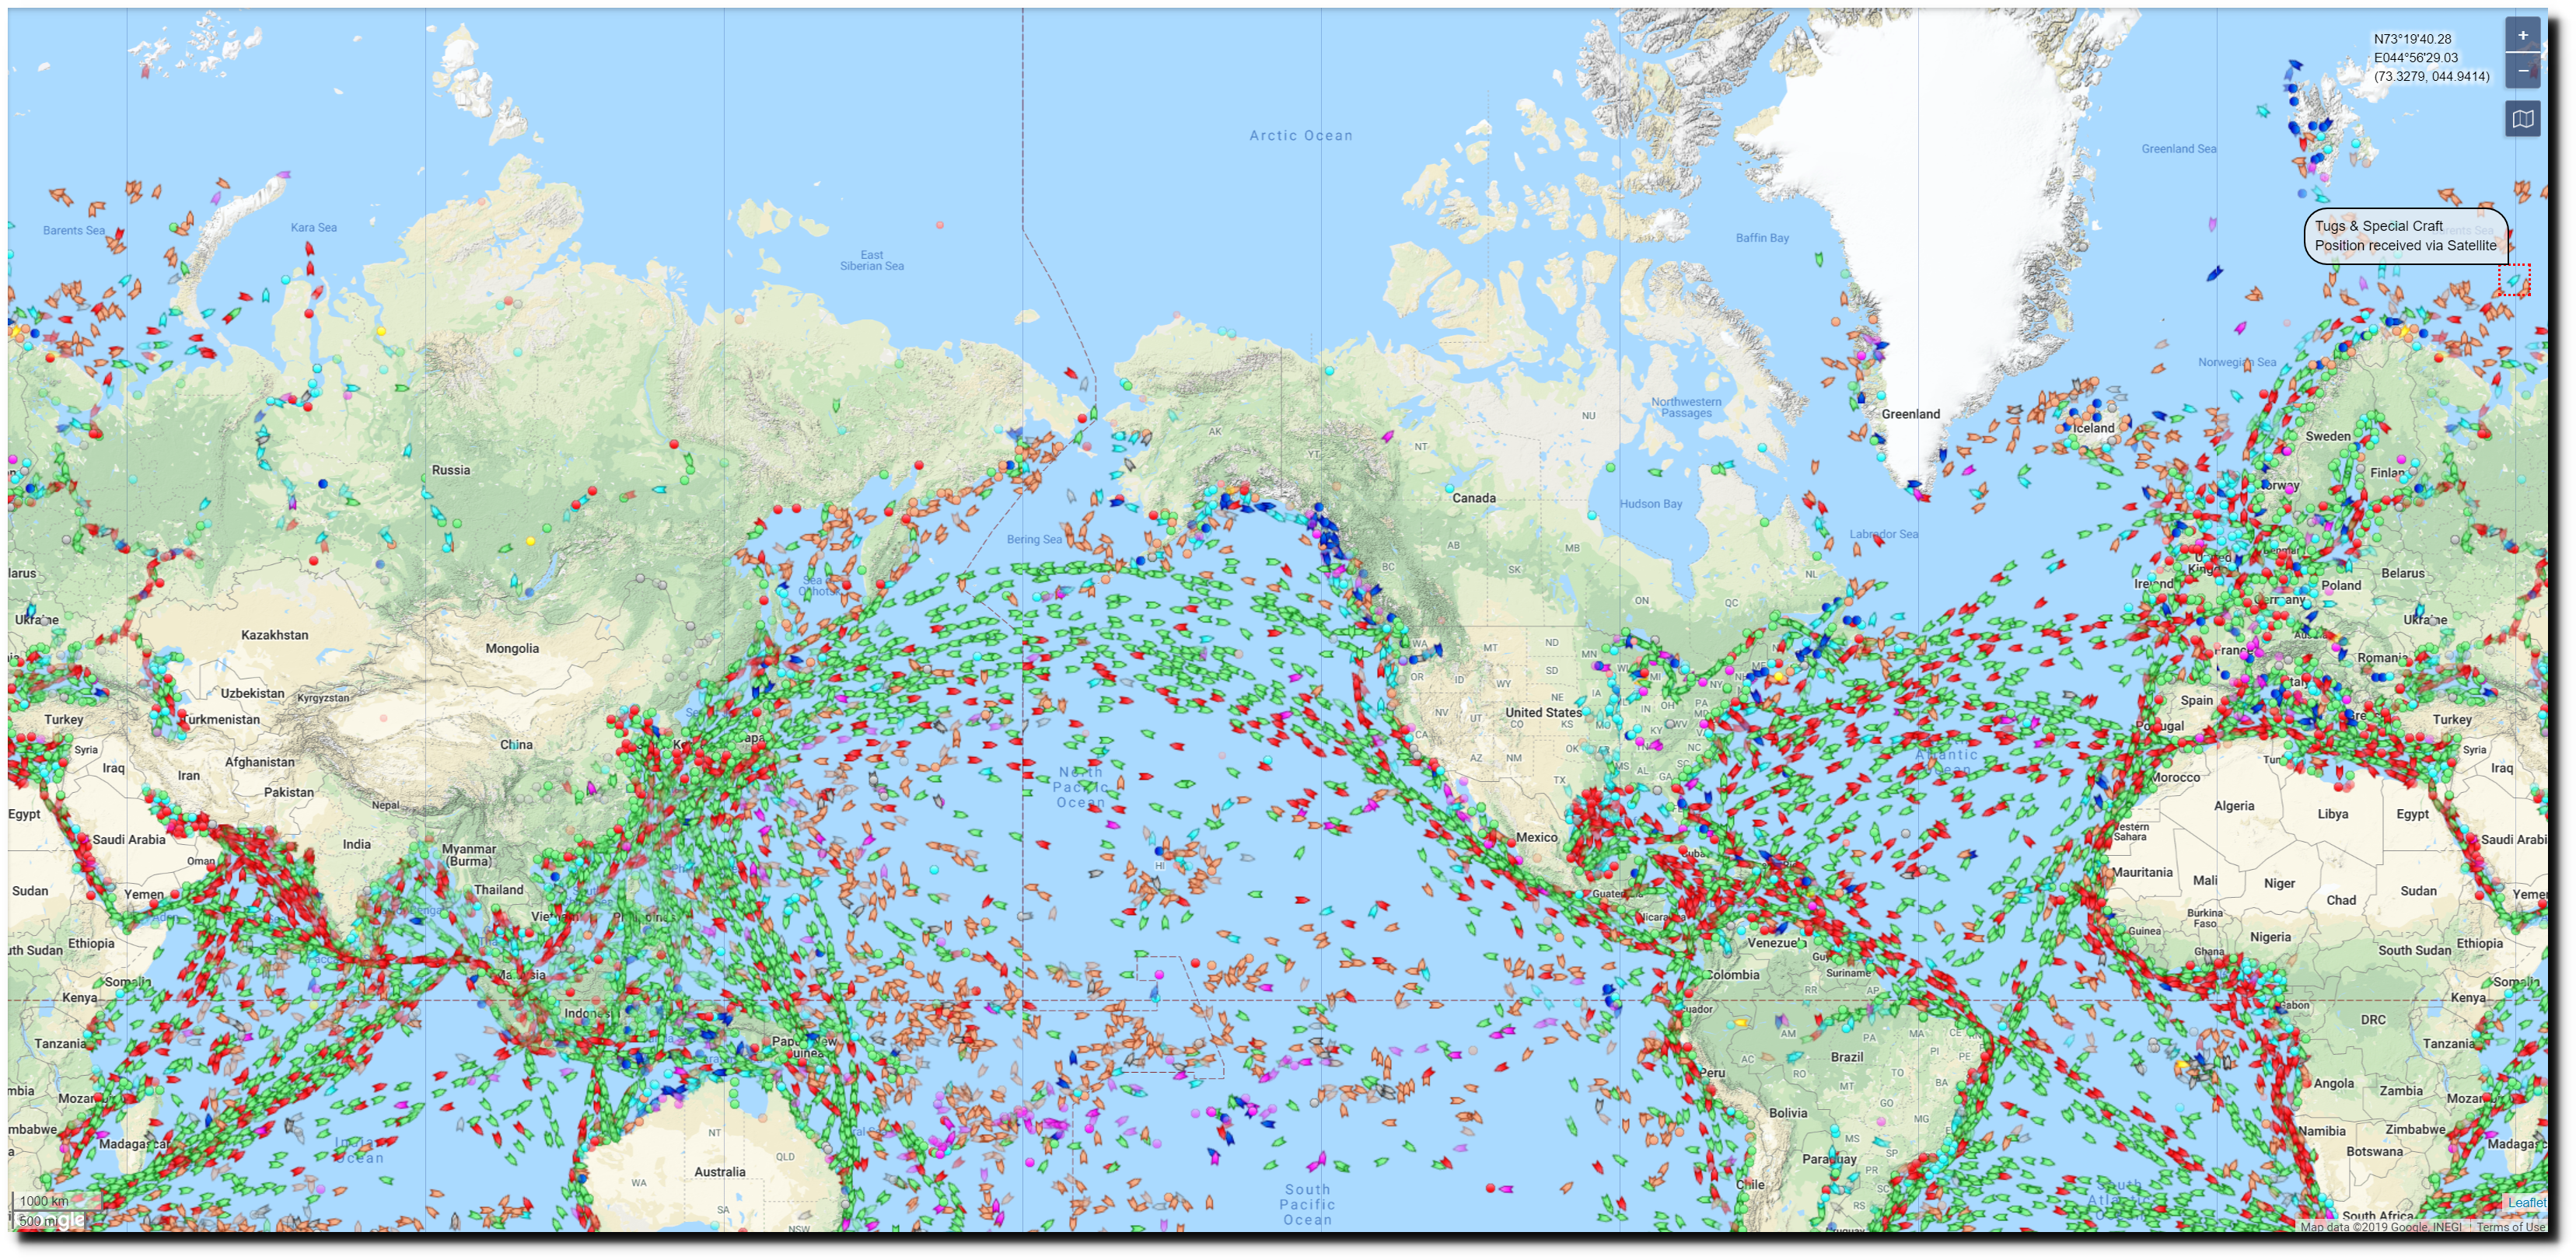
MarineTraffic: Global Ship Tracking Intelligence | AIS Marine Traffic
Posted in Uncategorized
Leave a comment