The Associated Press says 1.2 million acres of grassland fires in Texas in 2024 is larger than a ten million acre forest fire in 1903.
“STINNETT, Texas (AP) — Wildfires may have destroyed as many as 500 structures in the Texas Panhandle, Republican Gov. Greg Abbott said Friday, describing how the largest blaze in state history scorched everything in its path, leaving ashes in its wake.
Texas officials warned that the threat was not yet over. Higher temperatures and stronger winds forecast for Saturday elevated worries that fires in the Panhandle could spread beyond the more than 1,700 square miles (4,400 square kilometers) already chewed up this week by fast-moving flames.”

Gov. Abbott says Texas wildfires may have destroyed up to 500 structures | AP News
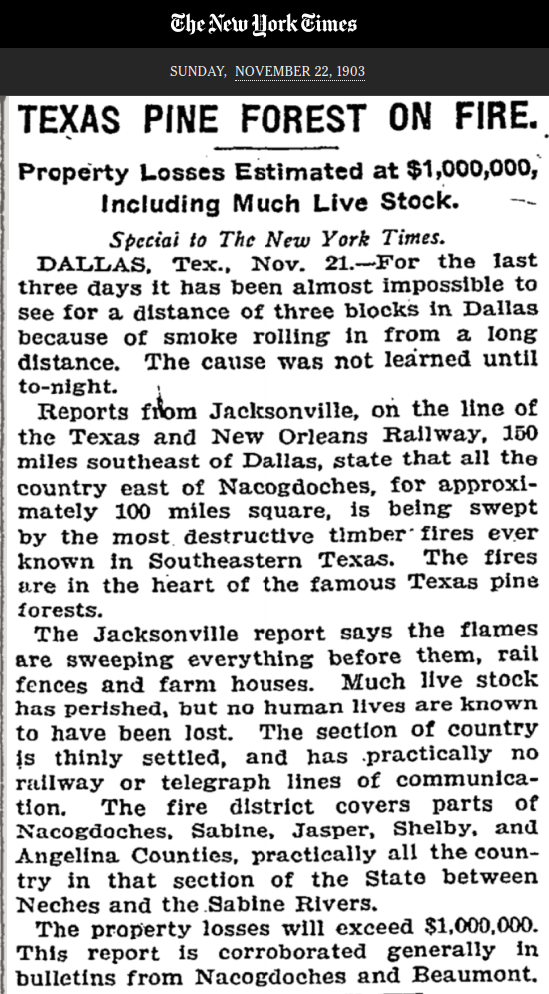
TimesMachine: November 22, 1903 – NYTimes.com

National Fire News | National Interagency Fire Center
The 1903 Fire came a few weeks after large scale flooding in the eastern US

14 Oct 1903 – FLOODS IN AMERICA. – Trove
Weather Underground has taken the big lie even further.
“Texas Wildfire Now Second-Largest In U.S. History”

Cheyenne, WY 10-Day Weather Forecast | Weather Underground
During February 1898 three million acres burned in South Carolina and there were much larger fires in Colorado later in the year.
This week in 1898, the United States, Australia and New Zealand were all experiencing massive forest fires. Three million acres of the Carolinas burned in just a few hours – in the middle of winter. Later that year the northwest quadrant of Colorado was on fire.
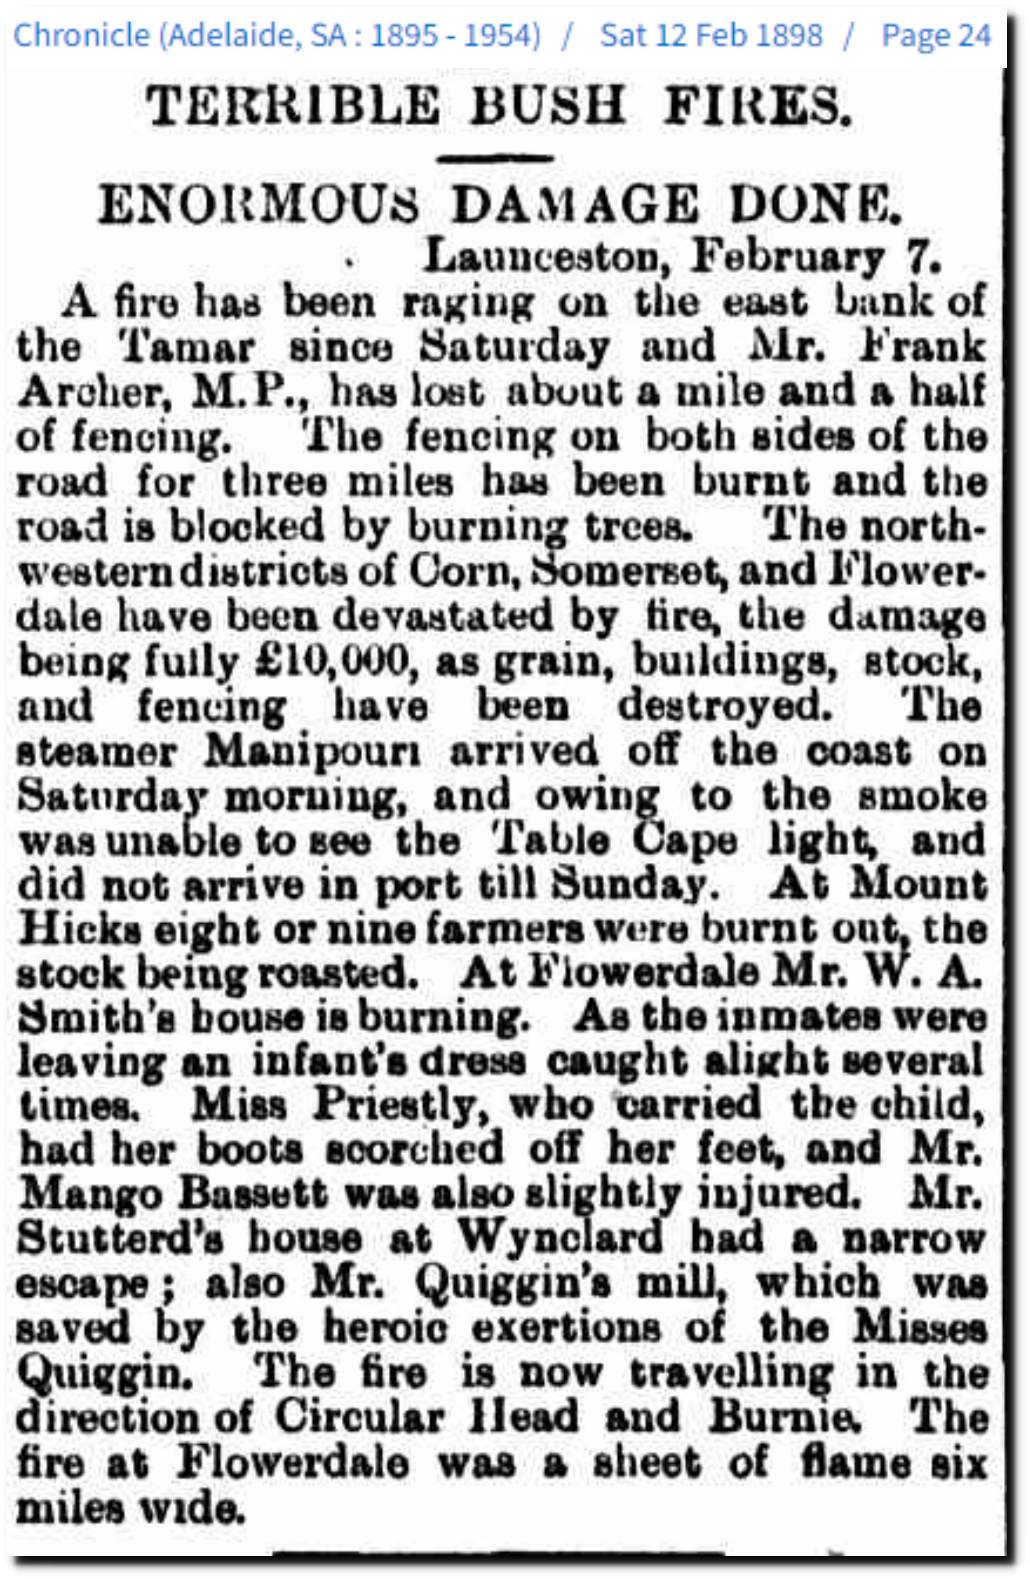
12 Feb 1898 – TERRIBLE BUSH FIRES. – Trove

12 Feb 1898 – NEW ZEALAND. – Trove

12 Feb 1898 – THE TASMANIAN BUSH FIRES. – Trove

12 Feb 1898 – A SCHOONER WRECKED. FLOOD AND FIRE. – Trove

12 Feb 1898 – HEAVY RAINS. – Trove
12 Feb 1898 – MUNICIPAL ELECTIONS. – Trove
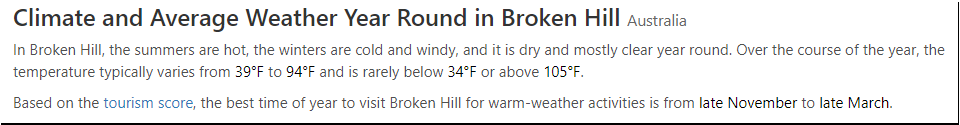
Broken Hill Climate, Weather By Month, Average Temperature (Australia) – Weather Spark

12 Feb 1898 – VICTORIAN FIRES. – Trove
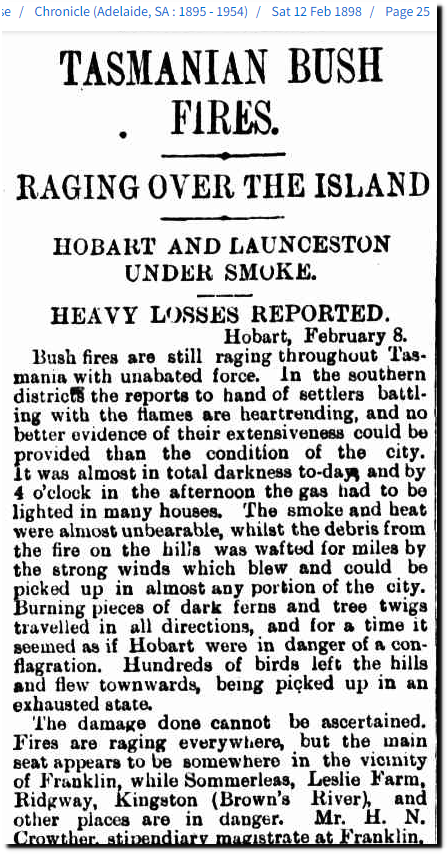
12 Feb 1898 – TASMANIAN BUSH FIRES. – Trove
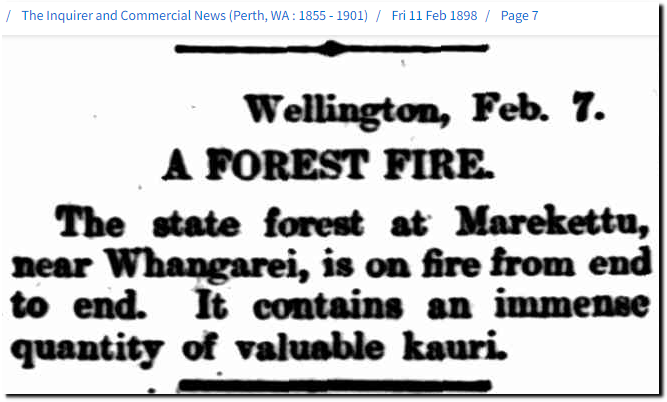
11 Feb 1898 – NEW ZEALAND. – Trove
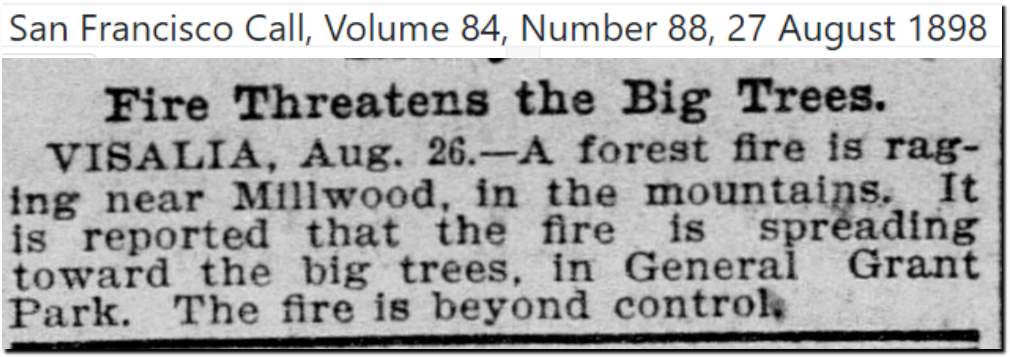
San Francisco Call 27 August 1898 — California Digital Newspaper Collection
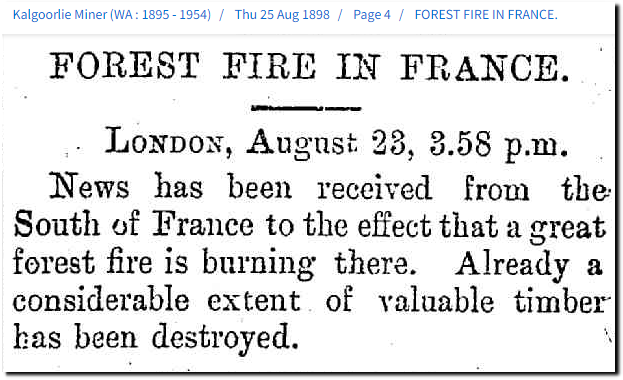
25 Aug 1898 – FOREST FIRE IN FRANCE. – Trove
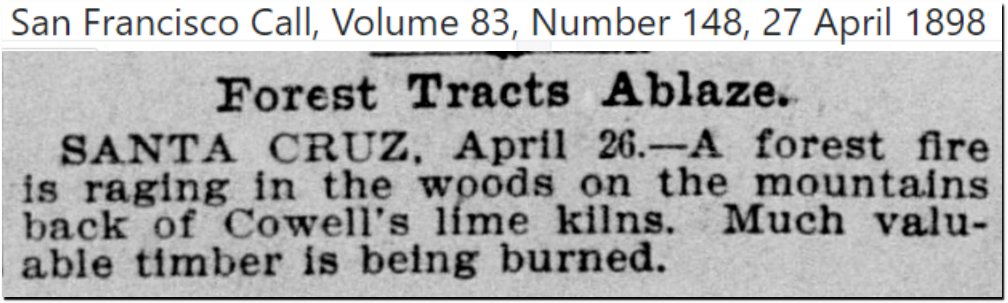
San Francisco Call 27 April 1898 — California Digital Newspaper Collection
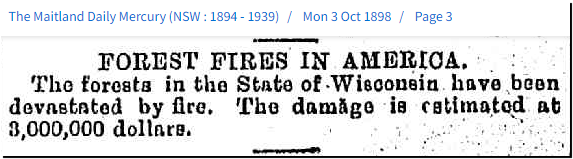
03 Oct 1898 – FOREST FIRES IN AMERICA. – Trove
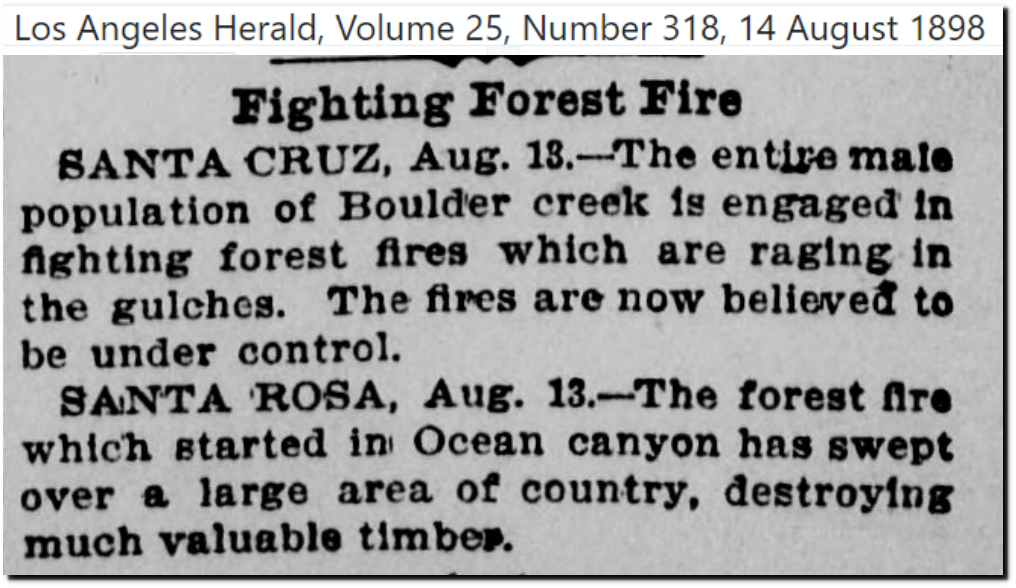
Los Angeles Herald 14 August 1898 — California Digital Newspaper Collection

08 Feb 1898 – THE FIRE FIEND. – Trove
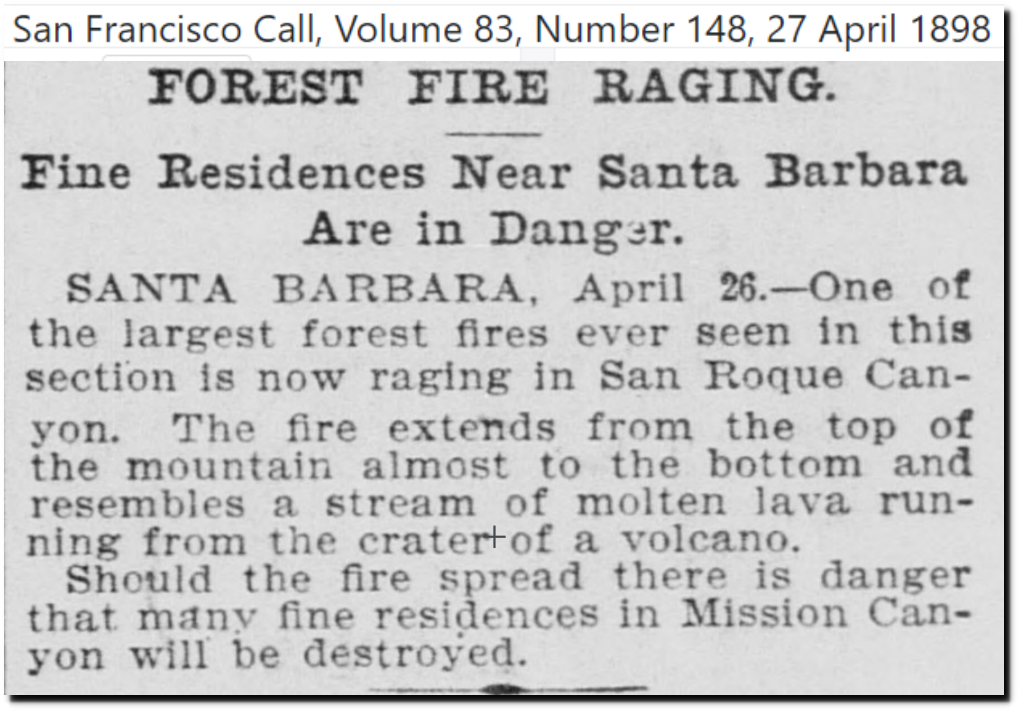
San Francisco Call 27 April 1898 — California Digital Newspaper Collection
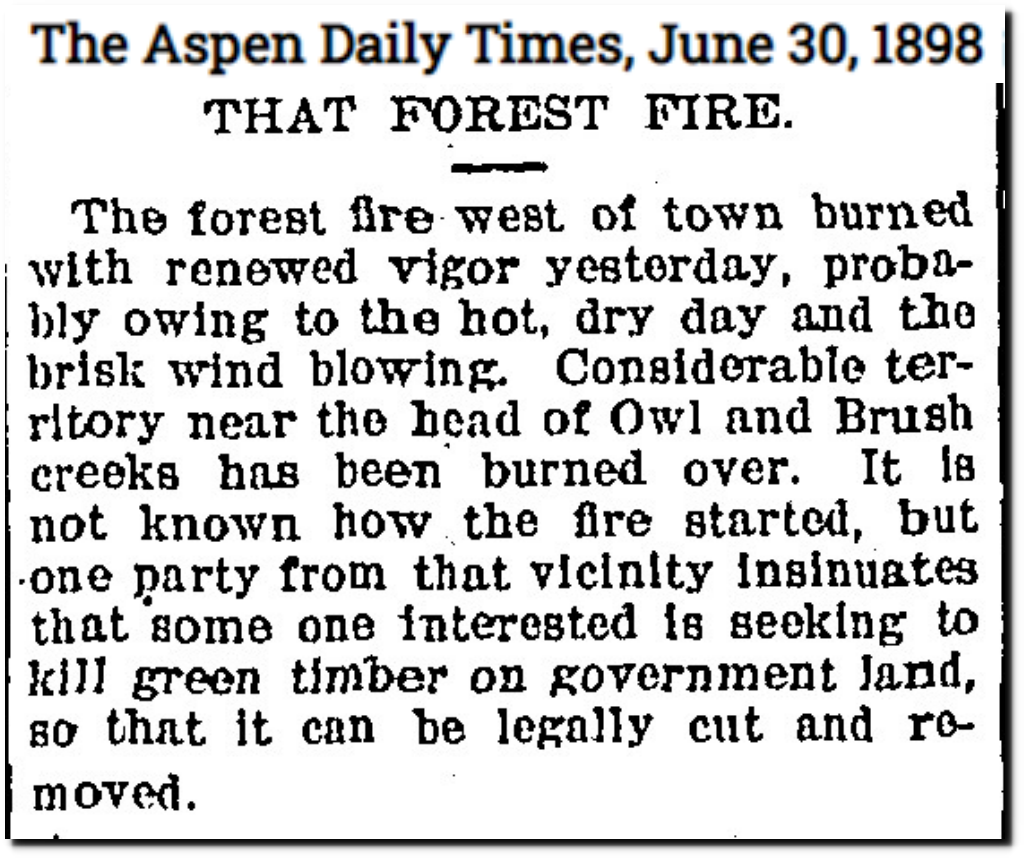
The Aspen Daily Times June 30, 1898 — Colorado Historic Newspapers Collection
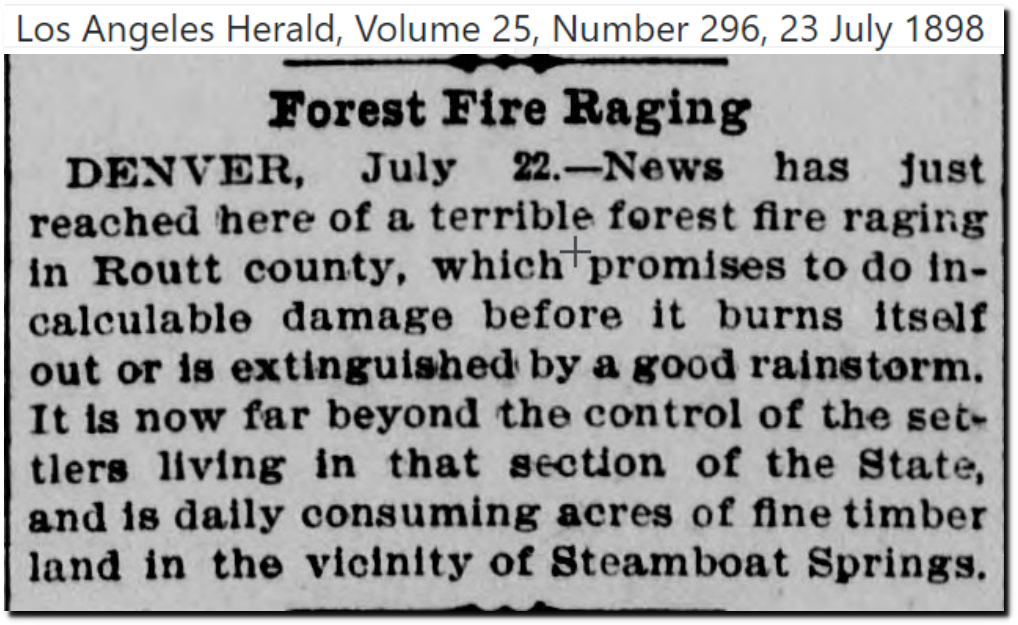
Los Angeles Herald 23 July 1898 — California Digital Newspaper Collection
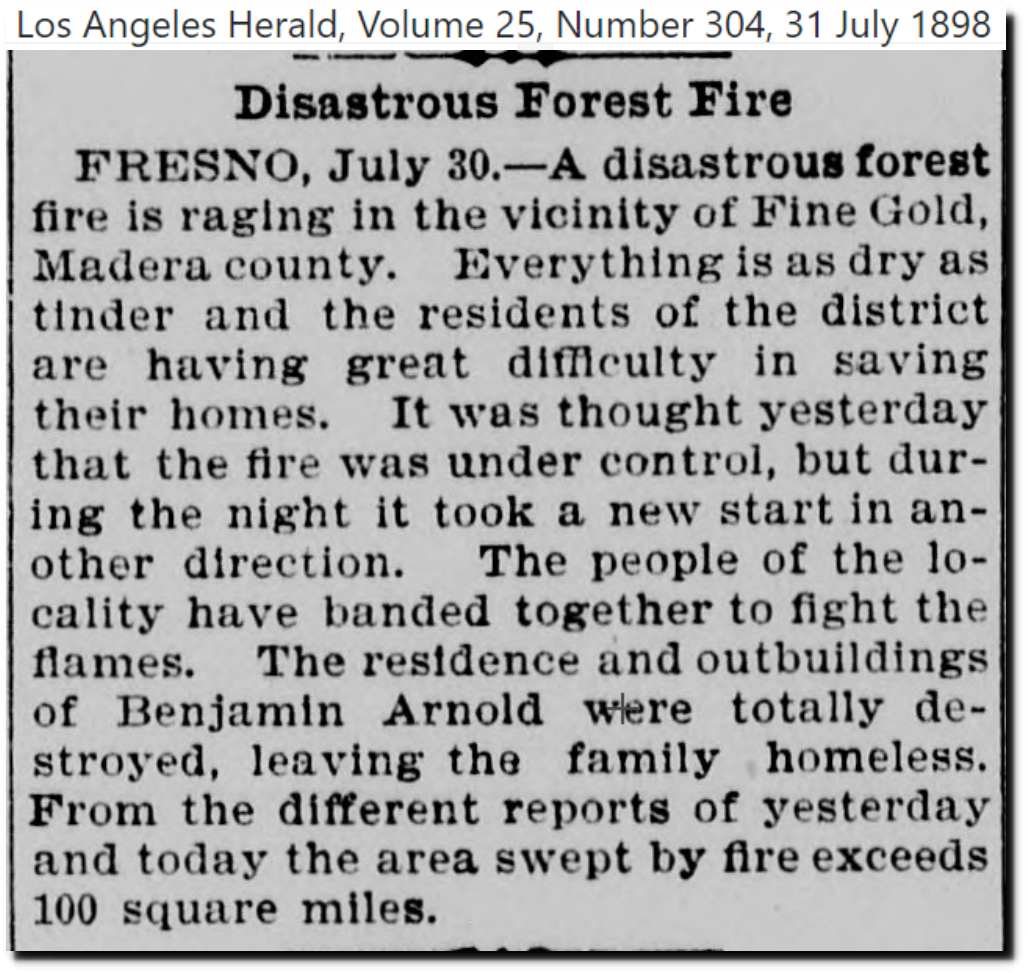
Los Angeles Herald 31 July 1898 — California Digital Newspaper Collection
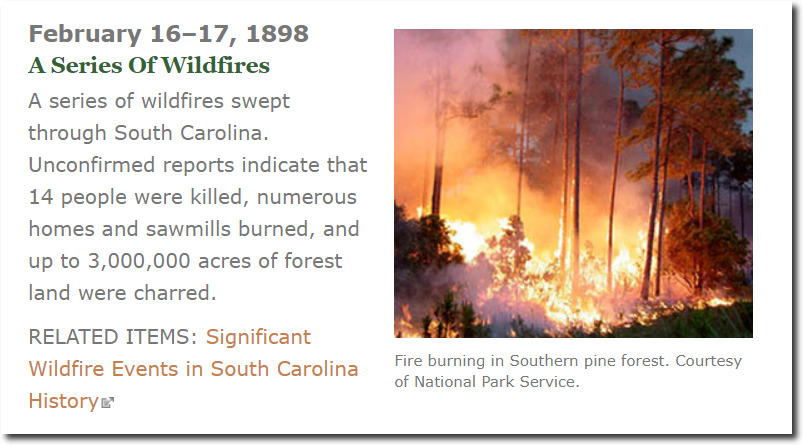
Wildland Fire: History Timeline | U.S. National Park Service
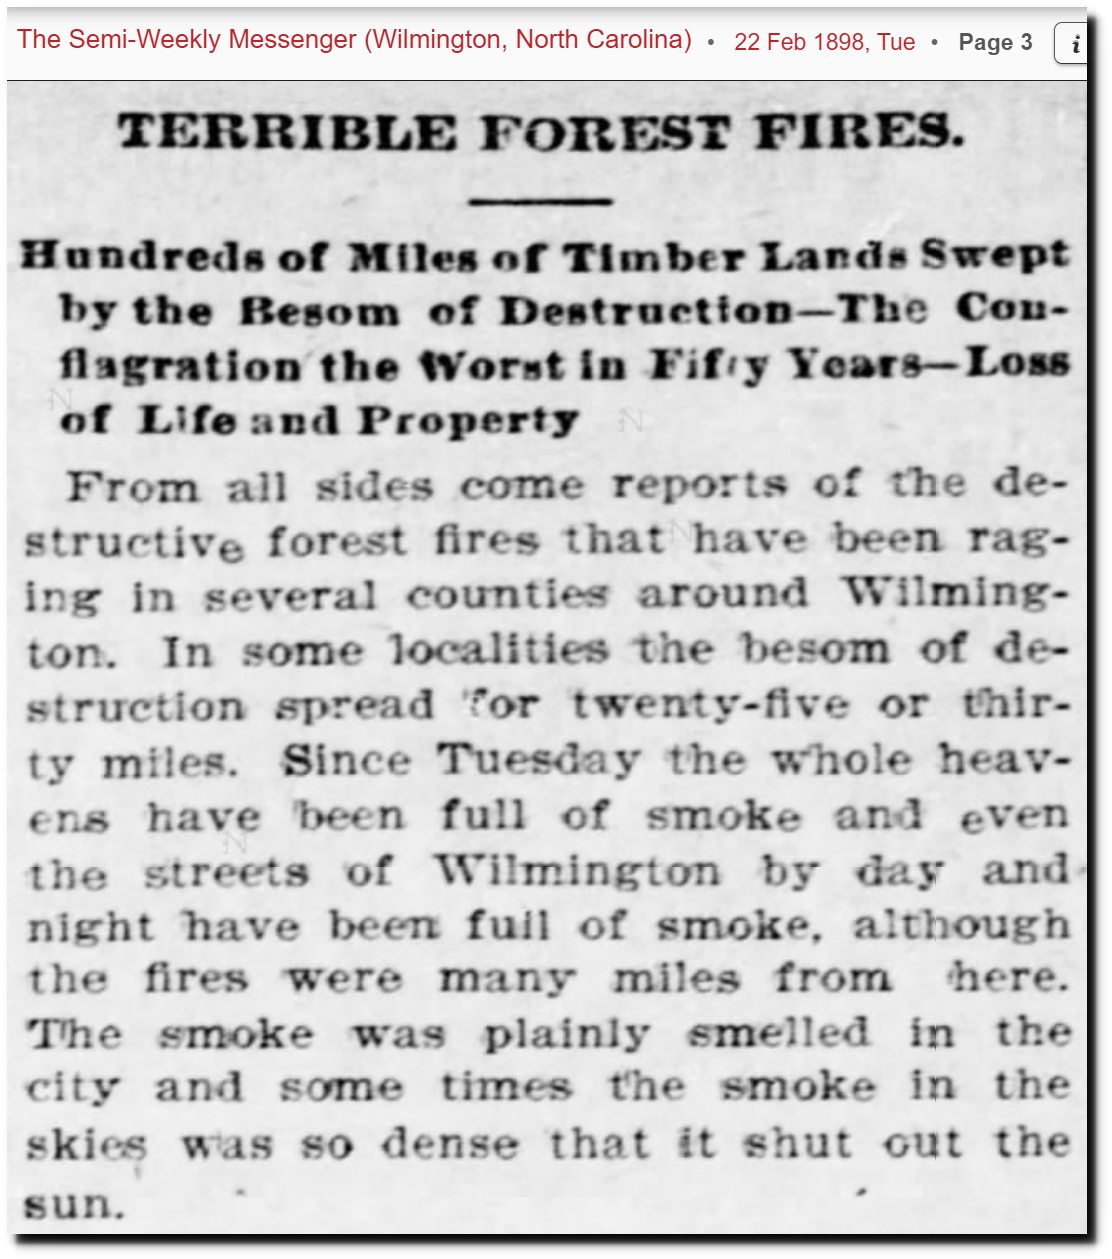 22 Feb 1898, Page 3 – The Semi-Weekly Messenger at Newspapers.com
The massive fires of 1898 burned well into November, making the fire season at least nine months long.
“Reports from the western portion of Colorado continue to tell of the ravages of the forest fires which bid fair to devastate the greater part of the forests of the state.”
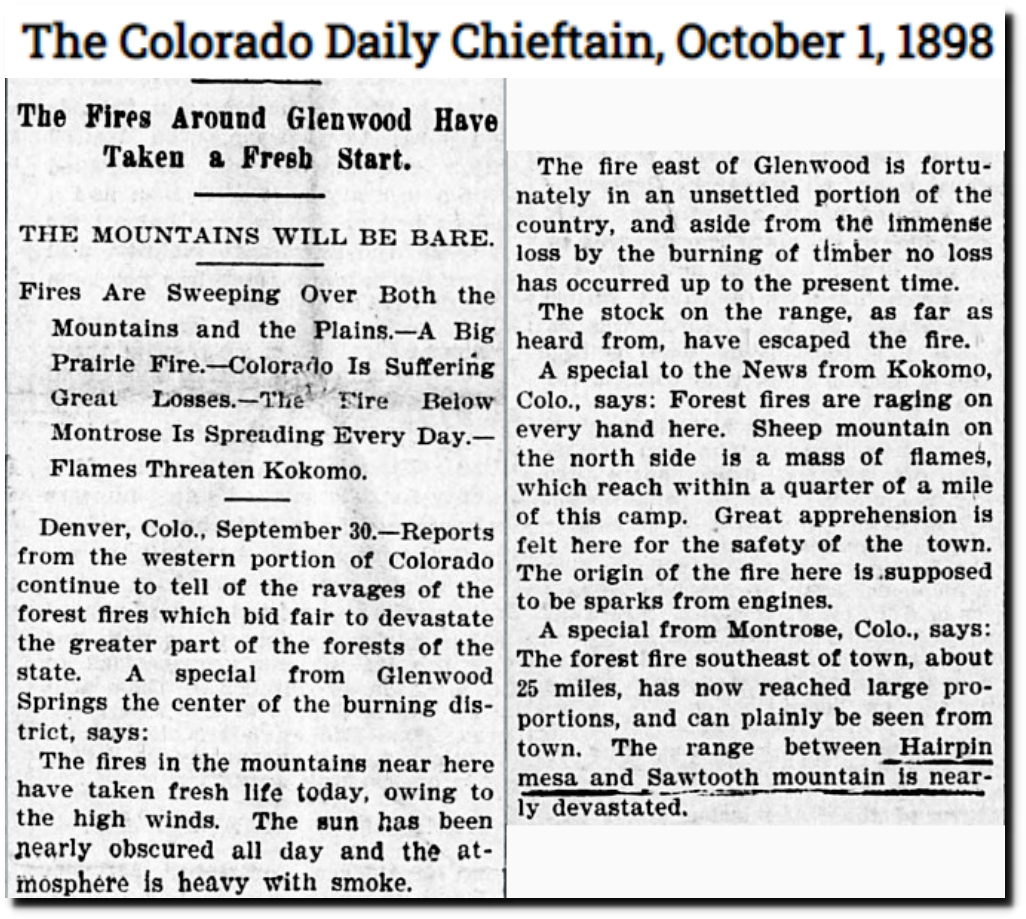
The Colorado Daily Chieftain October 1, 1898 — Colorado Historic Newspapers Collection
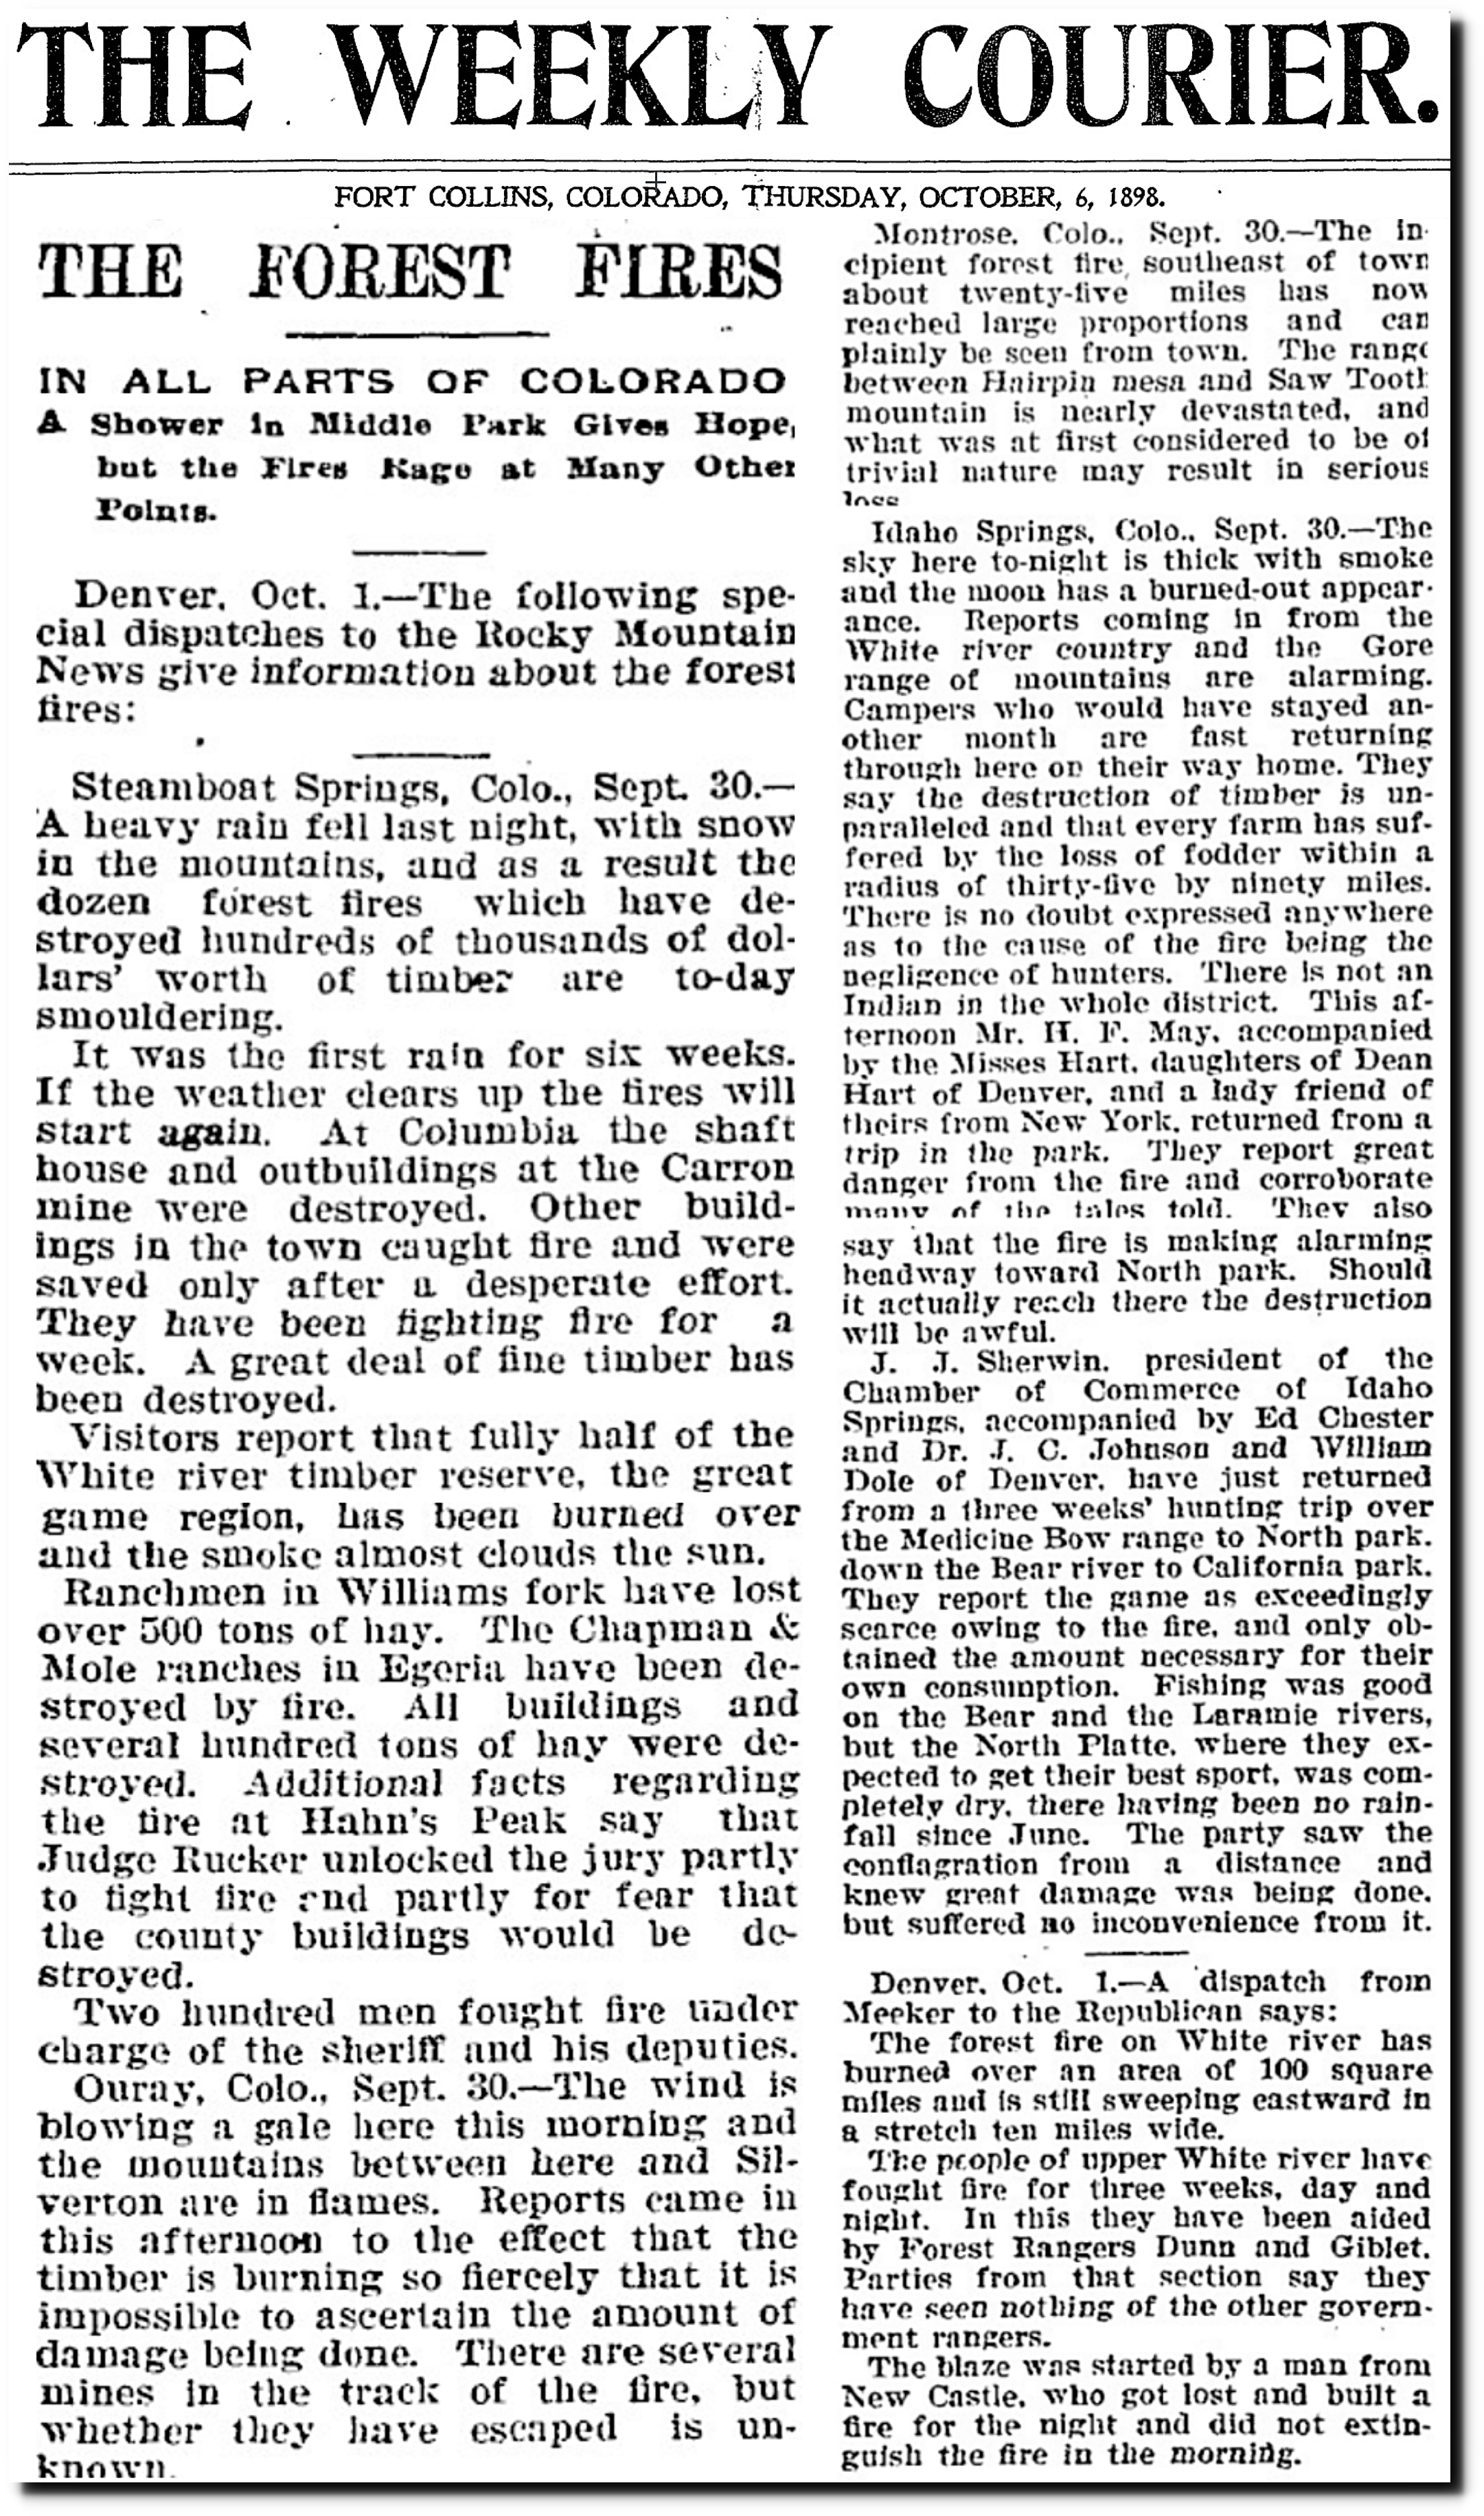
Fort Collins Courier October 6, 1898 — Colorado Historic Newspapers Collection

Herald Democrat October 2, 1898 — Colorado Historic Newspapers Collection
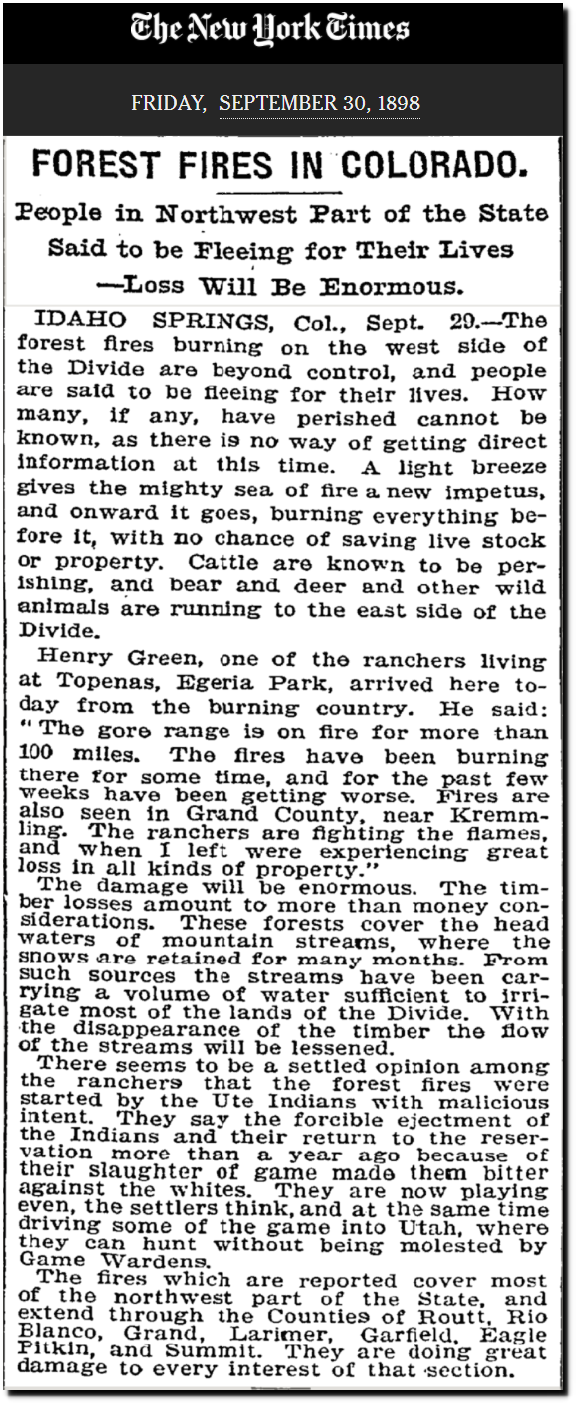
TimesMachine: September 30, 1898 – NYTimes.com
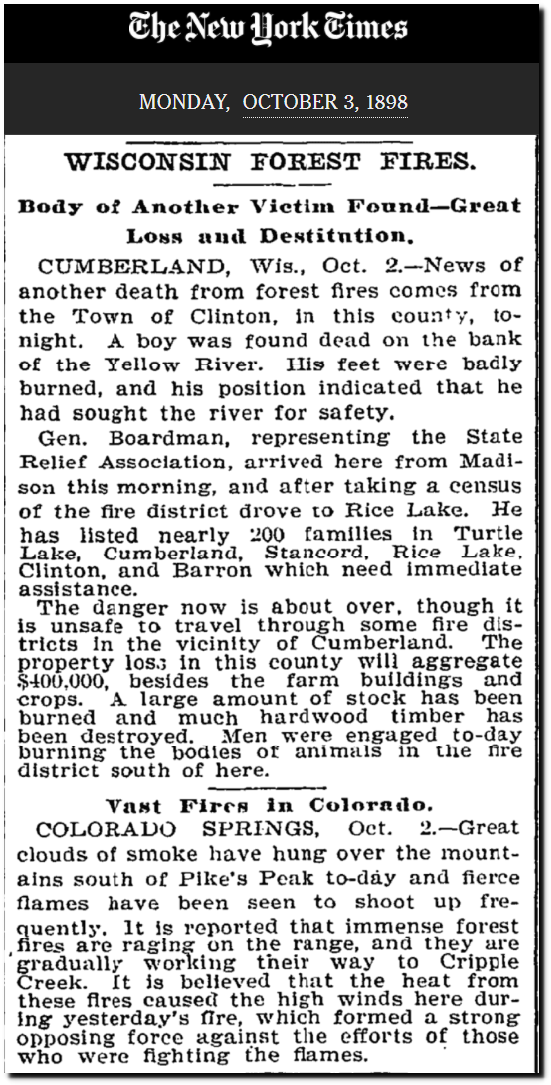
TimesMachine: October 3, 1898 – NYTimes.com
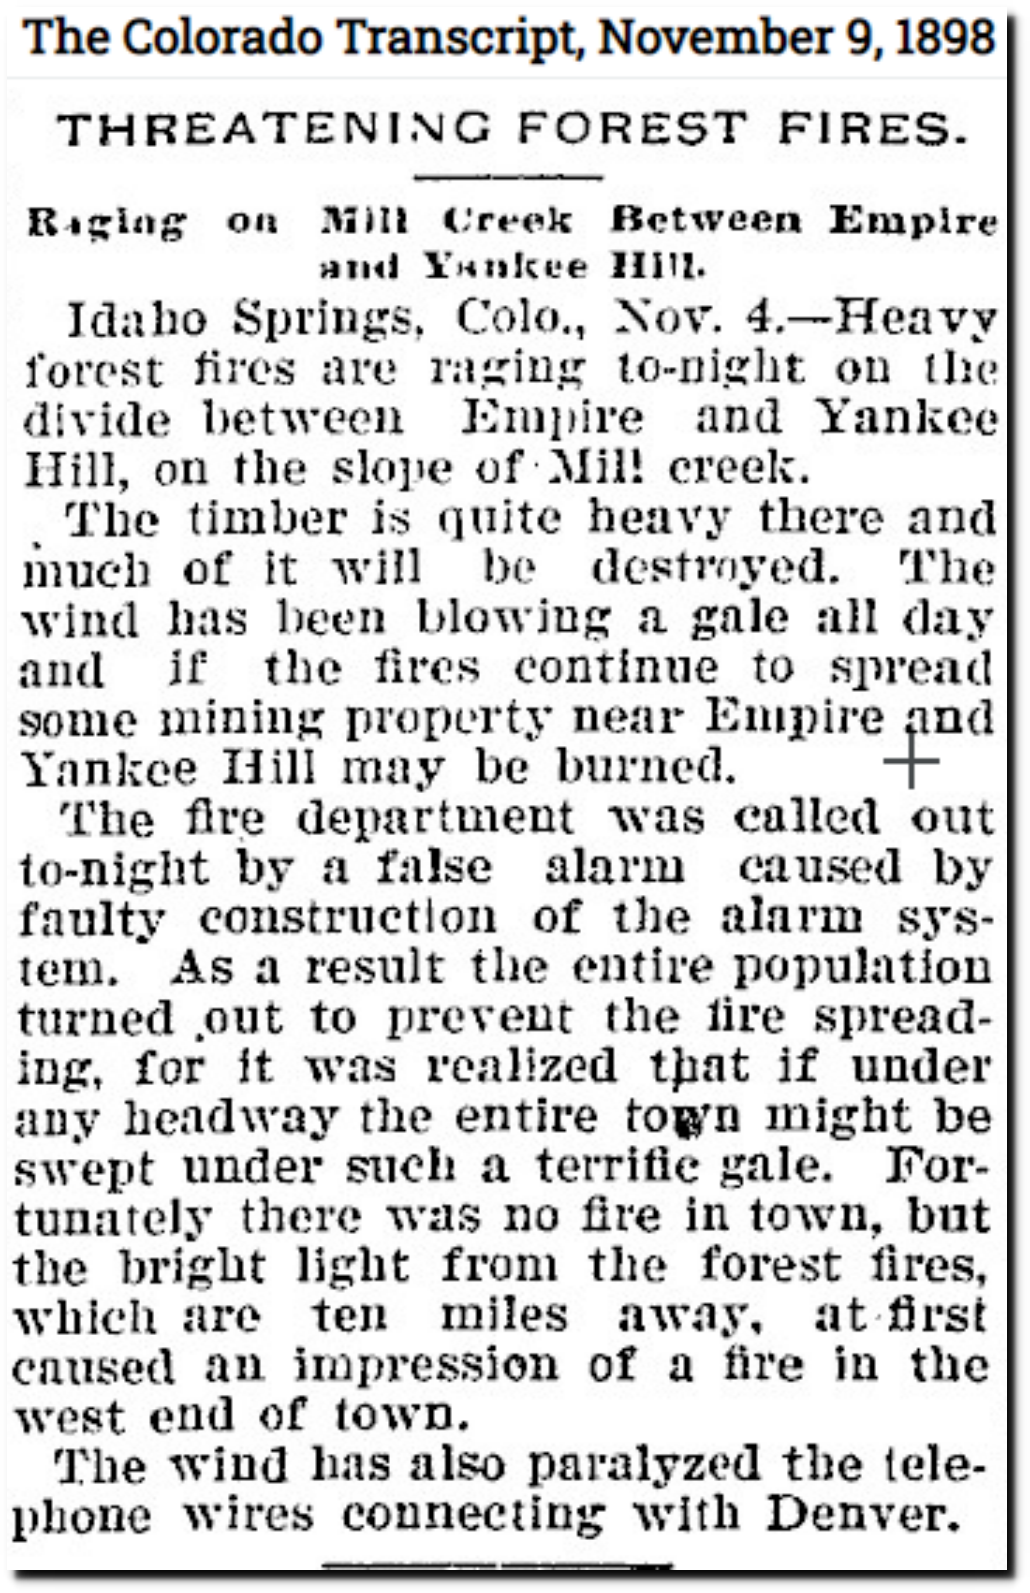
The Colorado Transcript November 9, 1898 — Colorado Historic Newspapers Collection
Oregon recorded their record temperature of 119F twice during the summer of 1898. This years’s “record” heatwave topped out at 118F.

What is the hottest temperature ever recorded? | kgw.com

San Francisco Call 9 November 1898 — California Digital Newspaper Collection