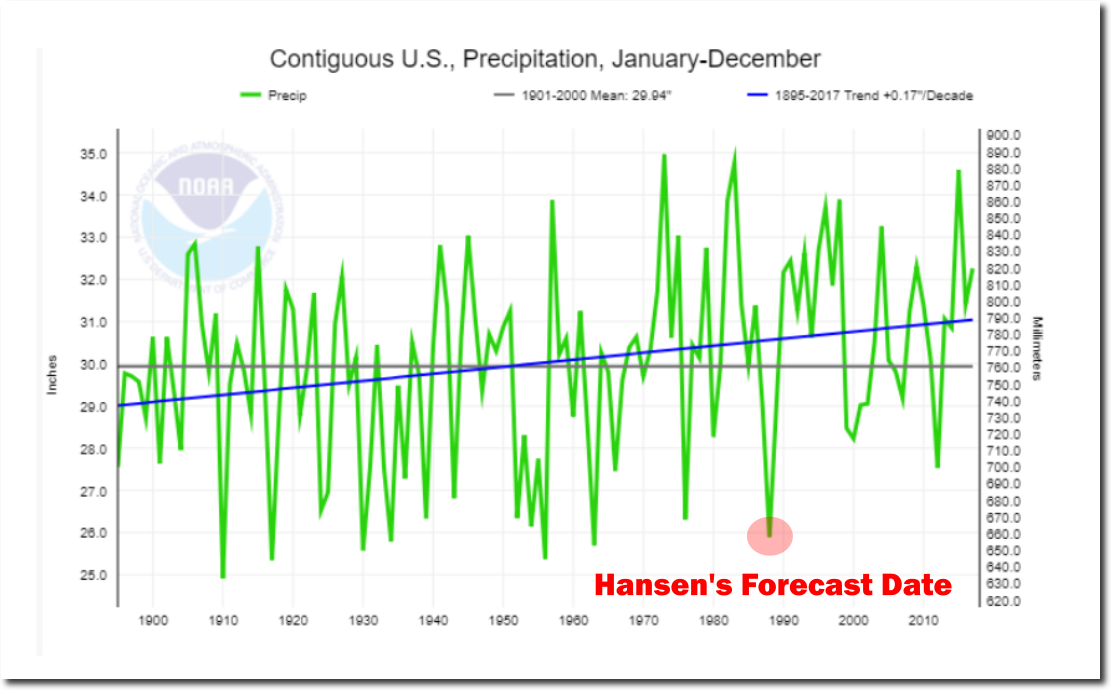
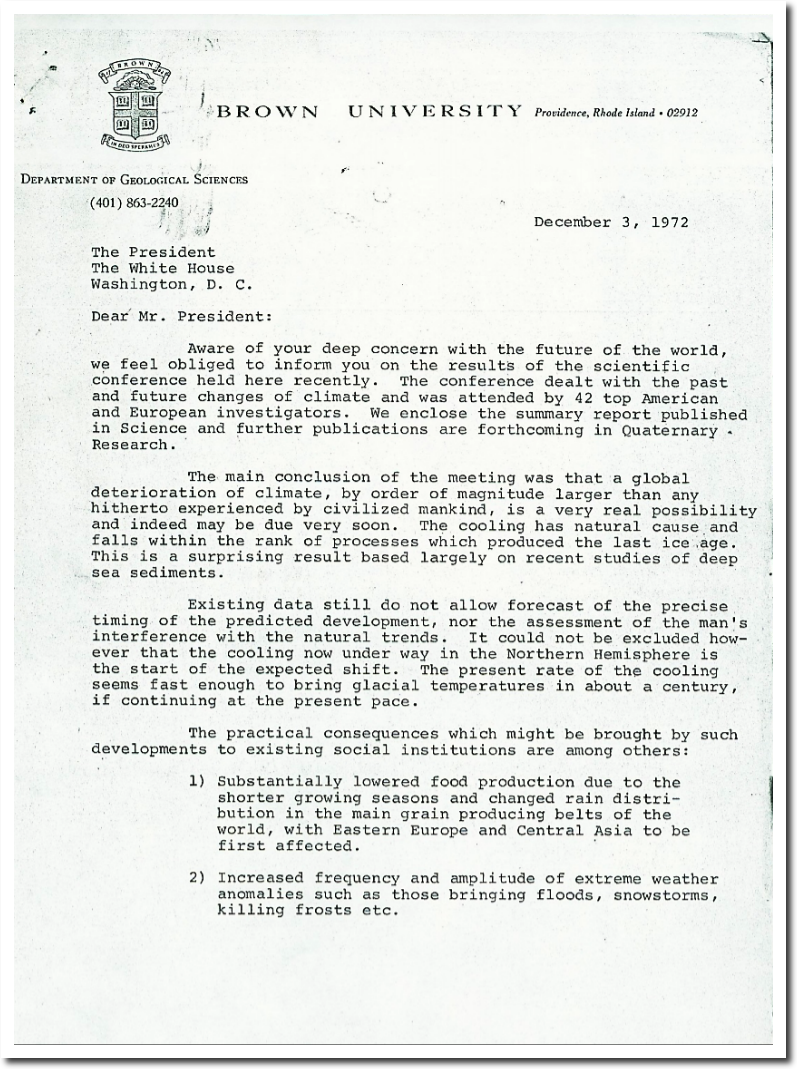
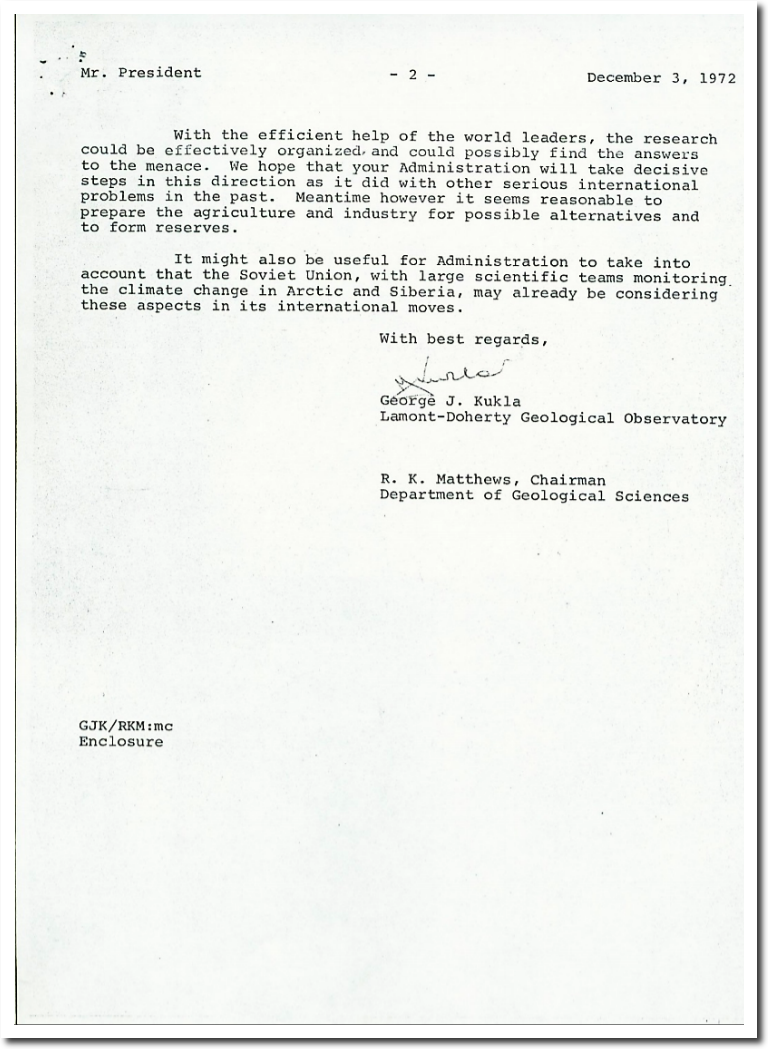
NOAA has known for 30 years that the US is not warming.
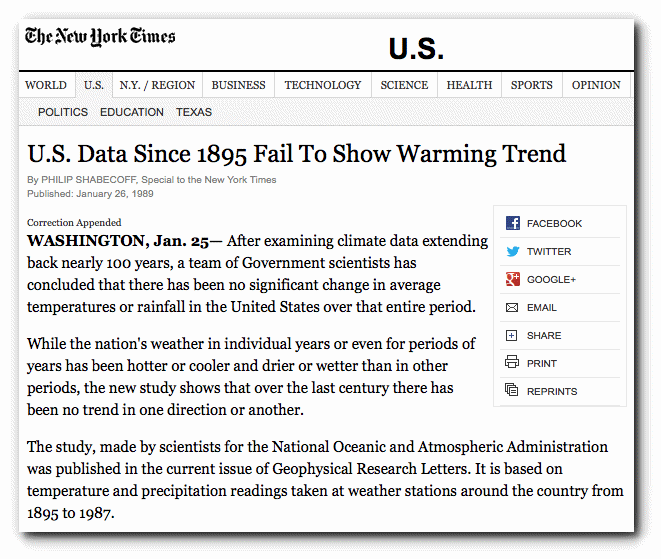
U.S. Data Since 1895 Fail To Show Warming Trend – NYTimes.com
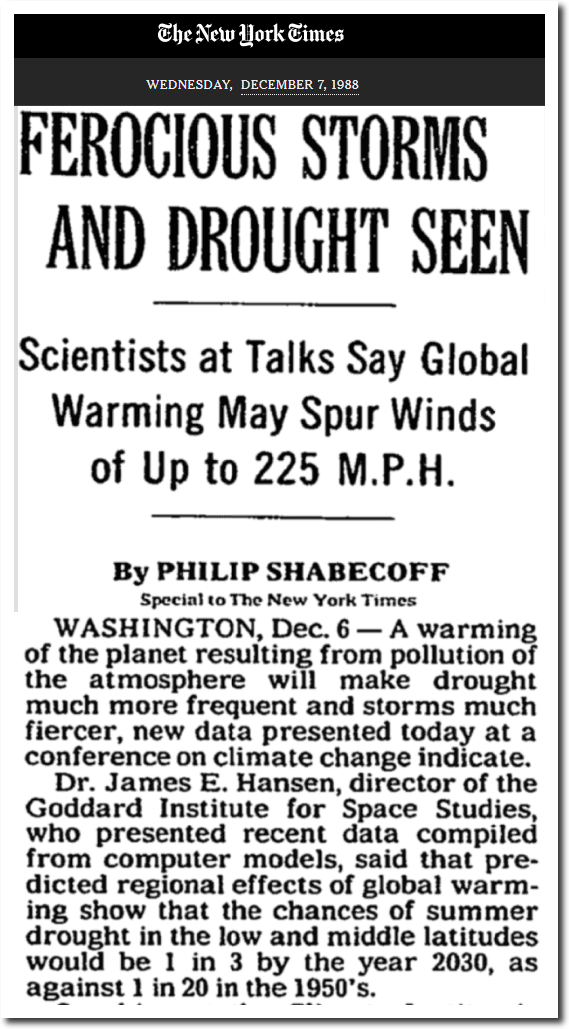
In 1999, NASA’s James Hansen was concerned that the very high quality US temperature record didn’t match Hansen’s fake global warming trend.
How can the absence of clear climate change in the United States be reconciled with continued reports of record global temperature? Part of the “answer” is that U.S. climate has been following a different course than global climate, at least so far. Figure 1 compares the temperature history in the U.S. and the world for the past 120 years.
in the U.S. there has been little temperature change in the past 50 years, the time of rapidly increasing greenhouse gases — in fact, there was a slight cooling throughout much of the country
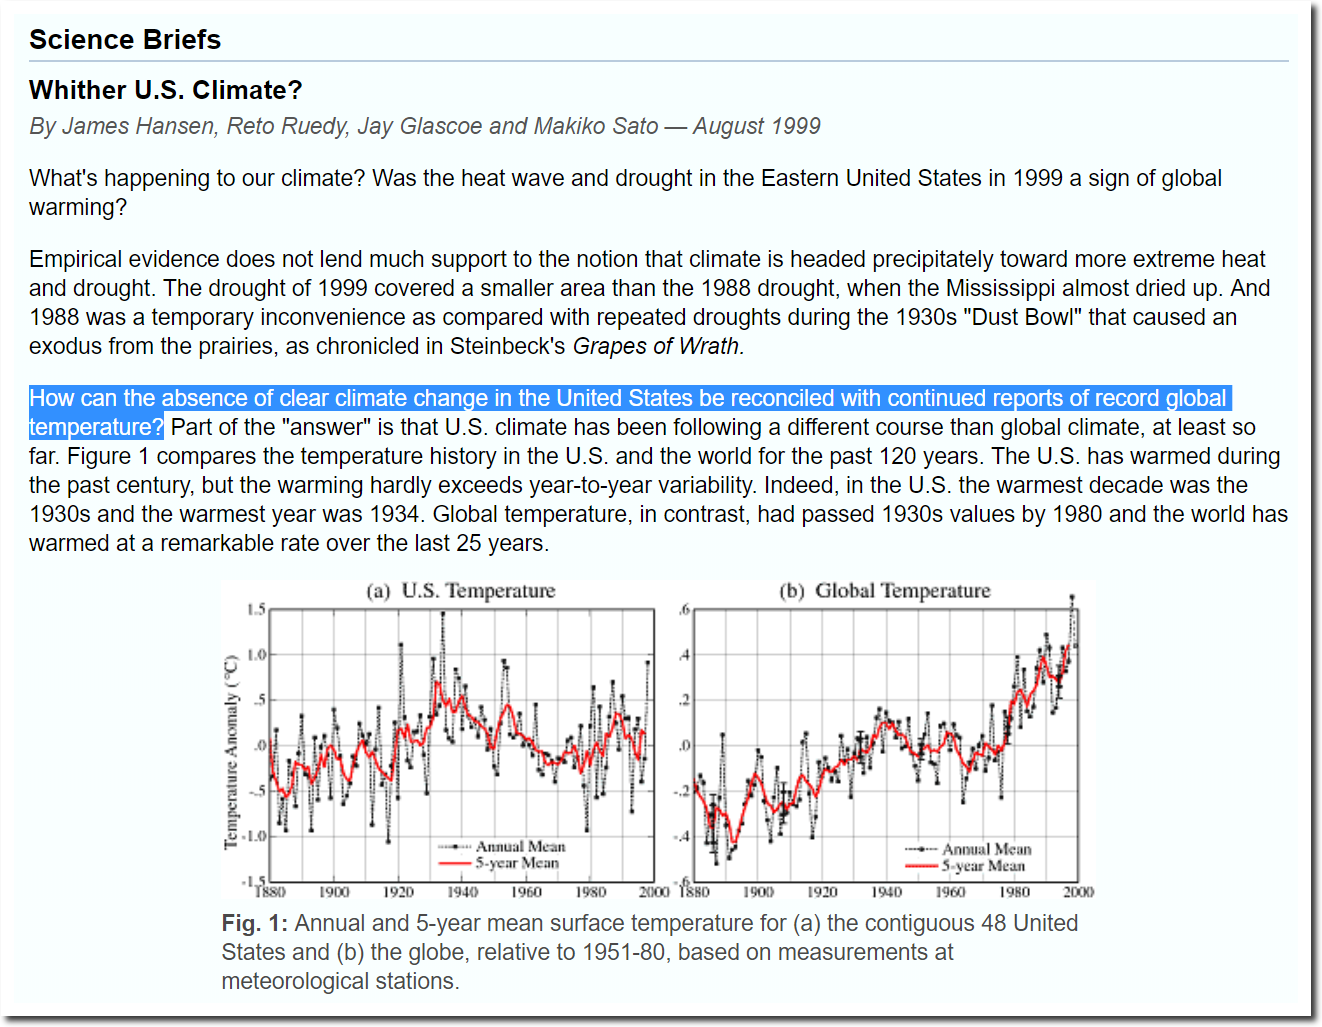
NASA GISS: Science Briefs: Whither U.S. Climate?
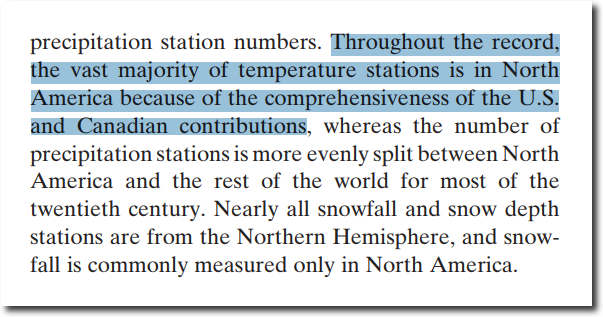
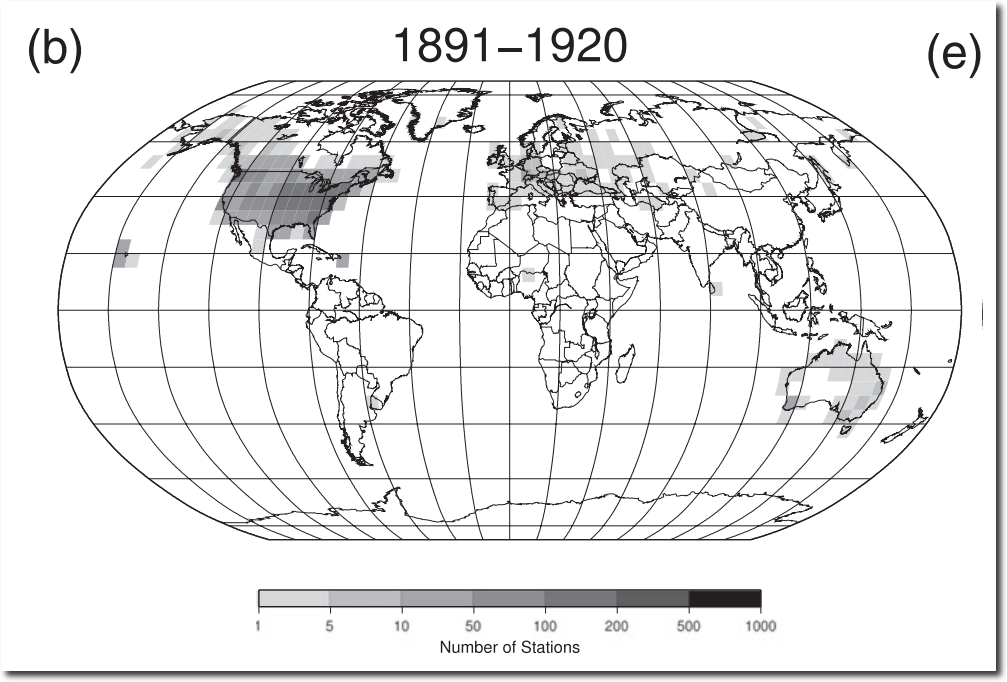
This was particularly troubling, because the vast majority of high quality stations are located in the US, and most of the world actually has no reliable long term data.
jtechD1100103 897..910
Hansen resolved the problem by knocking more than 0.5C off 1934, and adding nearly that much on to 1998 – thus turning US cooling into warming.
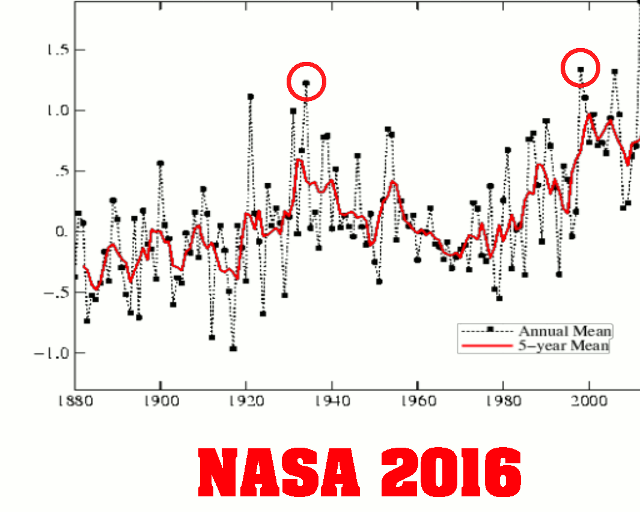
NASA 1999 NASA 2016
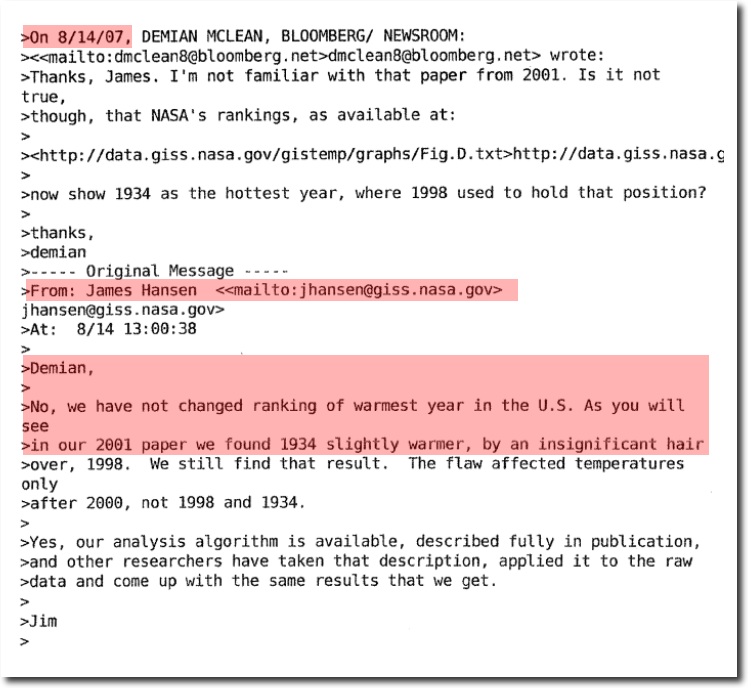
Then he lied about it to journalists.
783_NASA_docs-3.pdf
The data tampering on the world’s highest quality data set is very impressive, turning 90 years of cooling into warming.
Spreadsheet Data
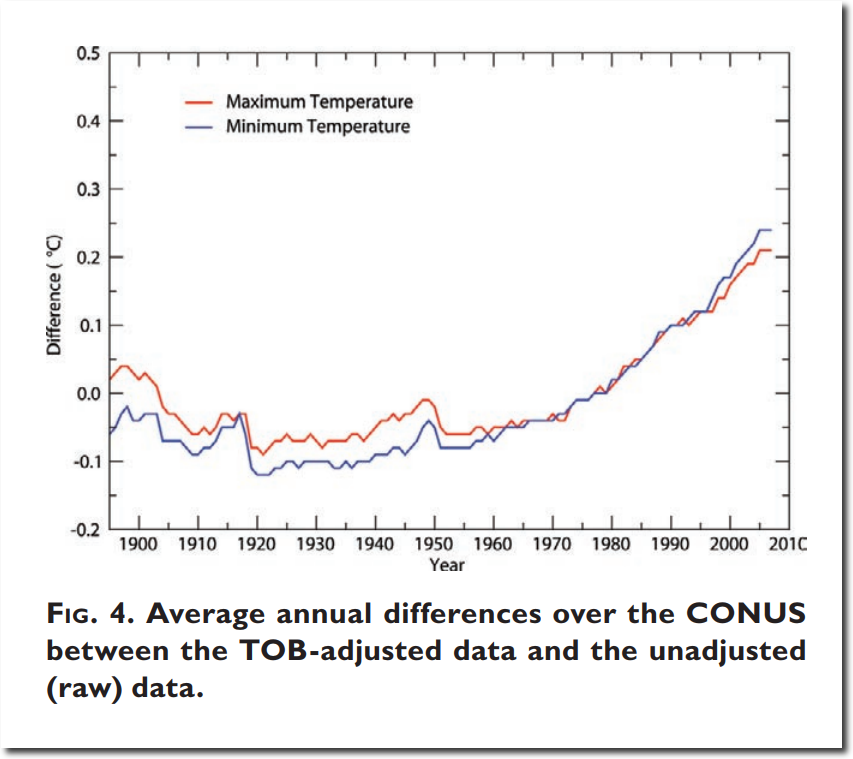
A lot of this is done using the Time Of Observation Bias (TOBS) adjustment – which started as 0.3F, and later magically changed into 0.3C.
USHCN V2 (0.3F)
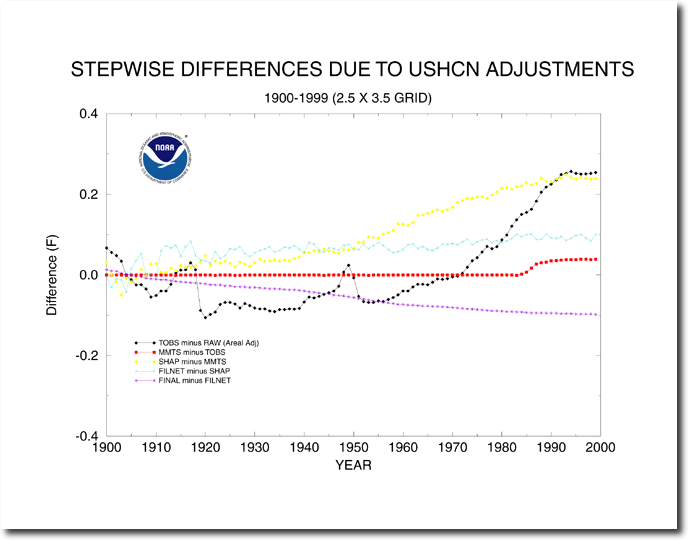
USHCN V3 (0.3C)
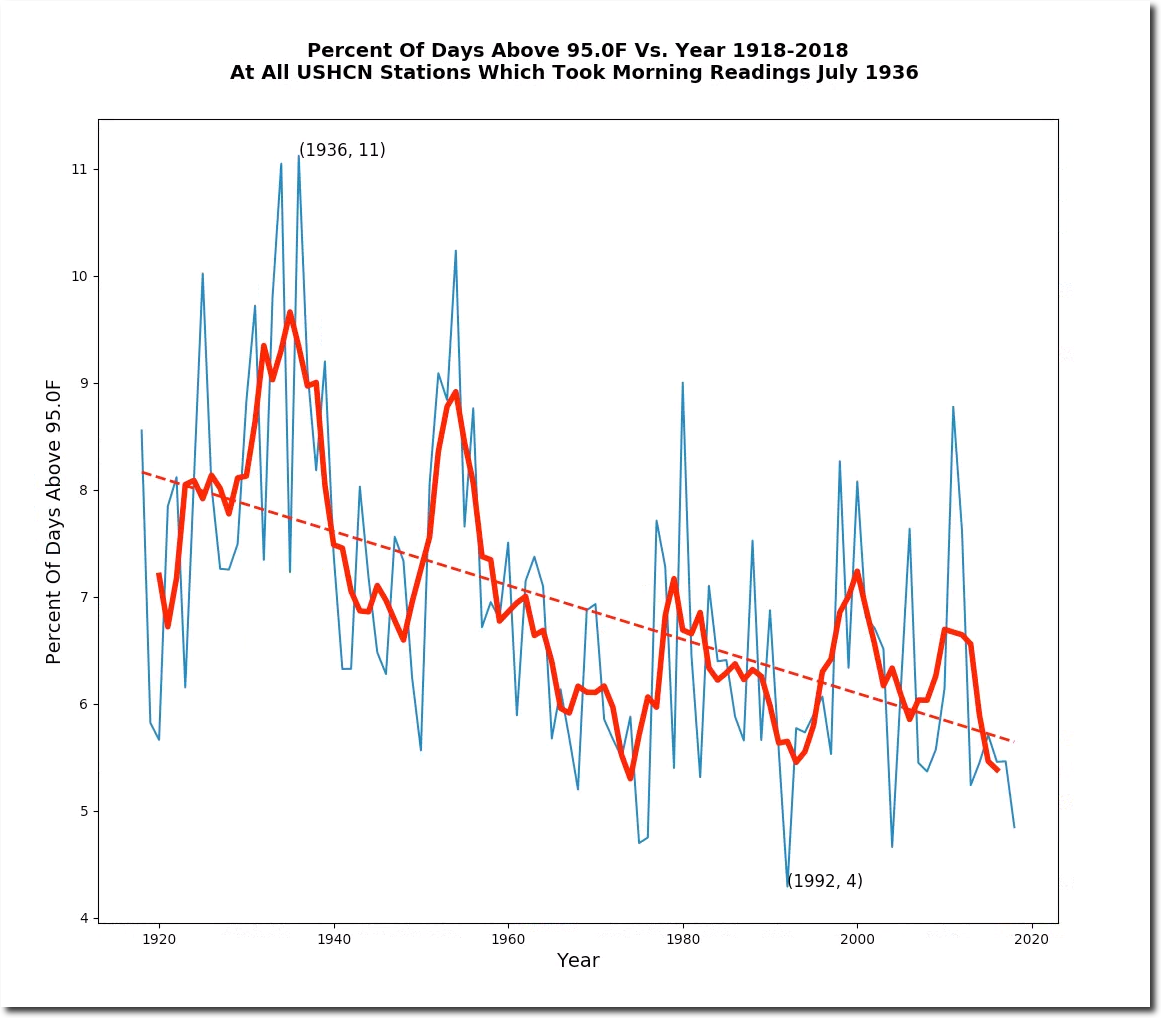
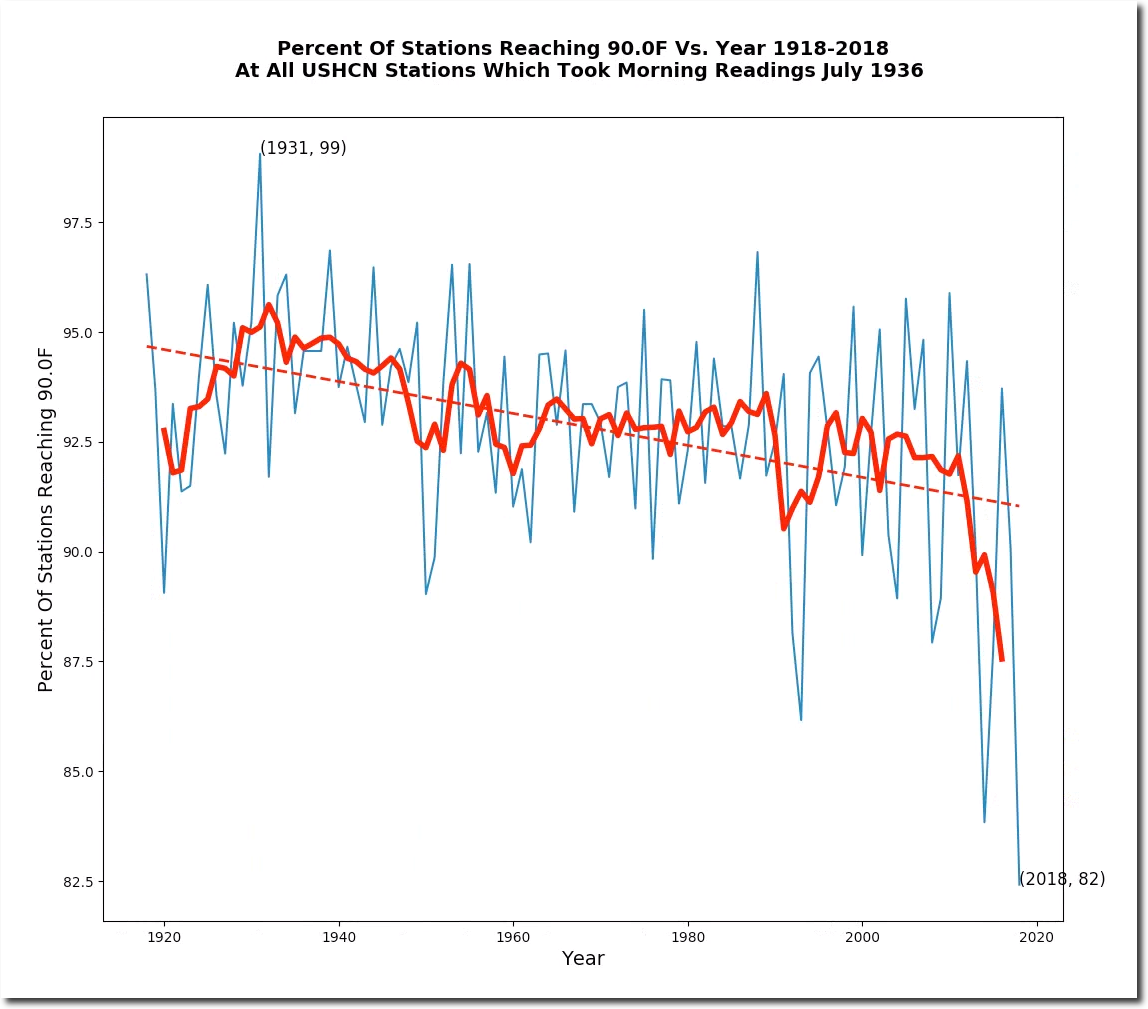
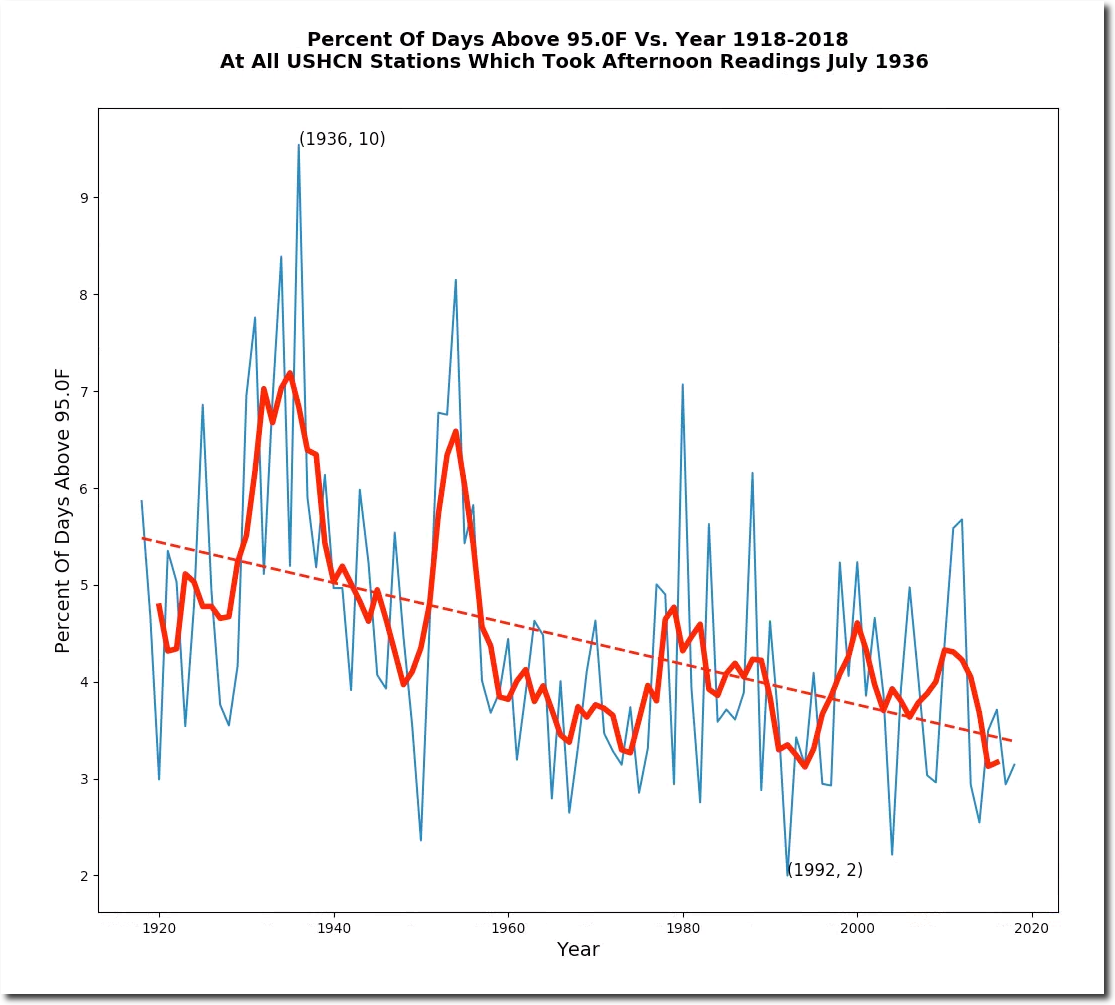
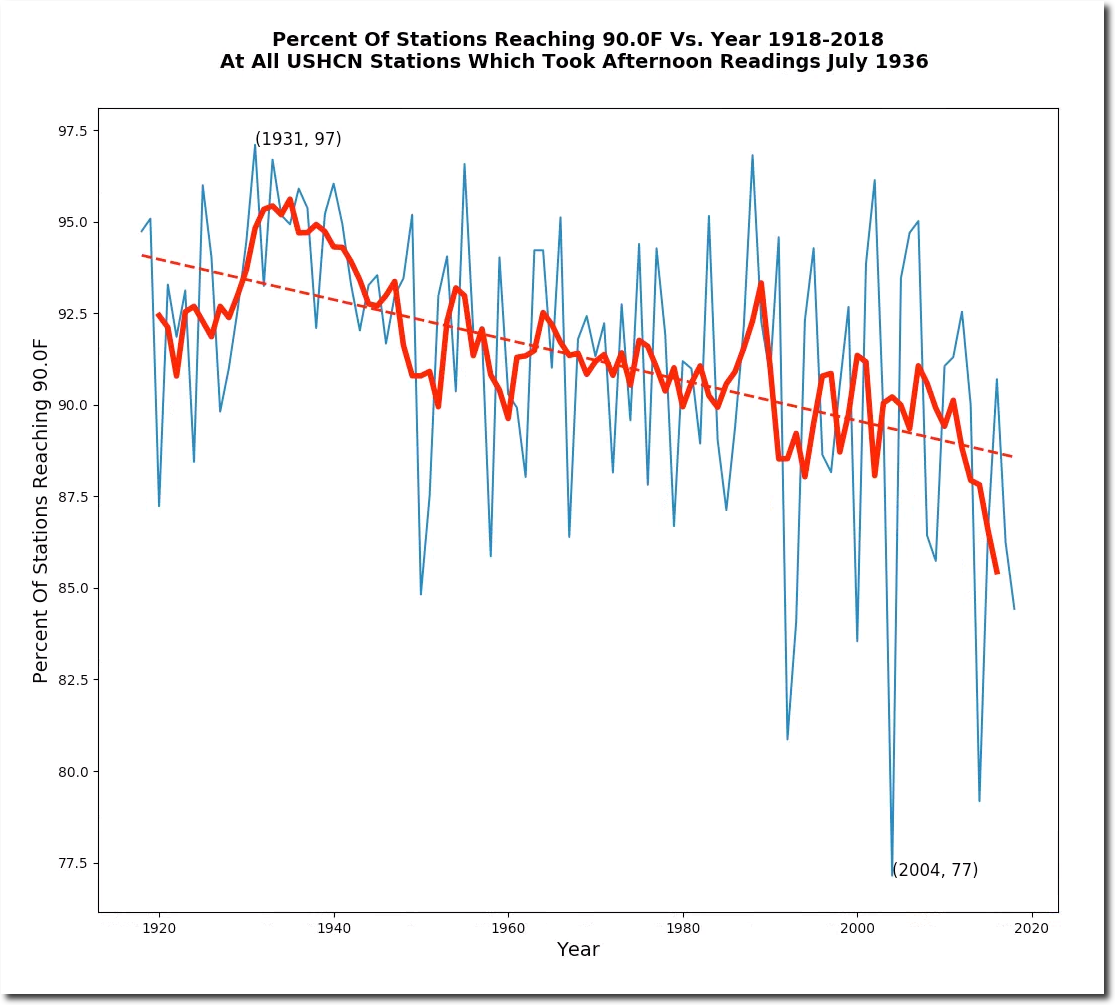
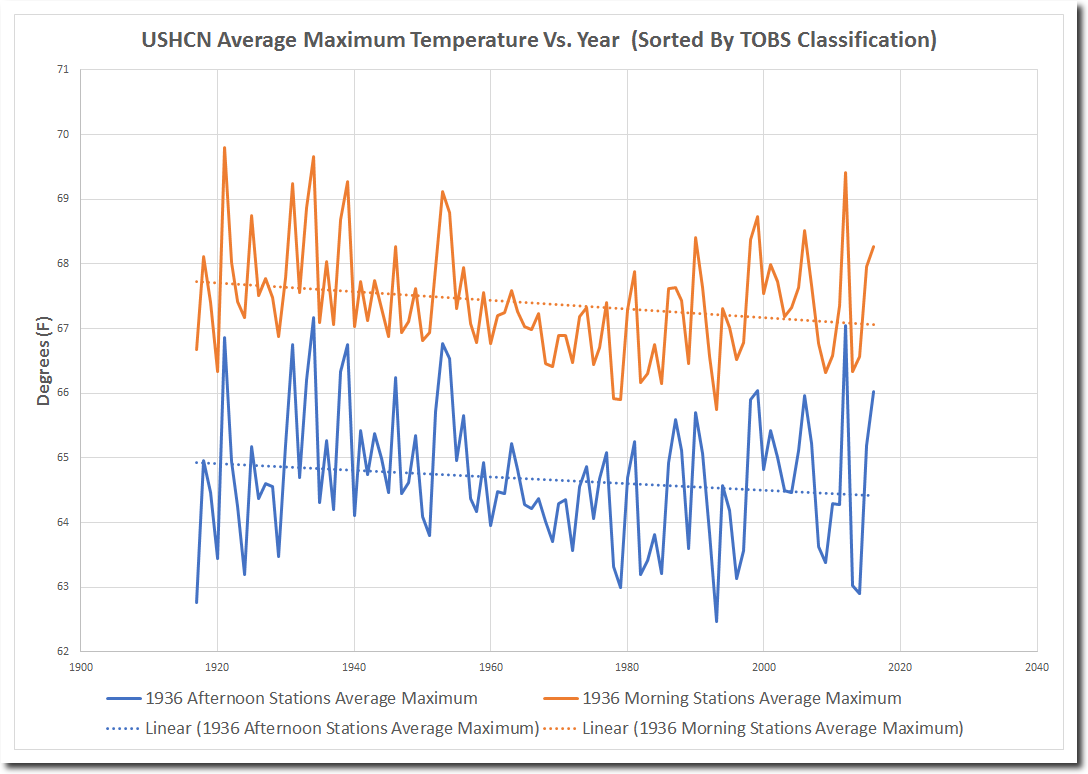
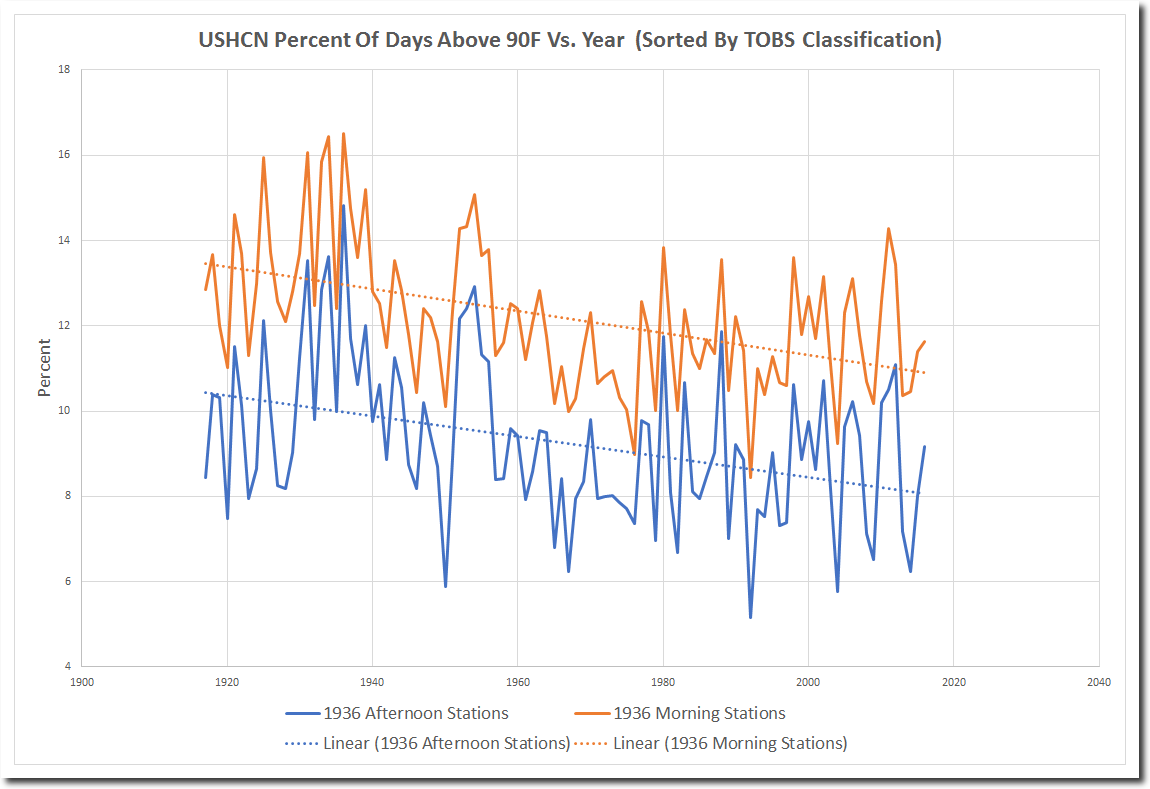
The TOBS adjustment is based on the theory that if you reset your min/max thermometer in the afternoon, you will double count some hot days – and that people used to reset thermometers in the afternoon, but now do it in the morning. This is easy enough to test out, by comparing trends at stations which took their readings in the morning or night during July 1936, versus stations which took their readings in the afternoon. The data shows that there is no difference in the trends between the two groups of stations. Both data sets show a sharp decline in maximum temperatures.
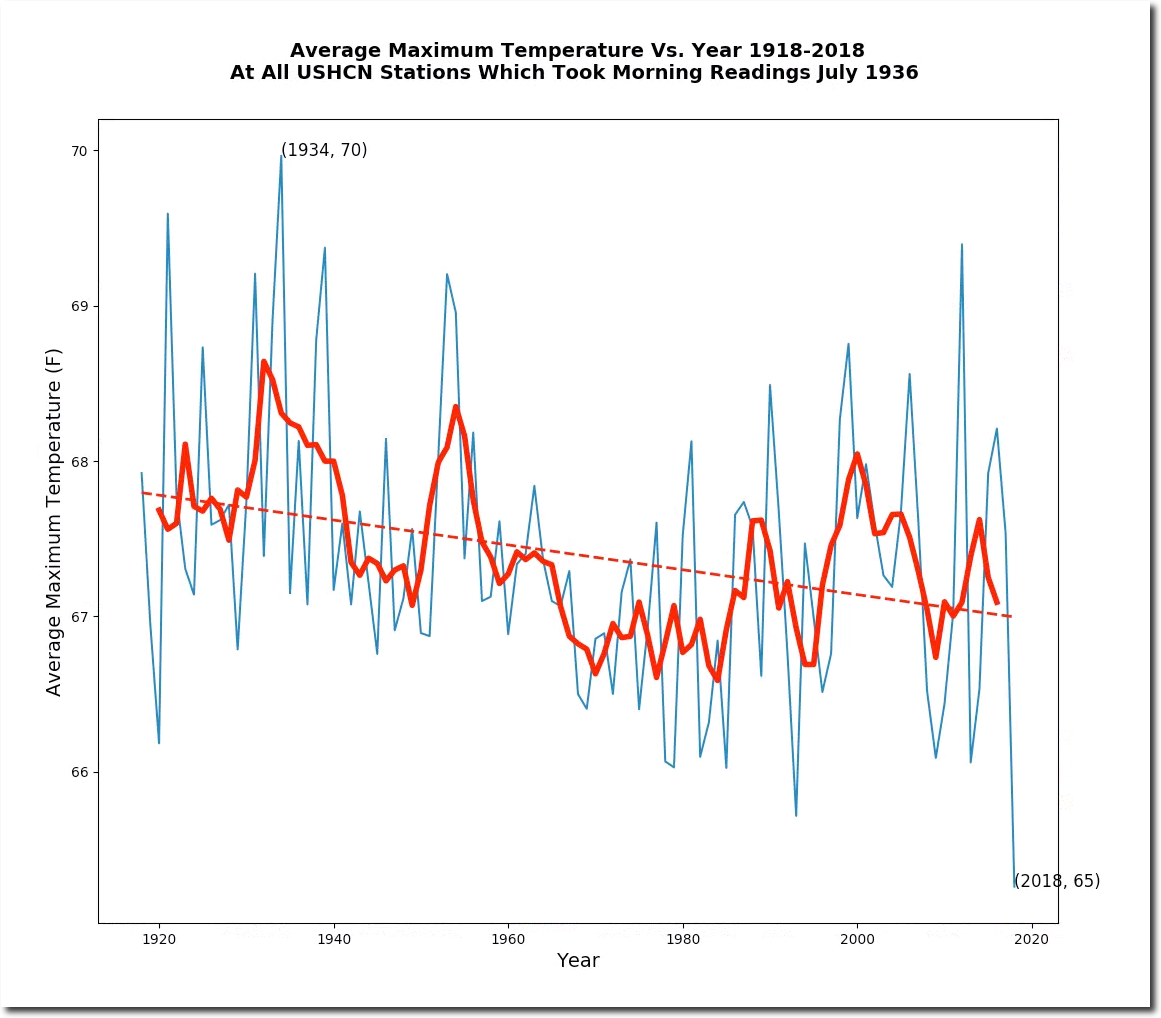
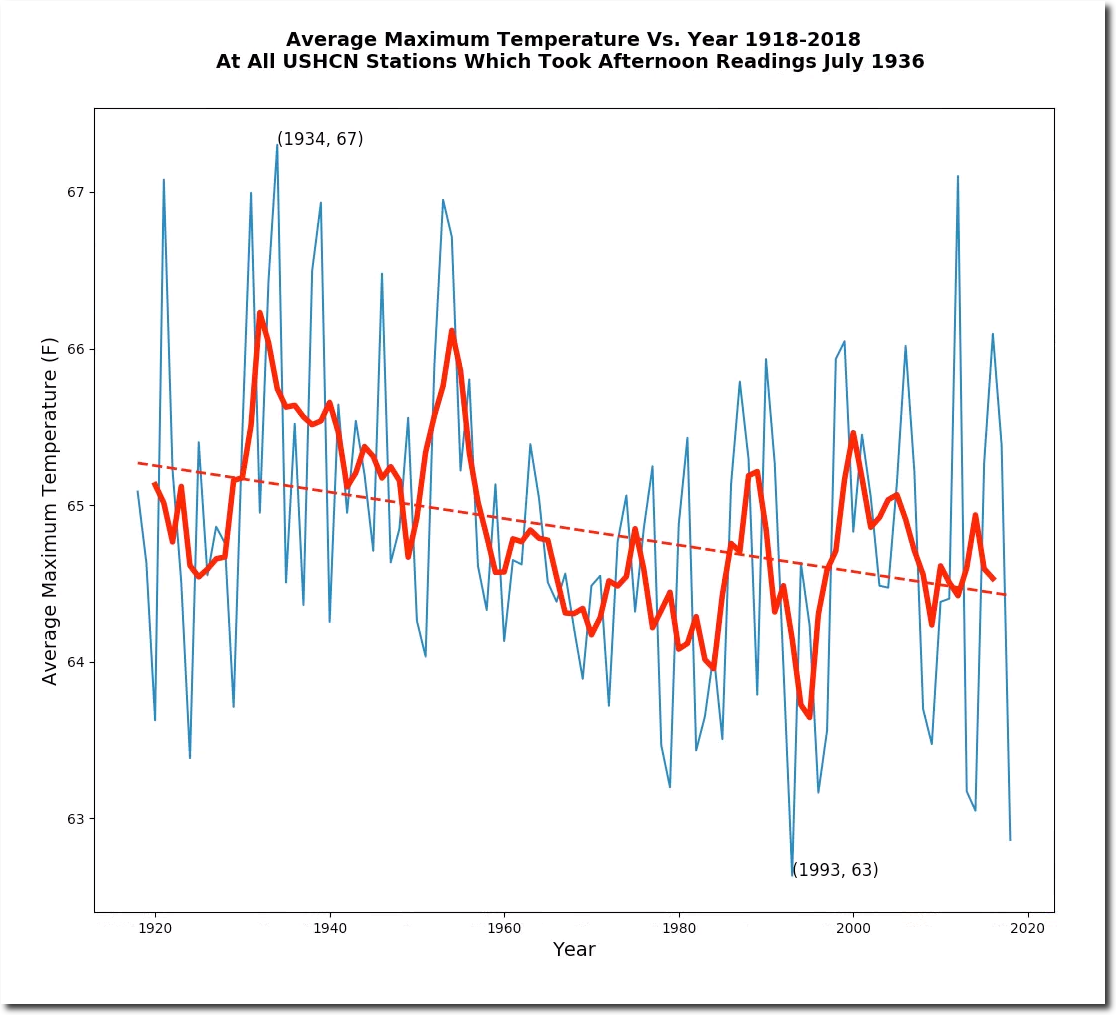
The only difference is that morning stations tend to be hotter, because they tend to be located at lower latitudes where people like to go outside earlier.
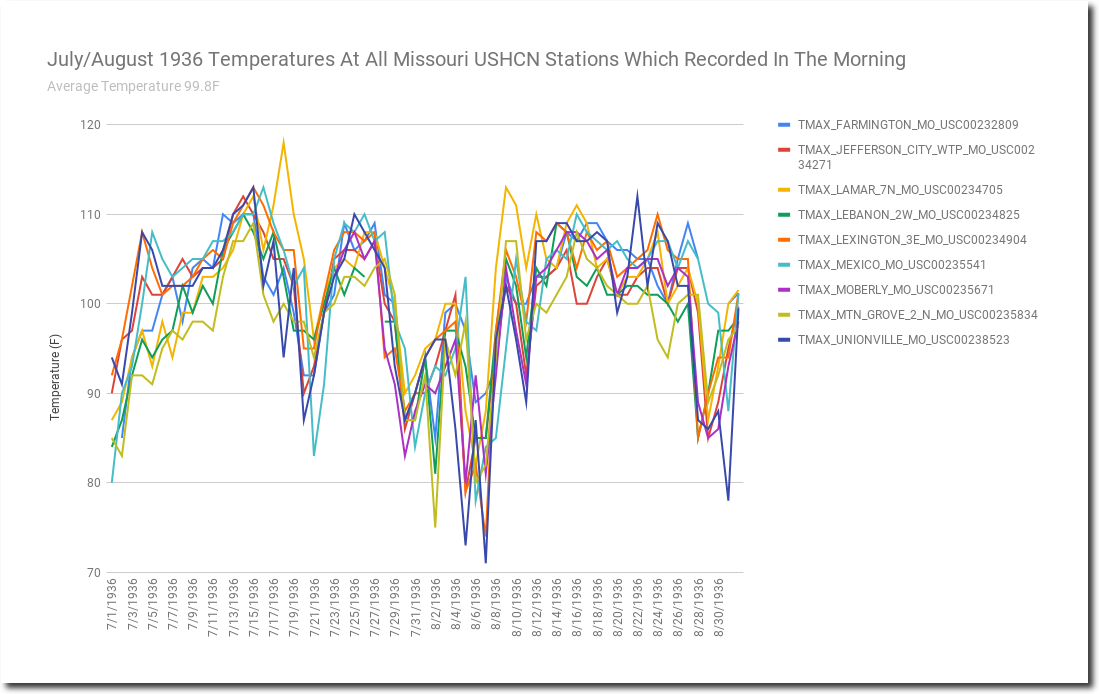
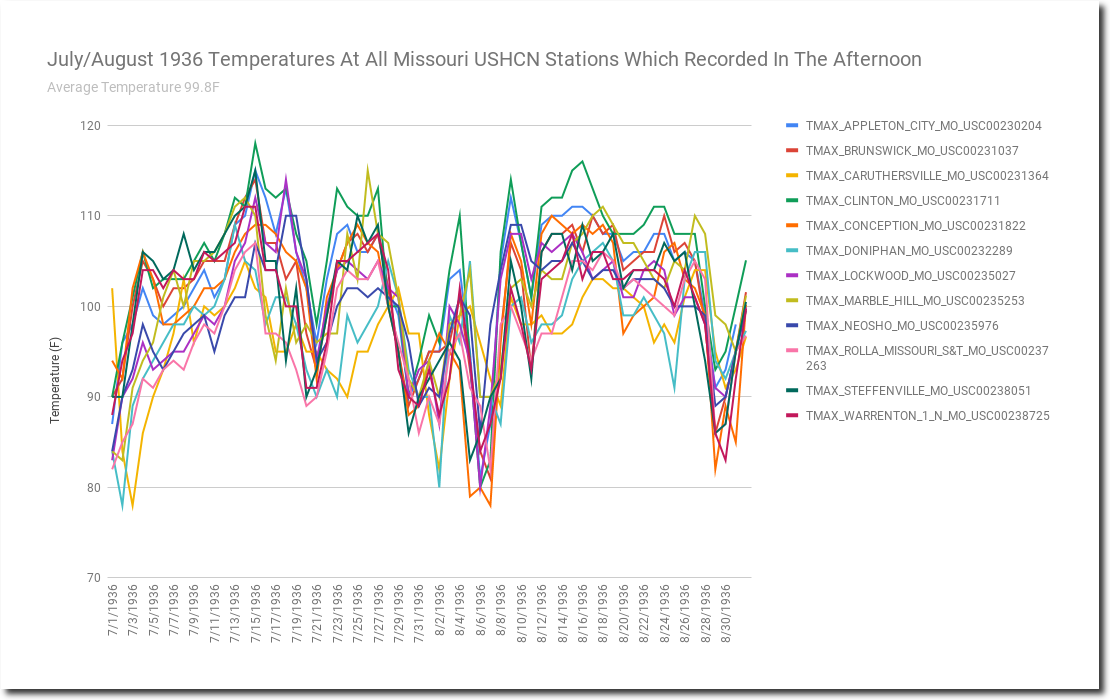
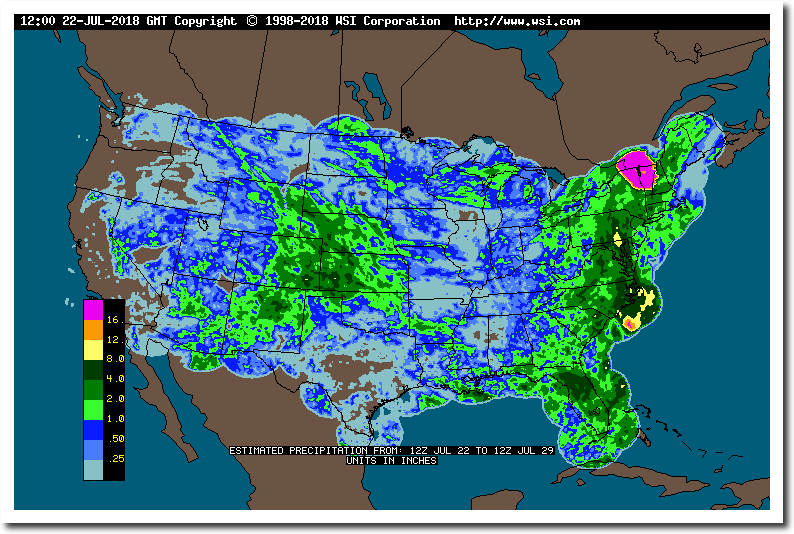
Looking specifically at Missouri temperatures during July/August 1936, there is no difference in temperatures between the two groups. Both averaged 99.8 degrees. Compare vs July 2018, which has seen no 100 degree days in Missouri, and an average temperature of 89.8 degrees – ten degrees cooler than 1936.
Mexico, Missouri took their readings in the morning, and averaged 101 degrees during July/August 1936. Warrenton, Missouri took their readings in the afternoon, and averaged 100 degrees.
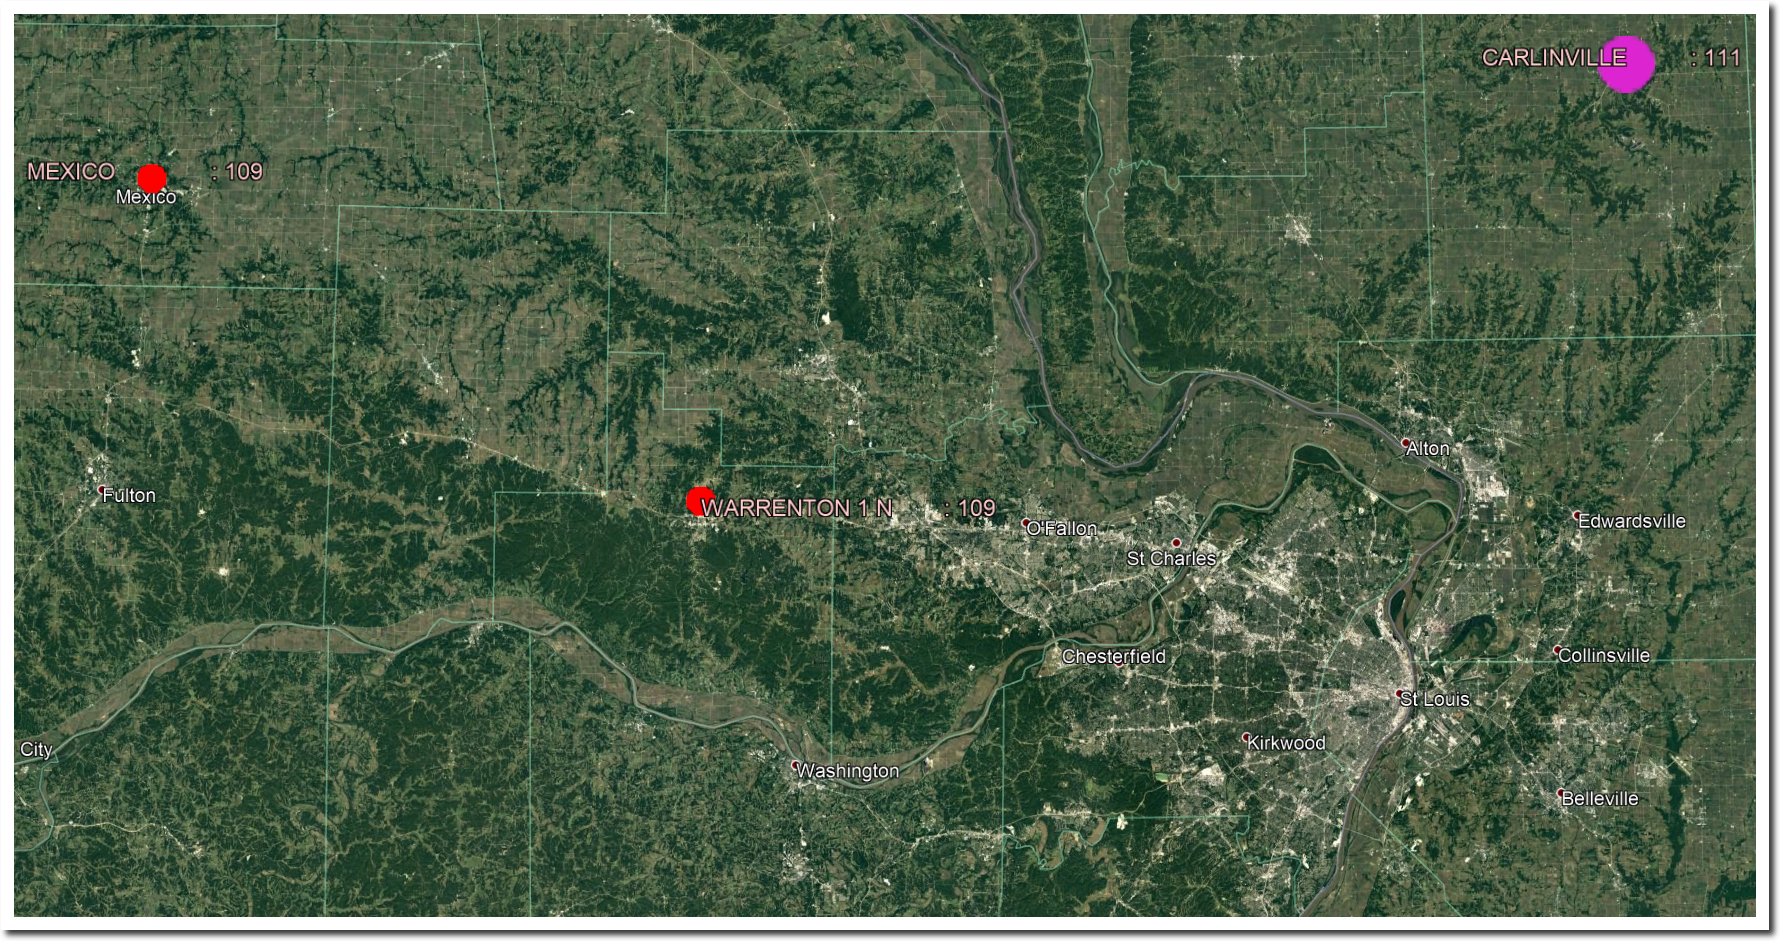
One difference is that the morning station (Mexico) tends to be shifted by a day, because they report maximum temperatures from the day before.
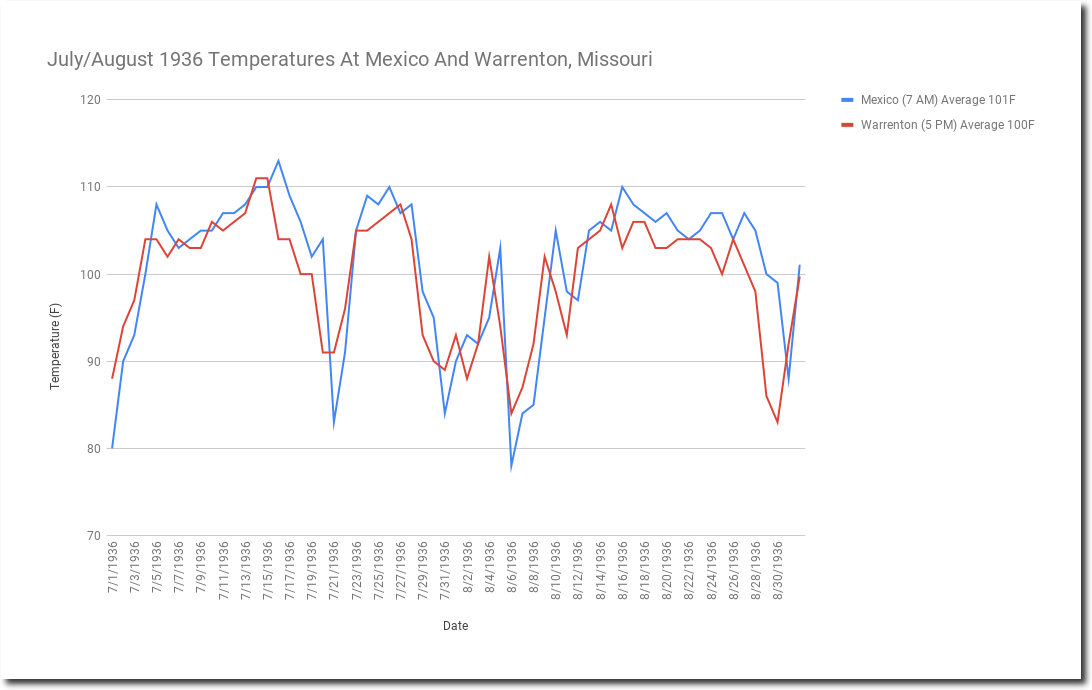
For example on this date (July 29) in 1930, Mexico, Missouri reported 113 degrees when none of the other stations came close to that. The really hot day was July 28.
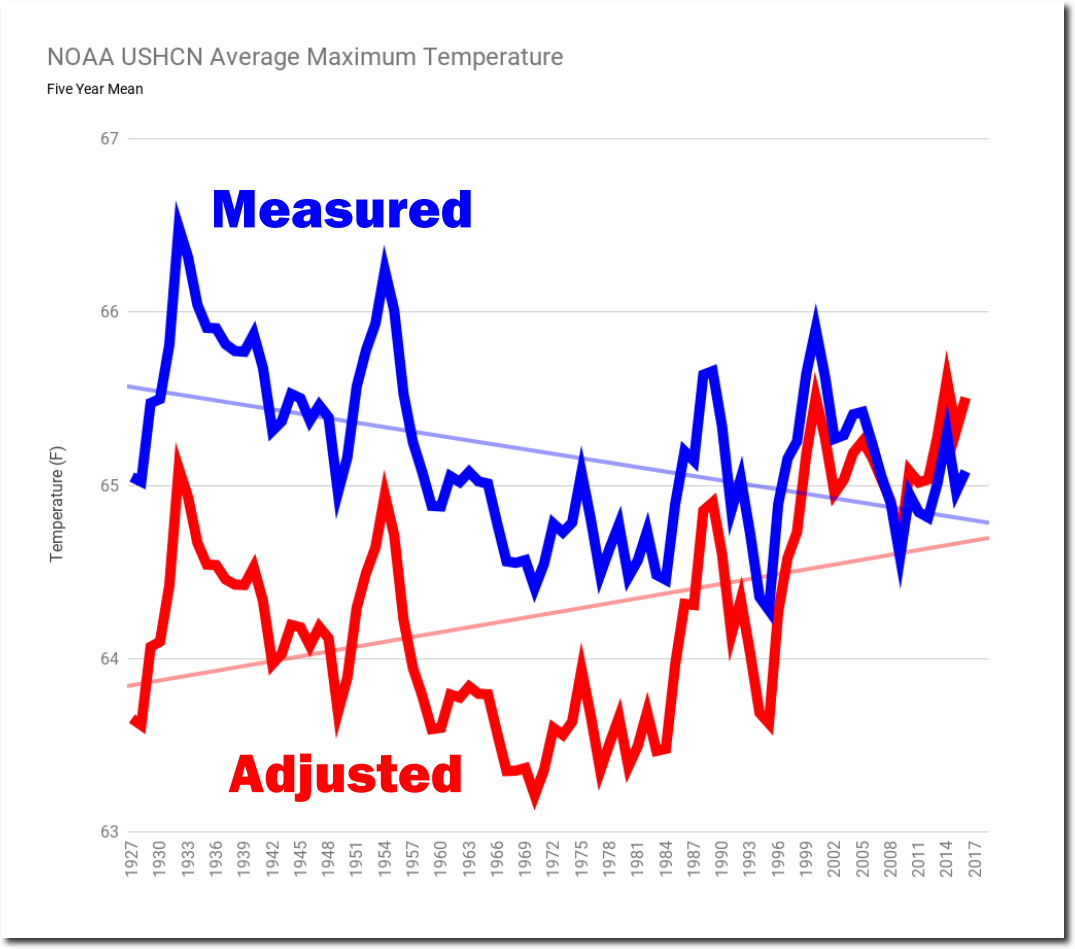
The bottom line is that the NOAA US temperature adjustments are completely fraudulent and destroy perceptions of the US temperature trend. They turn a long term cooling trend into a long term warming trend. And this was done to justify the even more fraudulent global temperature record.


