
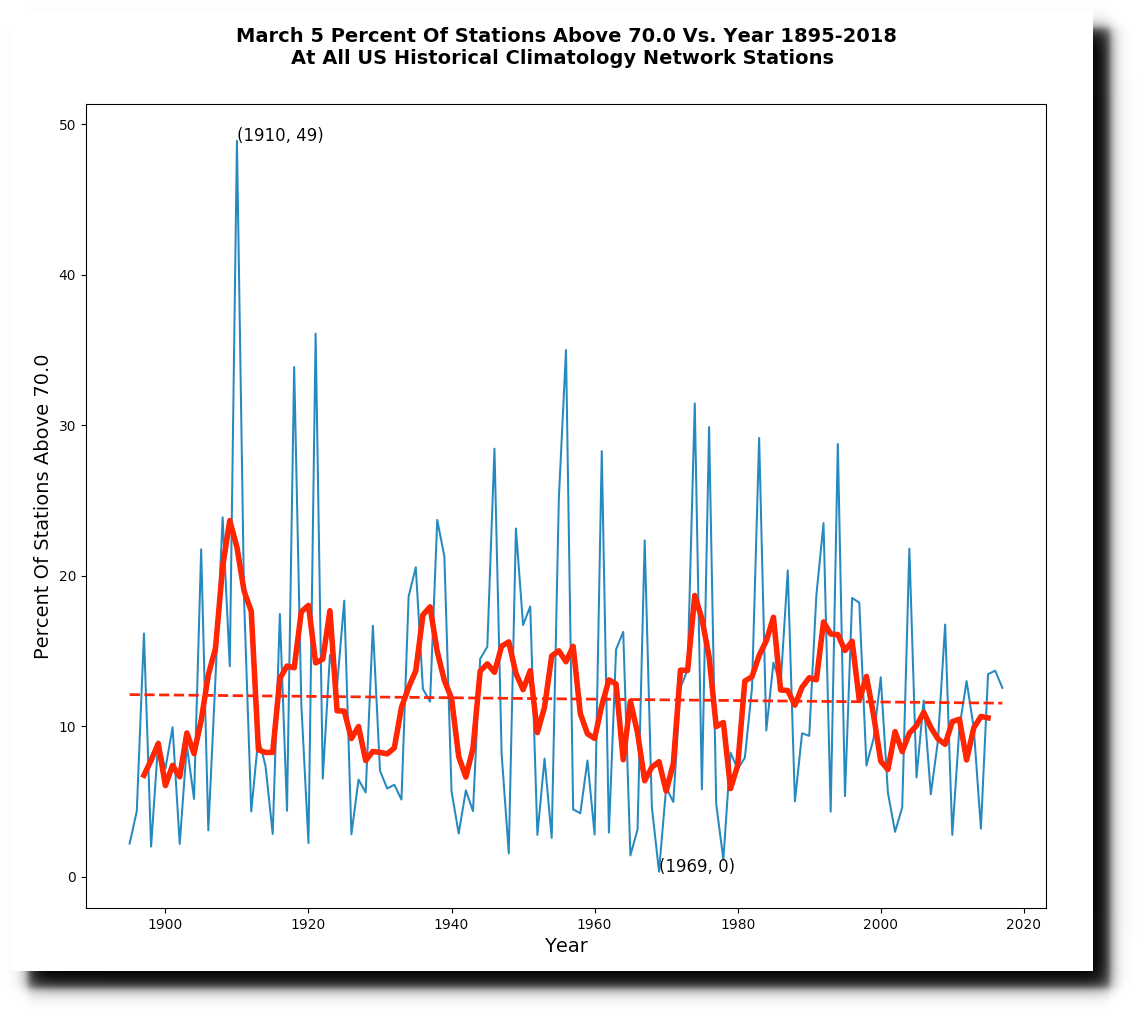
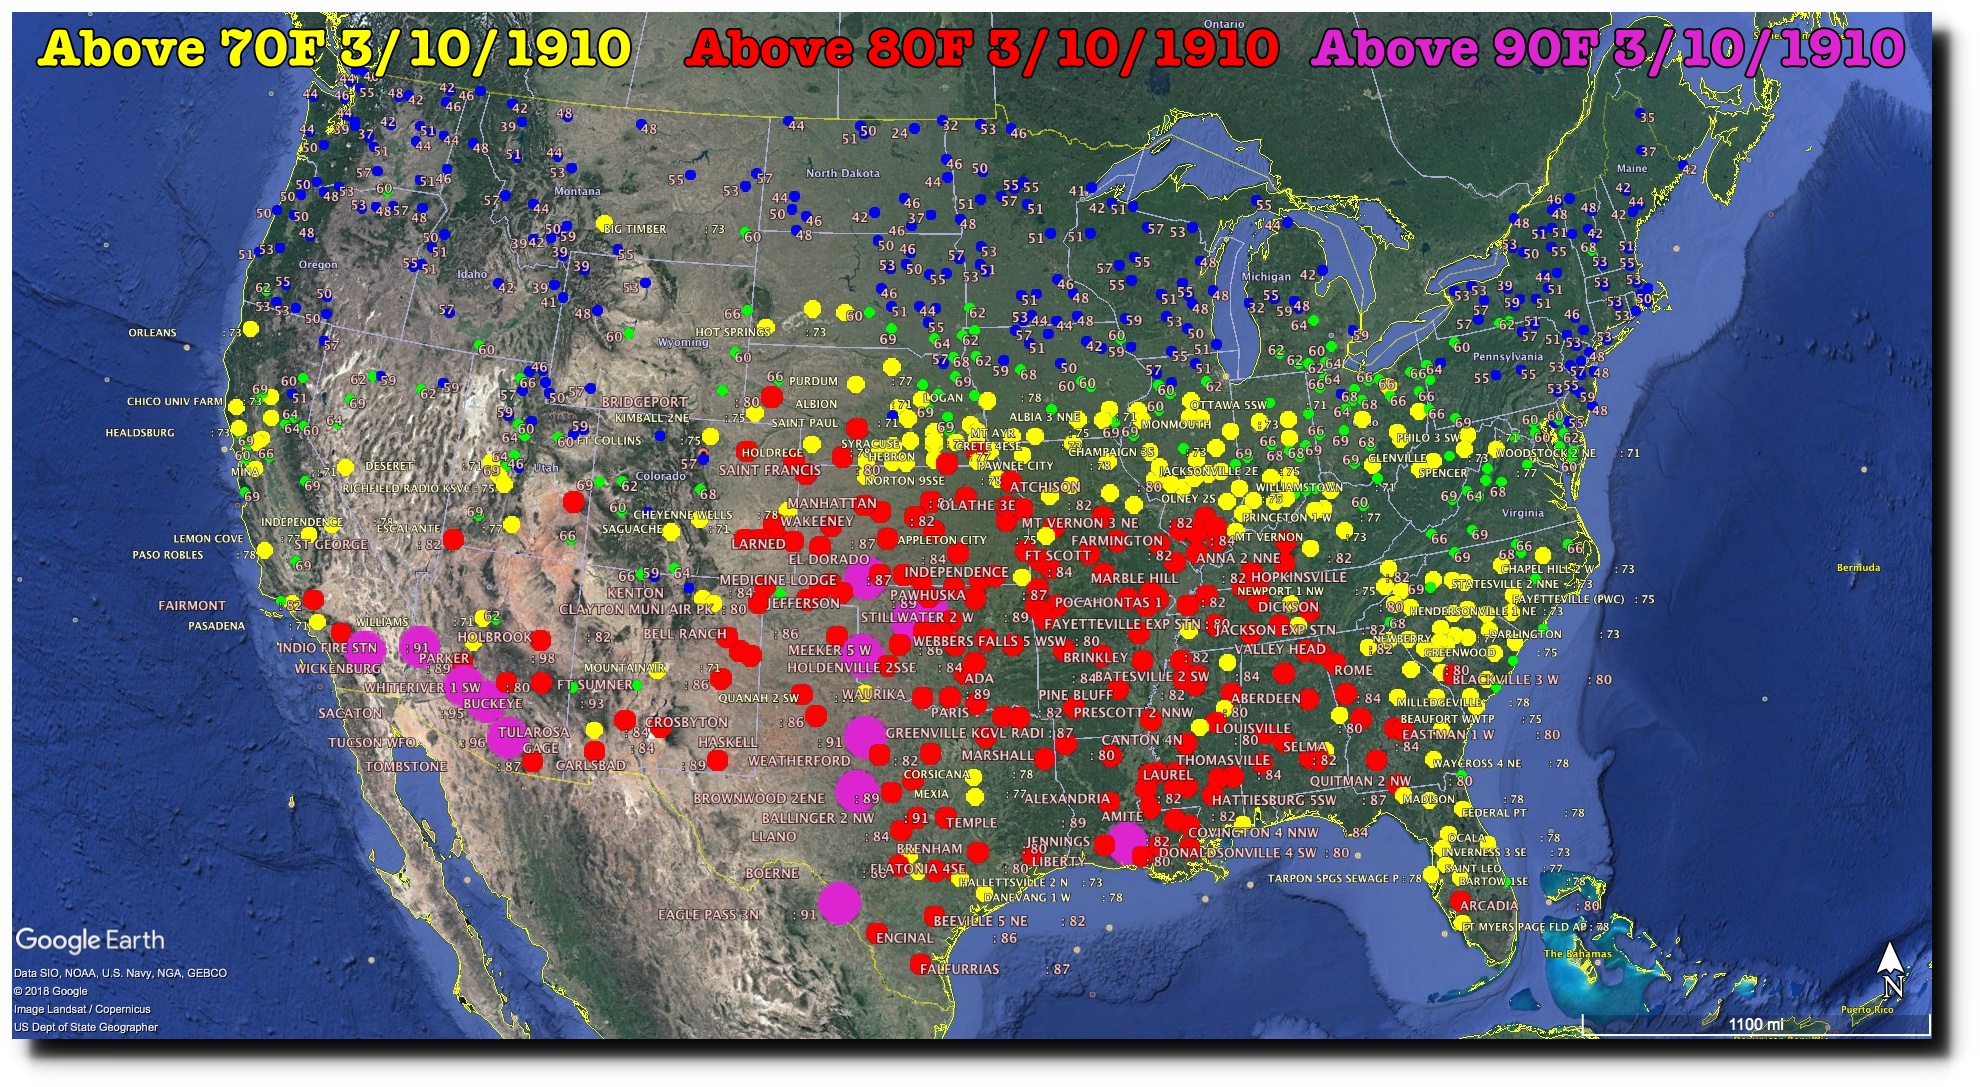
On this date in 1910, half of the US was over 70 degrees, and more than a third was over 80 degrees. Alabama was 85F, Arkansas 87, AZ 98, CA 82, CO 86, IA 78, IL 83, KS 91, KY 83, LA 93, MO 87, MS 87, NE 82, NM 87, OK 93, TN 82, TX 90, UT 87, VT 68
For the entire month of March, two-thirds of days were above 60F in 1910 – which was the warmest March on record in the US. CO2 levels were around 300 PPM.
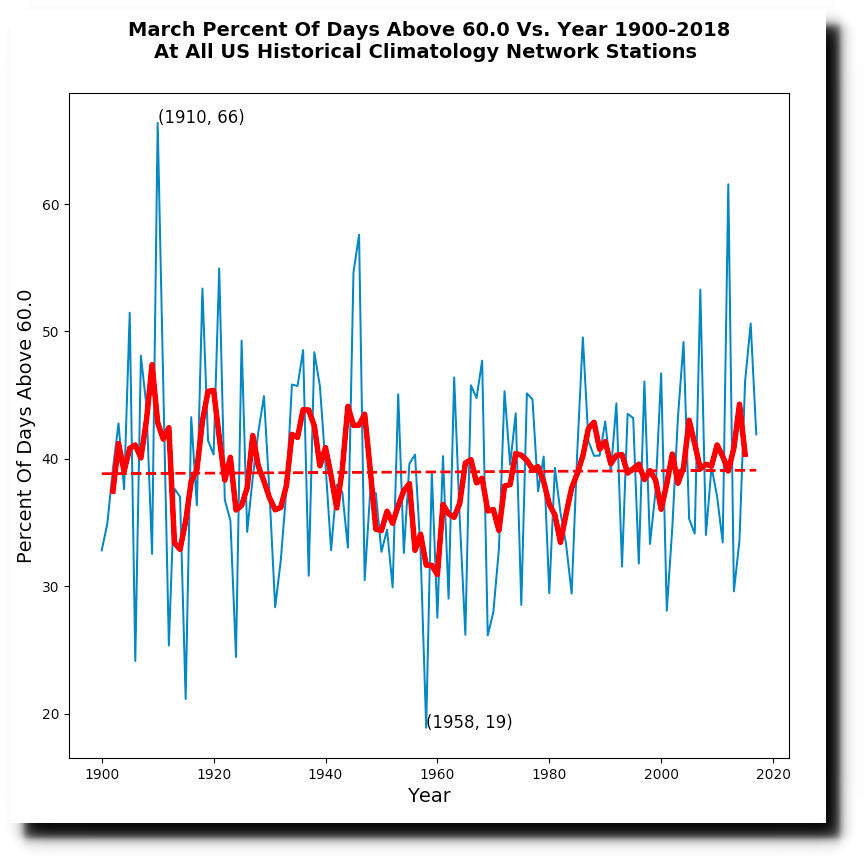
There is zero evidence supporting the superstition that CO2 causes warm days.
Marc Morano’s new book is awesome, and includes a lot of my historical research.

Climate experts tell us that Arctic sea ice extent (which has been increasing for six months and is right about what it always is this time of year) is the lowest in 12,000 years.
Polar ice is lost at sea | Grist
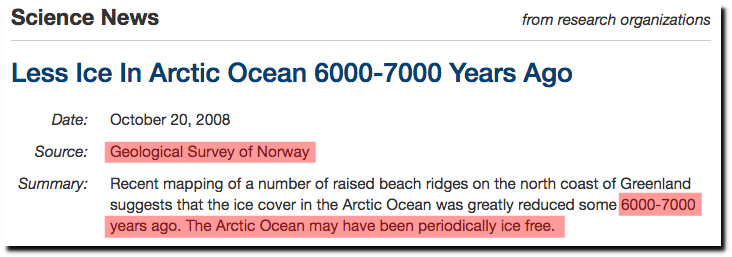
Apparently the current 14 million km² is less than 0 km² from 6,000 years ago.
Less Ice In Arctic Ocean 6000-7000 Years Ago — ScienceDaily
I prepared a reference chart to help understand this tricky climate math.
Ocean and Ice Services | Danmarks Meteorologiske Institut
This may seem difficult for a layman to understand, but it requires a level of spiritual understanding only available to Democrats – whose top climate prophet says the Arctic will be ice free in a few weeks.

During this week in 1962, a Noreaster (now known as a bomb cyclone) killed dozens of people and caused massive damage along the Atlantic Coast. The New York Senate approved construction of the World Trade Center, JFK was colluding with Russians, and NASA launched a satellite to study solar cycles.
08 Mar 1962, Page 1 – The Courier-News at Newspapers.com
According to climate experts – the satellite era began in 1979, talking to Russians is treason, and the Northeast never used to have coastal flooding.
As CO2 has increased from 340 PPM to over 400 PPM, March 3 US temperatures have plummeted more than five degrees.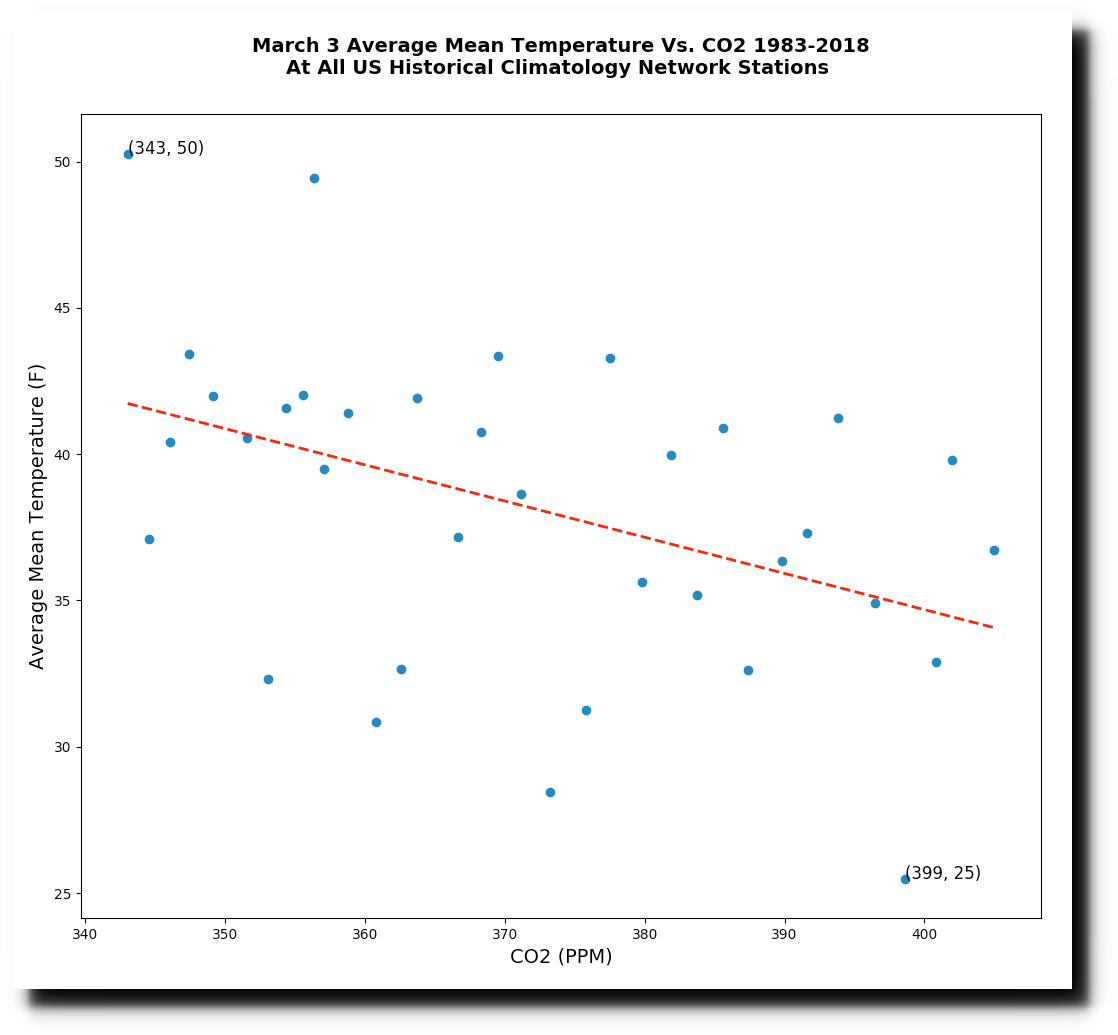

On this date in 1910, most of the US was over 60 degrees, and more than a third of the country was over 80 degrees. Arizona was 100 degrees, California was 98, Arkansas was 80, Illinois was 76, Kansas was 85, Kentucky was 85, Missouri and Mississippi were 80, New Mexico was 87, Oklahoma was 86, and Tennessee was 82.

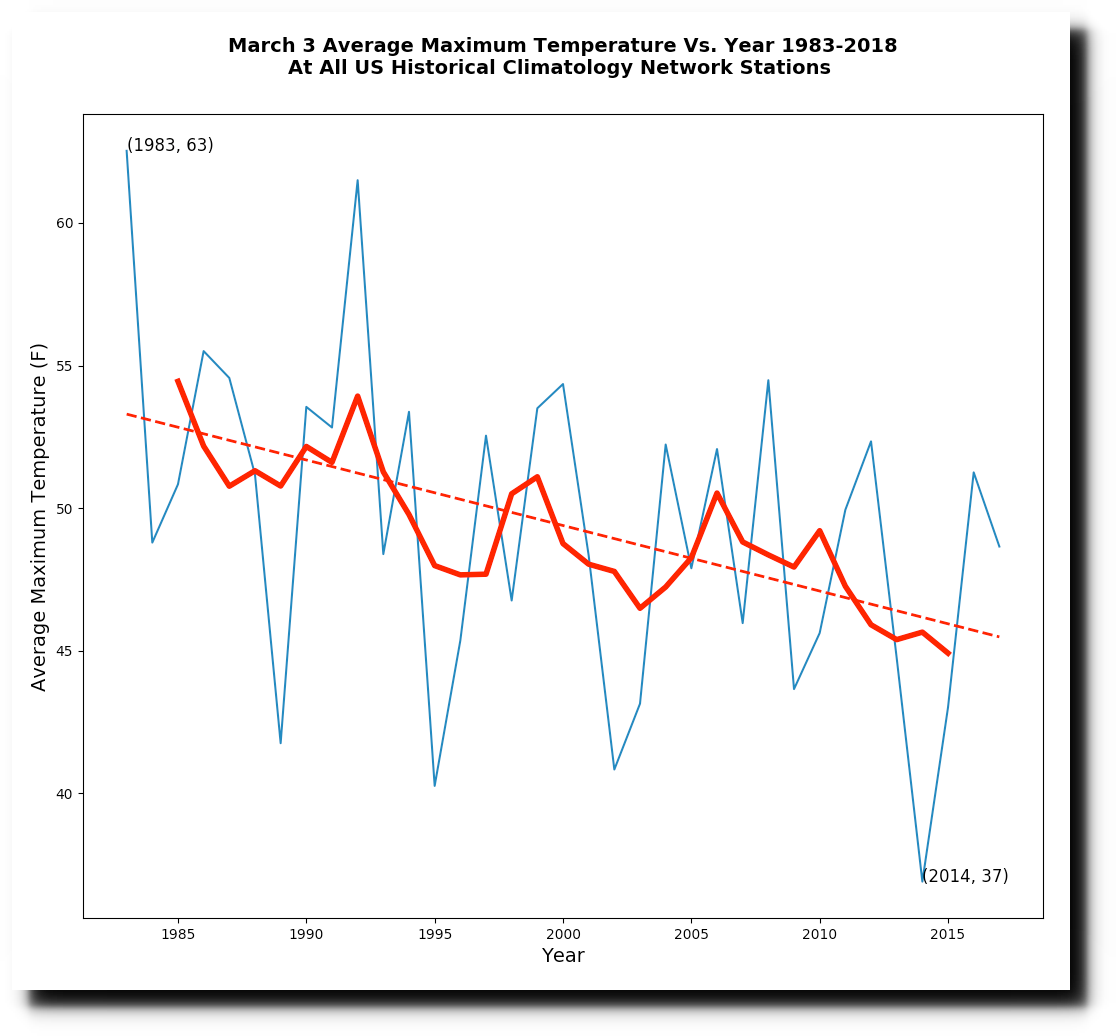
Compare 1910 vs. the very cold March 3 of 2014.


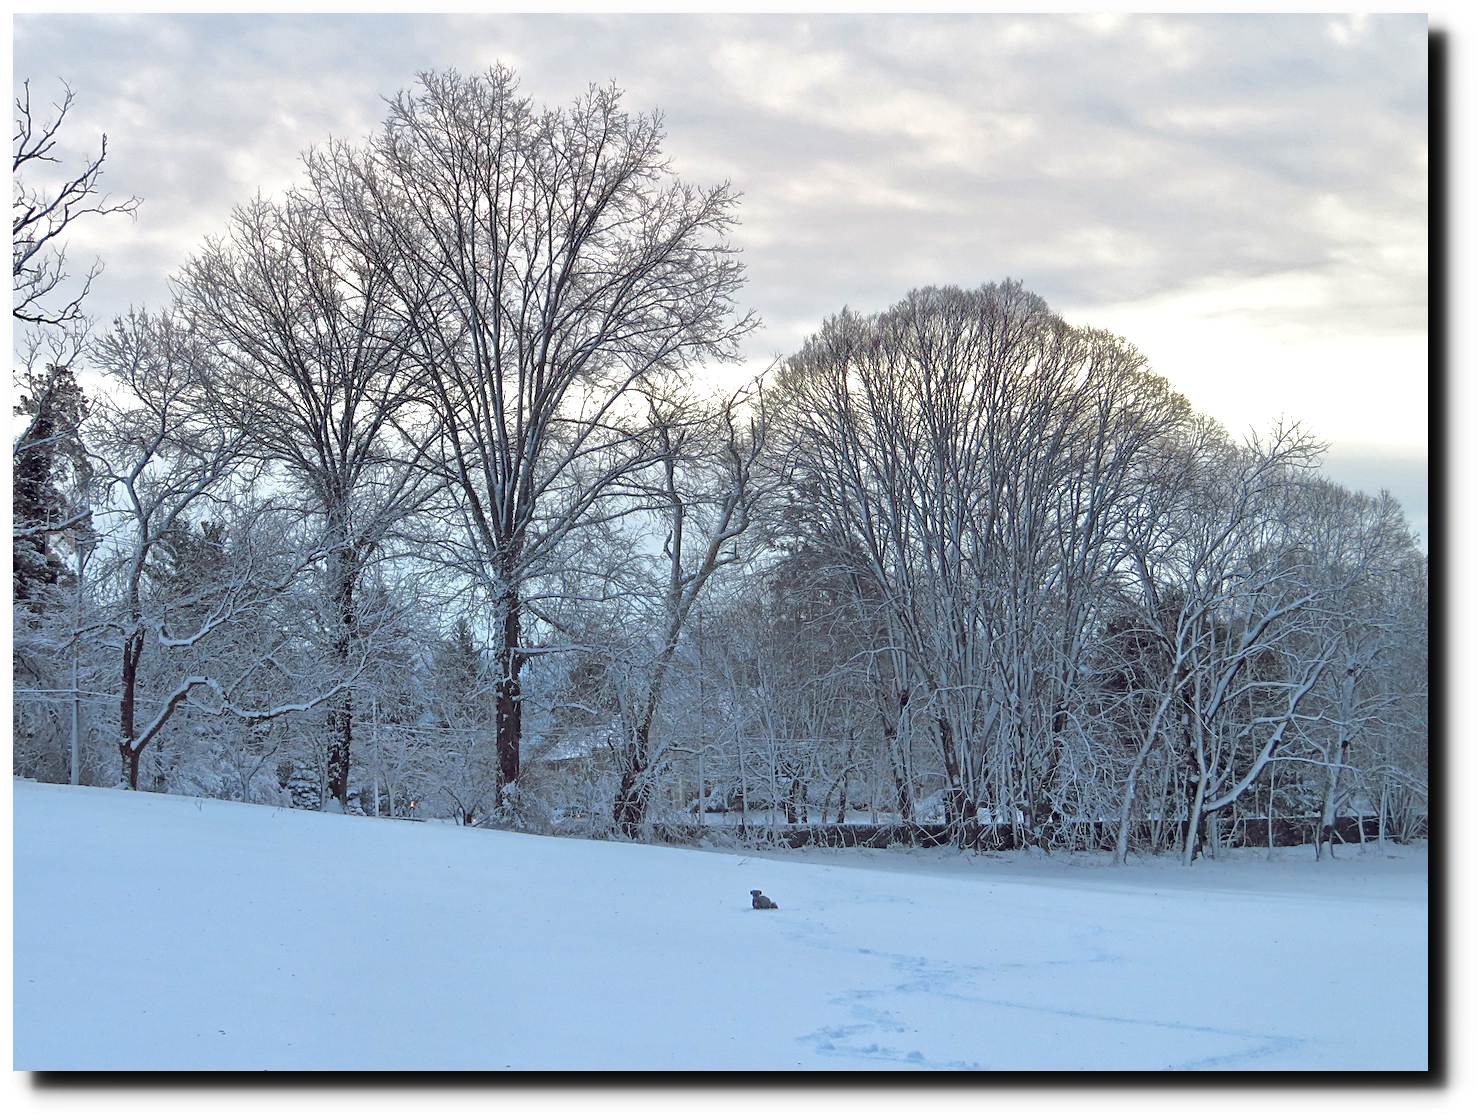
It is not all fun and games for Toto in Philadelphia. He is hard at work studying global warming in the eastern US for the next few weeks.


Most peer-reviewed climate experts begin their graphs around 1980. Who am I to disagree with them? Since 1981, US March 2 temperatures have plummeted about five degrees.
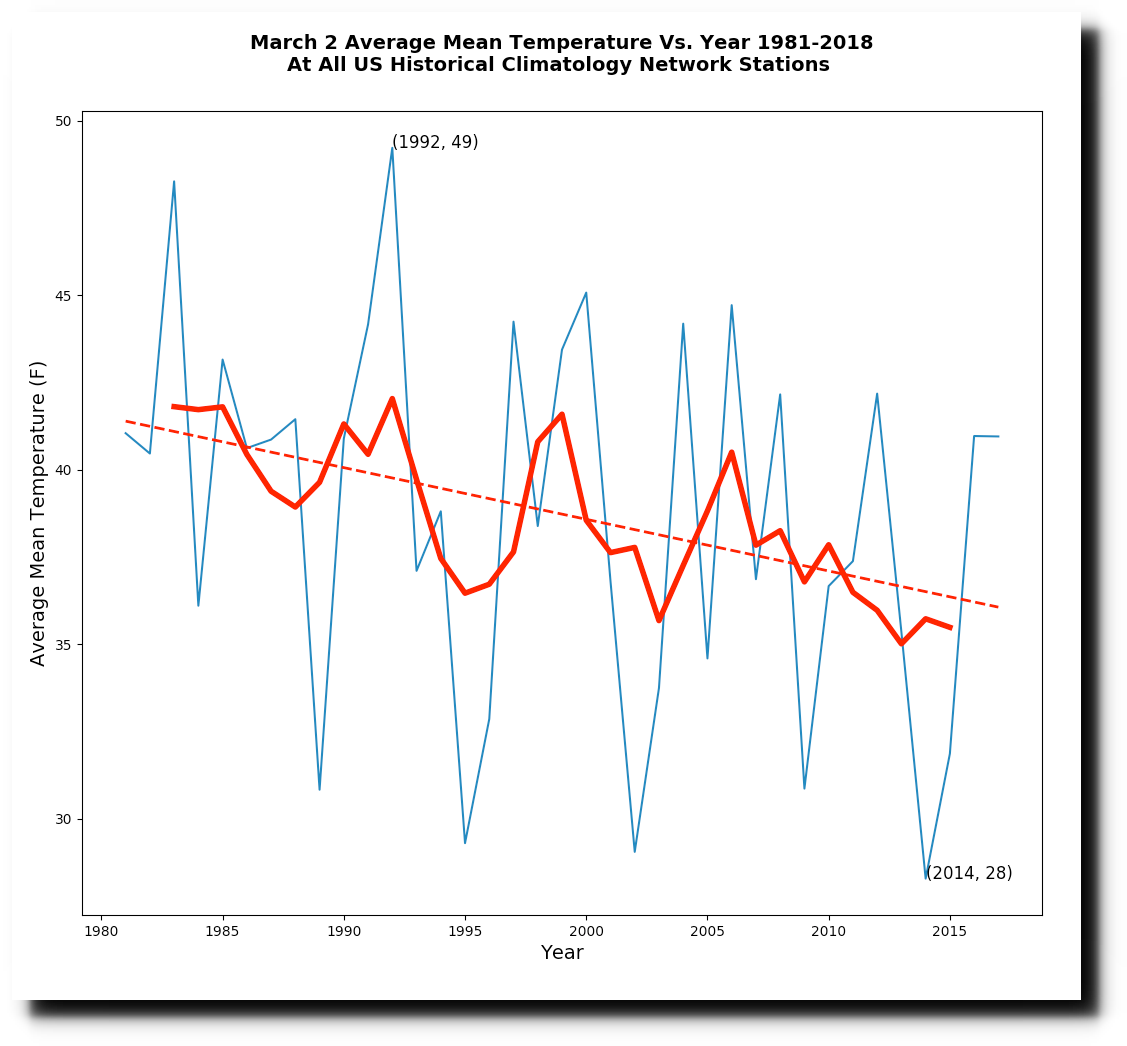
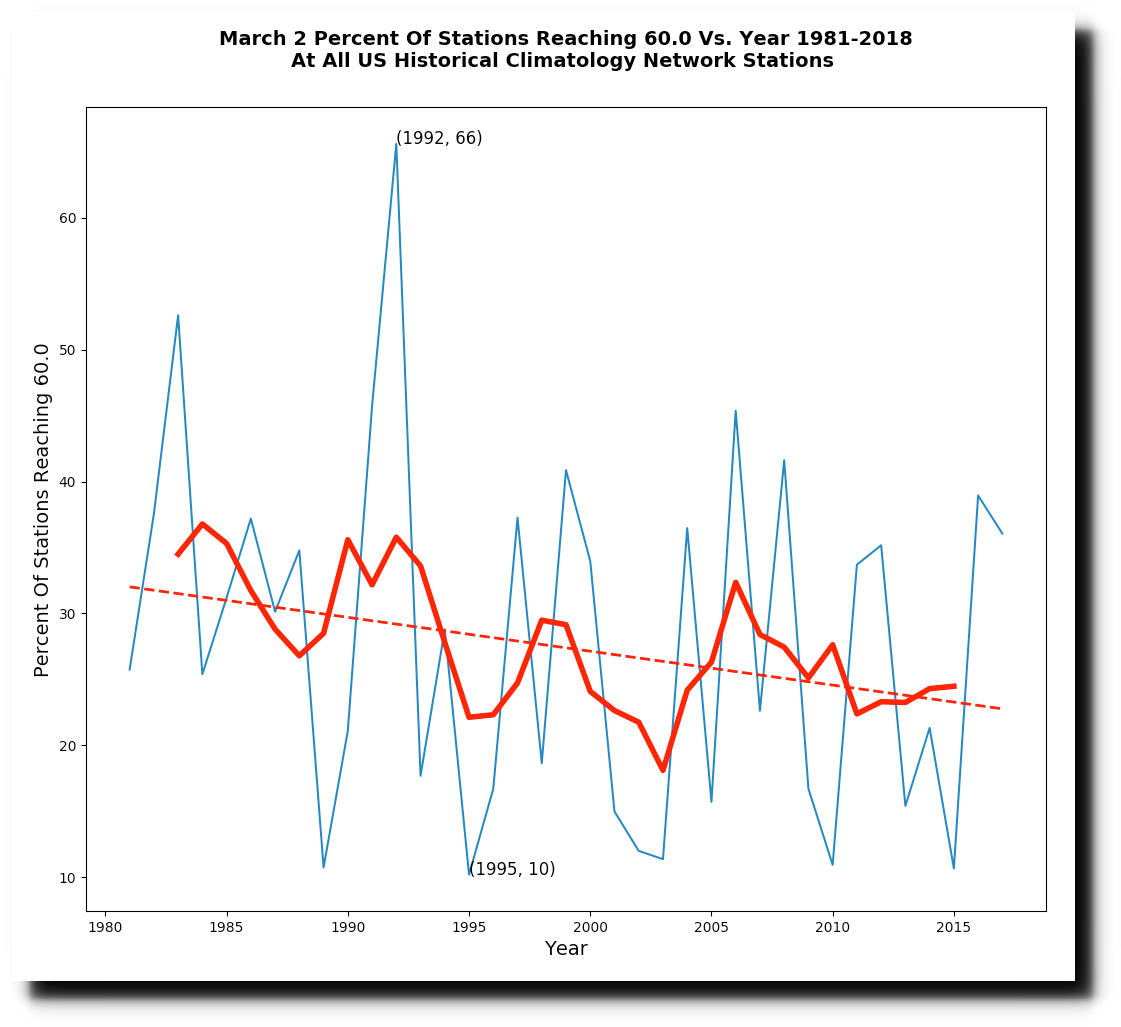
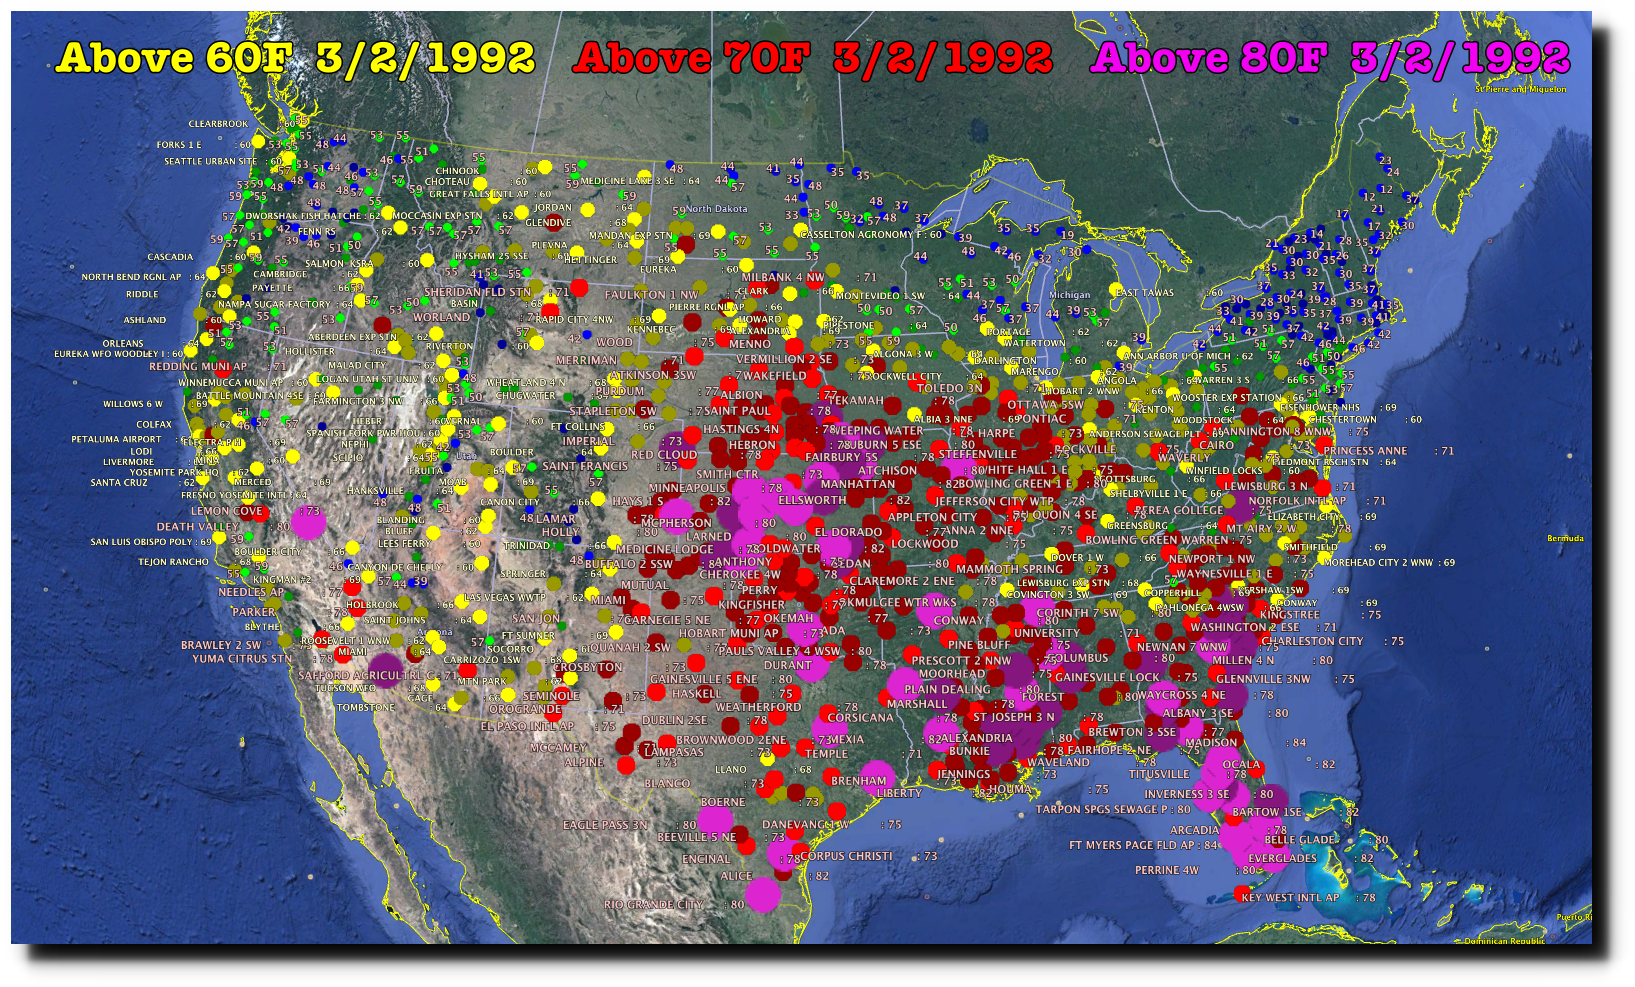
On this date in 1992, almost the entire US was over 60 degrees, and much of the country was over 80 degrees.
On this date in 1904, Kansas, Oklahoma, Texas, New Mexico and Arizona were all over 90 degrees. CO2 levels were 300 PPM.


