John Cook claims that there is a 40 Year Delay Between Cause and Effect when it comes to CO2
Let’s put that theory to the test.
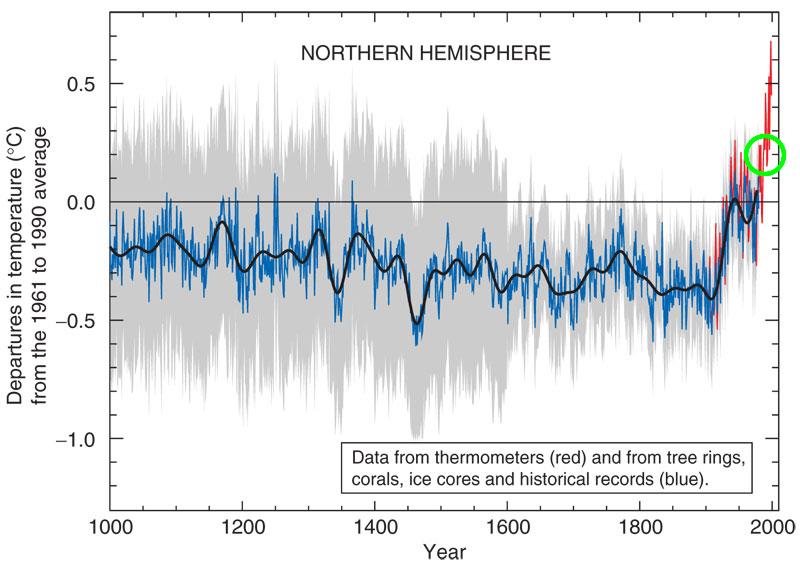
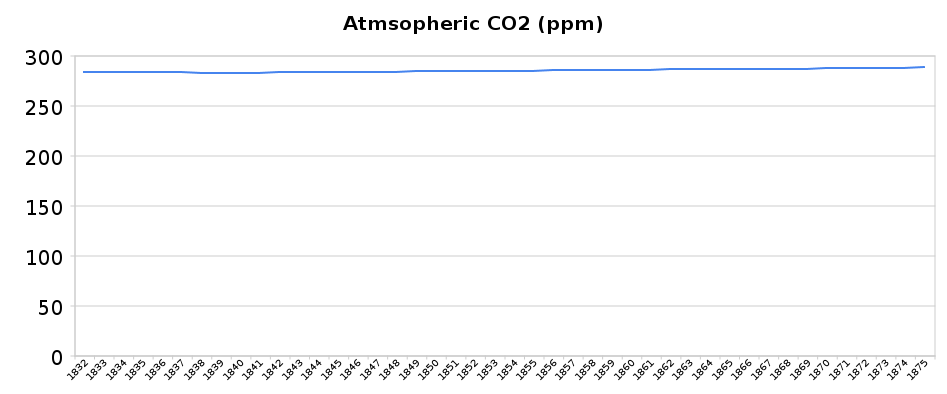
The peer reviewed hockey stick shows temperatures suddenly blasting upwards around the turn of the century. Using the Cook 40 year rule, that would imply a response to changes in CO2 from the middle of the 19th century. Only problem is, there weren’t any significant changes in CO2 around that time. Atmospheric CO2 was nearly dead flat.
So what is it John. Is the hockey stick wrong? Are you wrong? Or both?


Please show the CO2 graph so people can interpret it correctly. Why try to hide the upward trend that is clearly there?
Anyway, who is claiming that CO2 and CH4 are the only contributors to global temperature changes? Historical temperature data shows several down and up fluctuation of 2-3 °C following the dramatic rise after the peak ice age. Again, historical data has little bearing on predicting the future, other than that we can use our knowledge of history to improve our prediction models. But our prediction models must always use the most accurate trends we can obtain from historical data and make projections from the most recent data that has been collected.
Huh? The CO2 graph in the article is the “industry” standard Law Dome data. What is it you think I am hiding?
Roger Wehage says:
October 3, 2010 at 3:11 pm
Please show the CO2 graph so people can interpret it correctly
He did present it correctly. There is no spike in co2 that would cause a corresponding spike in temperature 40 years later as has been claimed.
He is pointing out that the Hockey Stick has made a spike in temperature before there was a spike in co2. Anyone can see that.
The graphs are an enemy of the ‘global warming’ belief system. They always show that ‘global warming’ isn’t what we were told it was.
Roger Wehage says:
October 3, 2010 at 3:11 pm
Anyway, who is claiming that CO2 and CH4 are the only contributors to global temperature changes?
Would you please provide the proof that co2 and ch4 control climate?
Only one caveat, you cannot use climate models. I want you to provide data from the real world that proves what you say.
Roger Wehage sez:
“historical data has little bearing on predicting the future, other than that we can use our knowledge of history to improve our prediction models”
1) Alarmists desperately want us to ignore historical data. Why? Because the historical data demonstrate that there is nothing even remotely unusual about current temperatures OR current trends. Nothing we see today is even remotely close to exceeding the bounds of natural variation seen in the past.
Worse still (for the alarmists) is the fact that ice core data demonstrate that both the Arctic AND the Antarctic are experiencing an on-going, uninterrupted 10,000 year cooling which shows NO SIGNS of abating.
The citation links and more details are found here and here.
2) Click here & examine just how laughable the alarmist computer models are.
3) Click here for some basic climate change science.
4) Click here to debunk the hysteria topic by topic.
“Roger Wehage says:
October 3, 2010 at 3:11 pm
Please show the CO2 graph so people can interpret it correctly. Why try to hide the upward trend that is clearly there?”
Instead of ppm he could use 1 CO2-molecule per x molecules of air (x is between 4000 and 3000), or he could use percentage of air molecules with a scale from 0 to 100.
In the first case he could show that one in 3000 is wonderful and one in 2500 sinks the world, in the second case the graph is on the time axis.
SBVOR writes,
“1) Alarmists desperately want us to ignore historical data.”
A good place to begin learning about what climate scientists actually do is by reading the IPCC AR4 report. Like much other climate research, it’s full of historical data. Here’s their paleo chapter, for instance:
http://www.ipcc.ch/publications_and_data/ar4/wg1/en/ch6.html
IPCC Report? Right – the one that says all glaciers will be gone in the Himalayas within 24 years.
Right. Since a publication isn’t 100% perfect and error-free is of no value whatesoever, we’d better get started on chucking out every encyclopedia, science text, and history book ever written.
Corrected:
Right. Since a publication that isn’t 100% perfect and error-free is of no value whatesoever, we’d better get started on chucking out every encyclopedia, science text, and history book ever written.
stevengoddard writes,
“Huh? The CO2 graph in the article is the “industry” standard Law Dome data. What is it you think I am hiding?”
You know very well what he means. But your readers are not sharp enough to see it?
I’m sorry, they never taught me the secret code.
They never taught you the secret code Goddard? Really? When was the last time that CO2 was 0 in the atmosphere? Lets hear it bud? Show the graph with the appropriate scaling first of all. Secondly if you even read much over at SKS you would know that SKS does not claim that early 20th century warming was primarily forced by CO2. In fact SKS suggests otherwise. Thirdly, if you deny that the thermal inertia of the oceans doesn’t result in a significant lag time between cause and effect then you really need to consult the literature. Finally Goddard, I noticed that you have tried to “address” quite a few of the AGW claims out there. Why not “address” papers such as Harries et al (2001) or Wang and Liang (2009). The first paper shows that less LW radiation is escaping from the atmosphere at CO2 bands than measured during the 1970s. The second shows that we have increasing downward LW radiation since the 1950s… You know what causes those two processes? An increasing Greenhouse Effect. Also you can address Evans (2006) while you’re at it. http://ams.confex.com/ams/Annual2006/techprogram/paper_100737.htm
Is there some reason why you don’t want to discuss the topic of this article?
So you’re clueless?
You are really clever. Have you ever thought of working in Hollywood?
Steven Goddard writes,
“IPCC Report? Right – the one that says all glaciers will be gone in the Himalayas within 24 years.”
Nope, what I cited is the 1000-page Working Group I report (Physical Science Basis), which devotes a solid chapter to glaciers, snow and ice:
http://www.ipcc.ch/publications_and_data/ar4/wg1/en/ch4.html
That unfortunate misstatement about Himalayan glaciers appears on one page of the 1000-page Working Group II report. Should never have got through, but I don’t think the glacier scientists were reviewing that section. It’s not what they believed or wrote in their own WG1 sections.
You knew that too, right?
Yea, right. And none of the scientists ever bothered to actually read the report.
Sorry, the IPCC in general is even more laughable than their computer models.
Face it! The IPCC is a purely political institution which never had as its goal the advancement of science. The sole purpose of the IPCC is now and always has been “to use the scientific community to build a case for regulating CO2 emissions. Period.“.
Yea what’s ridiculous about this is skepticalscience is claiming that if you turn on the heat on a stove the water waits 40 minutes until it starts warming up and then it warms up instantly to boiling.
Possibly the worst analogy I have ever heard.
Almost like the system would appear non-changing as you add heat. Then it would switch to a new regime, a boiling regime, after some unknown period of time.
But if that were true, there would be sayings like: “a watched pot never boils.” Given that saying doesn’t exist, we can conclude that the 40 year thing is silly.
{crickets}
You have to admit Steven Goddard – this post is lame; even for you.
Please tell me this is one of your weakest efforts. If this is your high water mark I will leave you to your little blog-post fiefdom.
You seem desperate to change the subject. I wonder why?
So now deniers are denying the influence of changes in insolation? Is there something you won’t deny? Just curious.
Why’d you show the scale from 0 to 300 goddard? When was the last time there was 0 CO2 in the atmosphere?
Please. Find something useful to think about.
Showing the full scale is accepted scientific practice, which may or may not be acceptable for propaganda.
If you must compress one axis to attempt to show a more severe trand than is actually present there is an accepted format for doing so (no idea how to reproduce a small wiggle vertical line in this text box to demonstrate), a format which, if I’m honest, I’ve not seen used in any climate reconstructions for (at least) the last few years.
Odd how accepted scientific practice is not considered to be acceptable.
robert says:
“Why’d you show the scale from 0 to 300 goddard? When was the last time there was 0 CO2 in the atmosphere?”
stevengoddard says:
“Please. Find something useful to think about.”
Directly answer the question Goddard? Why show it in the way you did unless you were trying to give the impression of not a significant increase? Your Y axis spacing is 50 ppm which makes it look flat. Plus you start your graph at zero. So I ask again, why start the graph at zero? When was the last time CO2 was at zero ppm?
The change in CO2 was tiny during that period. Please find something serious to think about.
Steven Goddard I have been around for 3-4 days. I have asked meaningful question (which you always dodge).
I note you call this “real science” – I assure you your blog will always be known as “Steven Goddard’s blog” or at best “real science” – by Steven Goddard.
Unlike skepticalscience or realclimate – they have earned the titles – no quotes.
I may stop by to ridicule something that comes to my attention (like making predictions with 3 months of tidal data or failing to understand a 40 year lag in climate, or even realizing the impact of changes in solar energy on the earth).
But I will never stop by here to learn anything. There is nothing to be learned from you.
Good day.
Tom
Don’t let the door hit you on the way out.
Steven, I think re-reading Alan’s post would help.
The post clearly discusses how temperature rise occurs, but gives a figure of 40 years for you to see close to the full change.
This sort of figure is used all the time: think of absorption depths in an optics, decay constants in radioactivity, a damping coefficient in SHM etc which all have simple mathematical ways of turning into a characteristic ‘time’.
A characteristic response time of the atmosphere of 40 years might mean, for example, that it takes 40 years for temperatures to respond to a point that means that just exp(-1) times the original heating is left unaccounted for. Or it might be a similarly arbitrary choice of ‘distance to equilibrium’. (yes, yes, climate is never _at_ equilibrium for a measurable time, but it is still a reference point that exists)
It DOESN’T mean that no heating occurs until 40 years after the event, which is why Alan discusses how there has already been CO2 caused warming, and that it is expected that there is more “in the pipeline”. Your creative re-wording of his argument is ridiculous.