Note, all NSIDC maps below have been modified with new colour schemes to make them easier to understand.
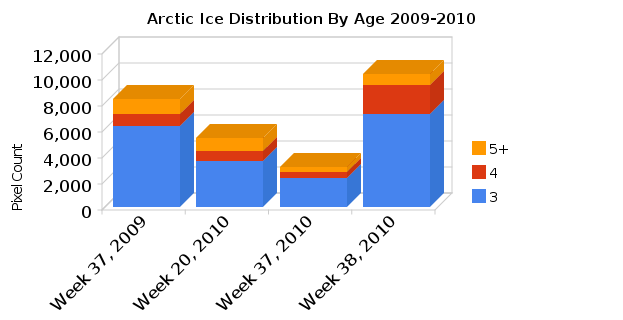
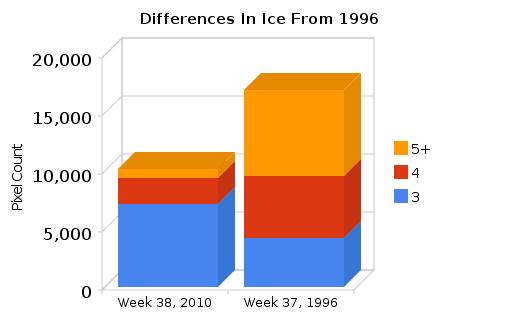
I did some more analysis of the NSIDC maps. The graph above shows the progression of ice over the past year. The first three columns are measured directly from NSIDC maps, and the last column I took the liberty of advancing all the ages of the ice by one year for week 38. Note that there is more three and four year old ice than a year ago, and less five year old ice.
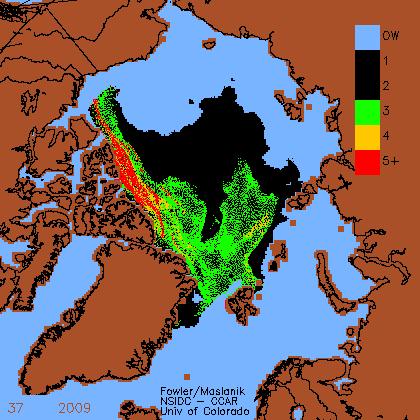
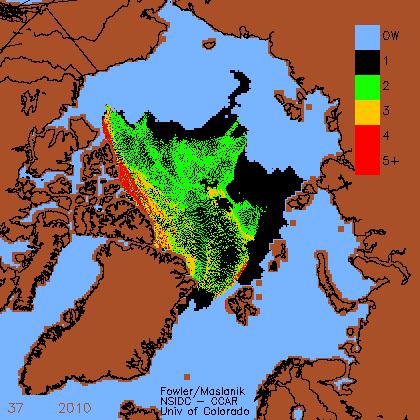
Note that much of the three year old ice melted during the last winter – before week 20, 2010. The map below from week 37, 2009 shows why it occurred. At the end of summer 2009, much of the three year old ice was doomed – because it was too close to the North Atlantic.
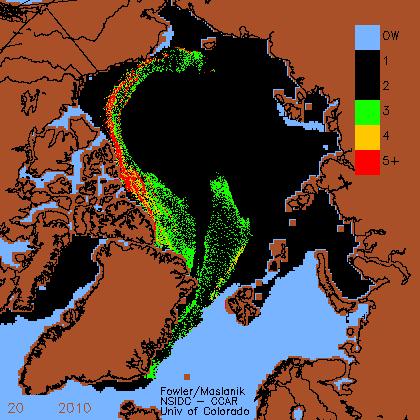
During the winter of 2009-2010 a lot of three year old ice blew out into the North Atlantic and melted. You can see the loss clearly in the week 20, 2010 map below.
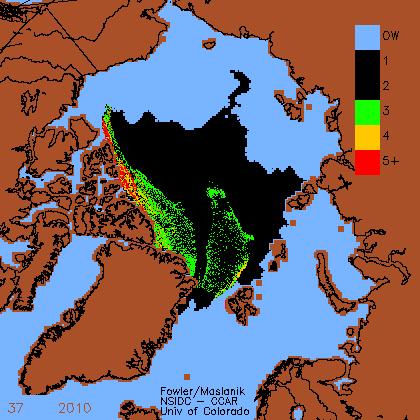
By week 37, a lot more three year old ice had melted, leaving very little.
But two year old ice was abundant, and when freeze started in week 38, the two year old ice became three years old. As you can see below, there is more three year old ice now than there was a year ago. And more importantly, the bulk of the three year old ice is located much further away from the North Atlantic. So it is quite likely that more multiyear ice will survive the winter.
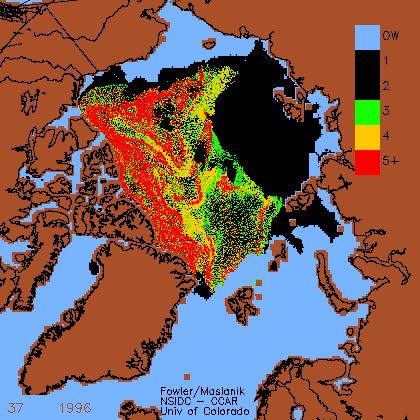
Now, let’s compare vs 1996. The graph below shows that there was a lot more four and five year old ice in 1996, but only half as much three year old ice.
The 1996 map is shown below.
Conclusions :
- Spring 2011 should see a lot more multiyear ice than Spring 2010, and a lot more three year old ice than spring 1997.
- The ice is increasing from the 2008 low.
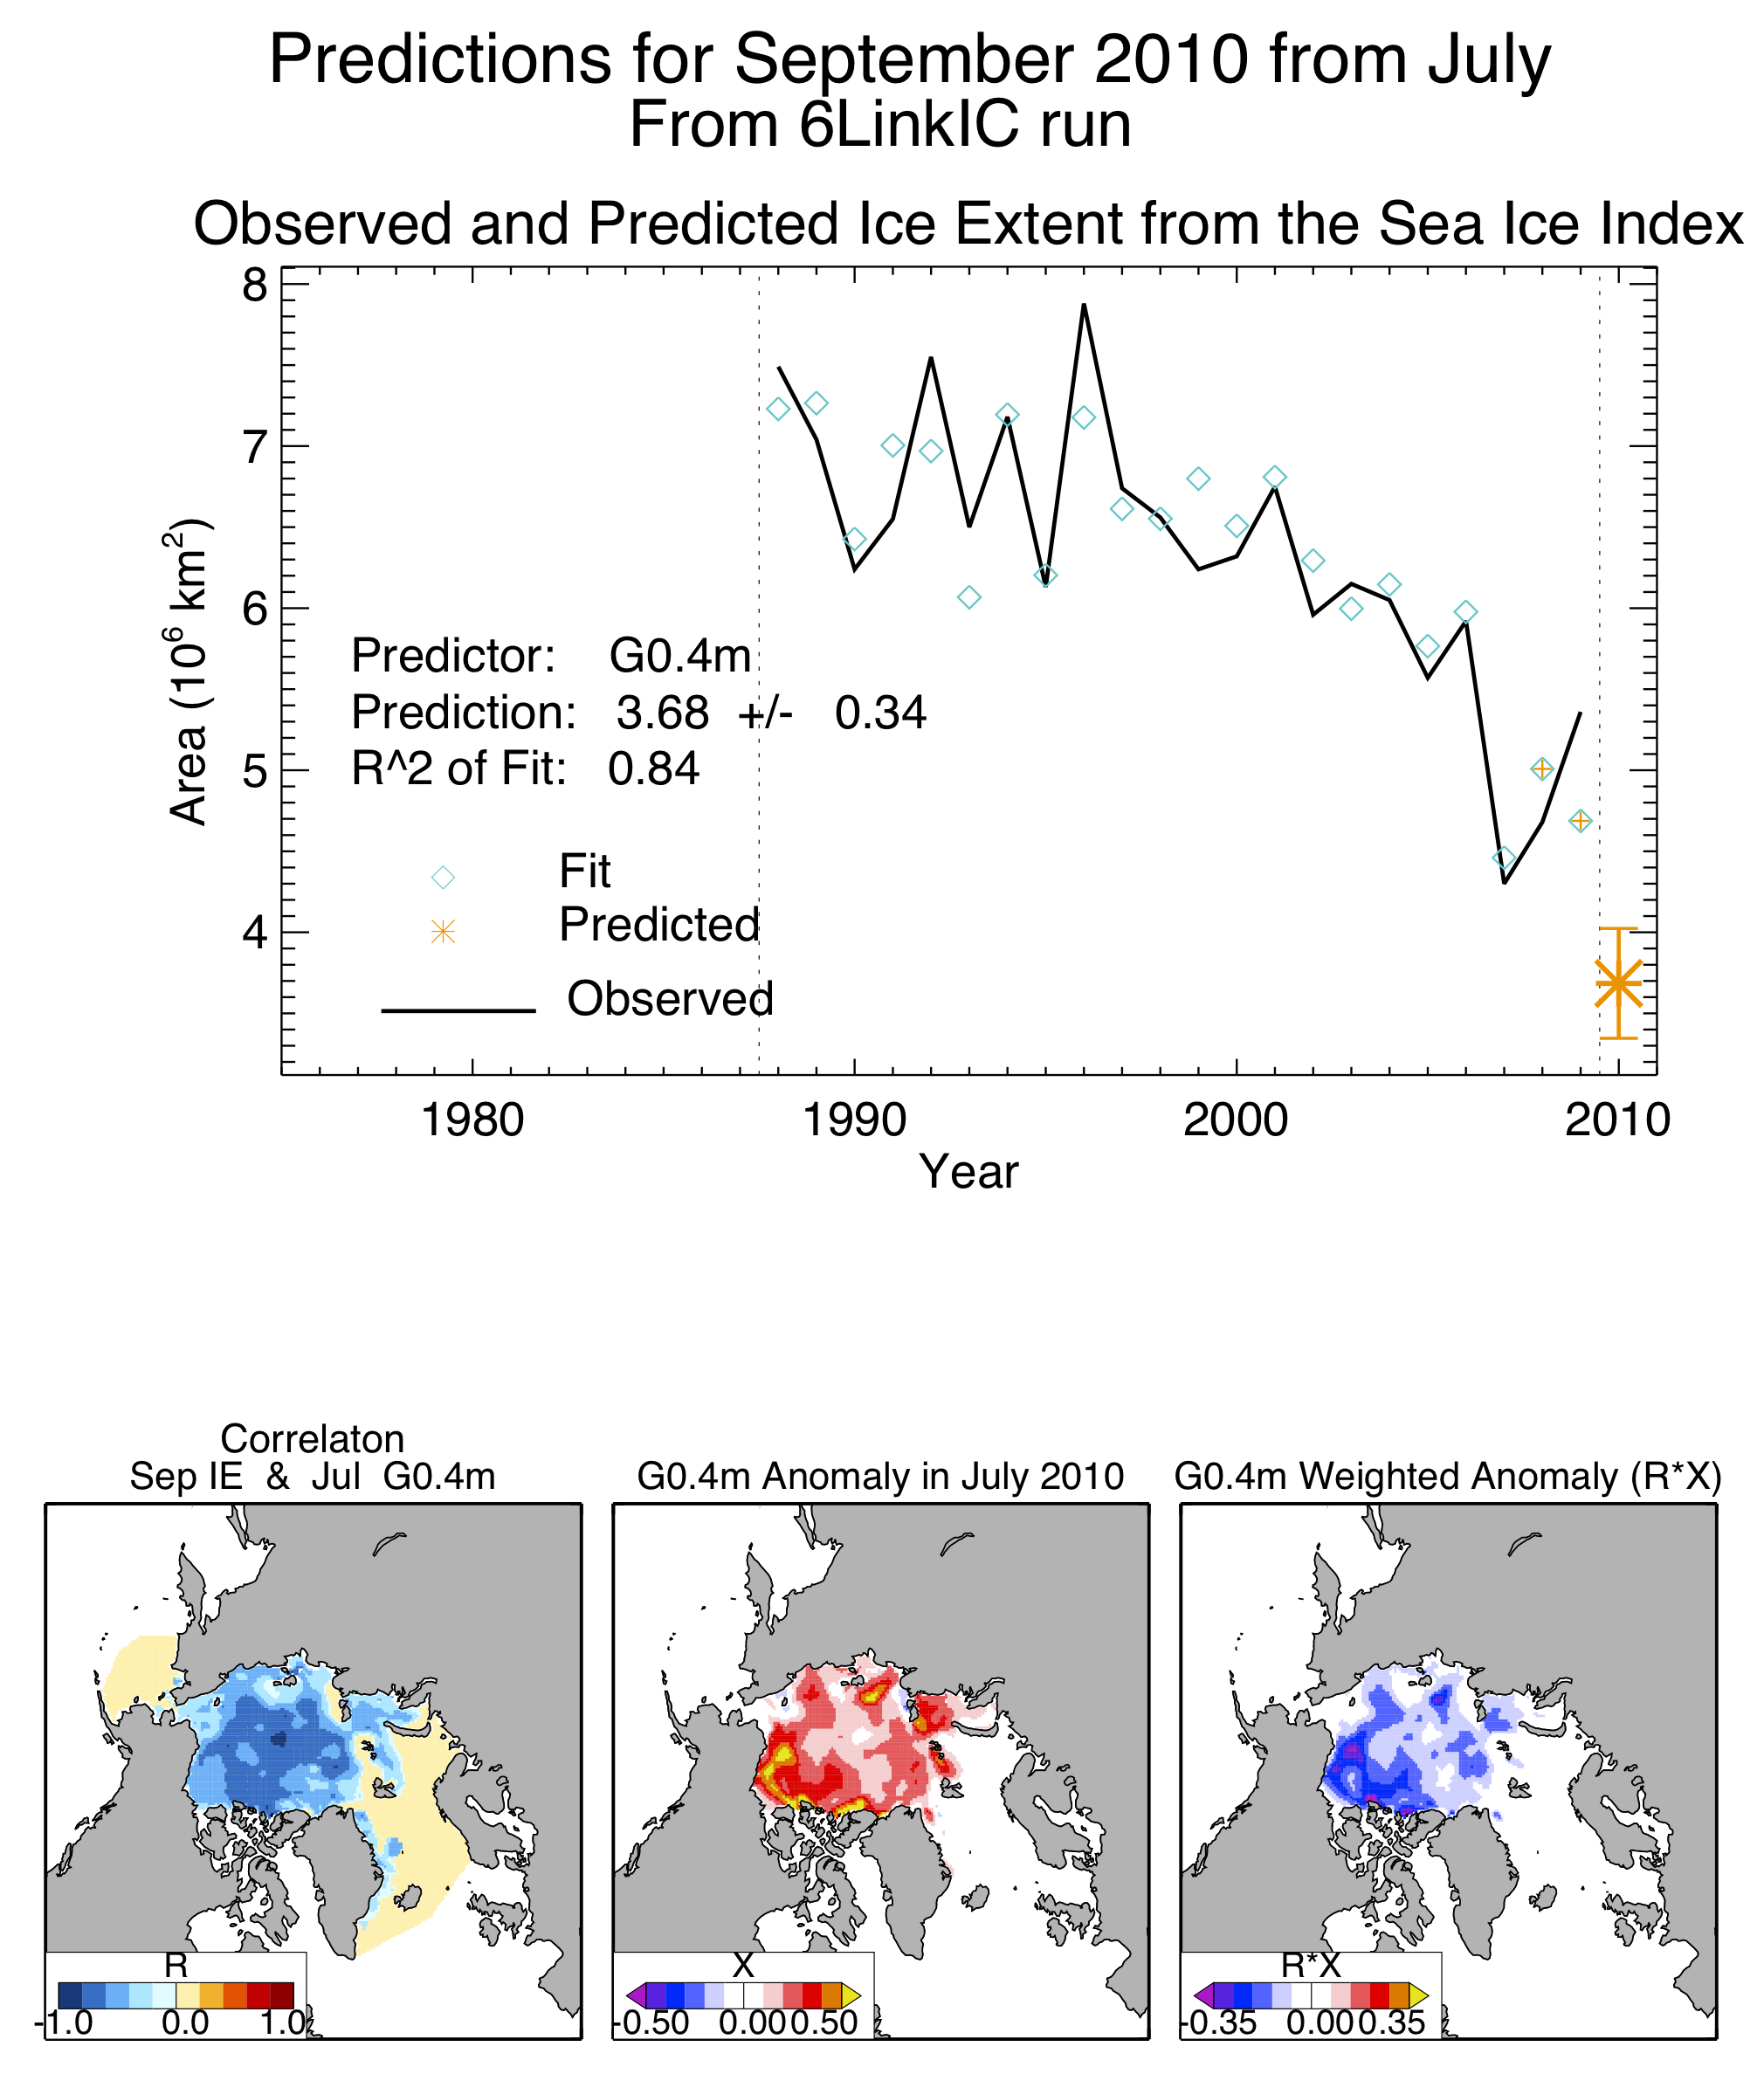
- PIOMAS is again shown to be off base with their claims that the ice is the thinnest on record. At the end of July, their forecast minimum extent was “3.7 +/- 0.3 million square kilometers” which was 25% too low.
- With the La Niña, we should see ongoing growth of multiyear ice through next year, at least.
Of course, strong winds could change all this.
———————————————————————————————————————————
Below is the PIOMAS 2010 forecast minimum of 3.7 million km²
Recap: Our method uses estimates of ice thickness from the PIOMAS coupled ice-ocean model as predictors for a statistical forecast of the Sea Ice Index mean ice extent in September. Fields of ice thickness (H), ice concentration (IC), area with less than 0.40 m thick ice (G0.4m), and area with less than 1.00 m thick ice (G1.0m) are the predictors considered in this forecast. The method is described in Lindsay et al (2008)


I still have no reason to be alarmed even if the NSIDC is right since we have evidence there was less ice during the Medieval Warm Period. There has been an increase in ice over the last 1000 years. And the animations made by the NSIDC are based in part on global warming hypothesis, having something to do with the hypothesis that Arctic ice has been eroded by currents of water that have been warmed by global warming.
Models are not a finished product but must be examined for accuracy. The new animations from NSIDC must be considered a work in progress until verifying evidence validates their output.
Why didn’t you add the 1st and 2nd year ice to your bar charts?
This article is about multi-year ice.
How does it compare to 1979 ice?
Steve,
The PIOMAS forecast you used is from July. The value I used is from the original Outlook based on May data. That is why our numbers different.
It is interesting that the PIOMAS forecast dropped as the forecast period shortened. I think that the rapid ice loss in May and June skewed the forecast downward and is an indication that PIOMAS was underestimating the ice volume.
As they state, there was a considerable amount of low concentration, thin ice that barely hung on at the end of the melt season and the winds were not favorable enough to push that ice together. As I’ve said before, the luck of the weather definitely plays a role.
However, as I stated in my Watts post, the most illuminating thing is that no one predicted an extent anywhere near what were not long ago considered normal conditions. The short term focus on whether there is more 3rd year ice this year instead of last year, misses the major point that conditions have changed considerably from earlier decades. Even though there will be variations in year to year, both in extent and the distribution of ice ages, the overall trend is still strongly downward.
walt
Walt,
Thanks. My PIPS forecast was made at the end of June – after the May-June decline you mentioned. So a fair apples to apples comparison would be vs. the PIOMAS July 3.7 forecast. In which case PIPS did much better than PIOMAS.
My point about 3rd year ice is that in 1996, MYI was in rapid decline – whereas now it is increasing.
Actually, Steve, your first post about about PIOMAS was in late April:
http://wattsupwiththat.com/2010/04/28/disconnected-computer-modeling/
You posted on PIPS by mid-June:
http://wattsupwiththat.com/2010/06/09/2007-sea-ice-post-mortem/
http://wattsupwiththat.com/2010/06/12/what-is-pips/
You made an initial forecast no later than June 23:
http://wattsupwiththat.com/2010/06/23/sea-ice-news-10/
At this time the forecast of record from PIOMAS was through the May data.
The PIOMAS forecast of 3.7 mill. sq km that you quote was for data through the end of July, so made in early August at the earliest. As I said, it is interesting that PIOMAS dropped lower for a shorter forecast period. There is still a lot to learn about seasonal forecasting – we’re really just starting. You’re estimate was not bad – it was the same as NSIDC’s initial estimate in June (our July and August estimates did better: 4.74 and 5.0 respectively). My point is that relying on the operational forecast fields from PIPS was misleading because, as I said in earlier posts, there was too much thick ice in PIPS. Likewise, PIOMAS went too low because there was probably too much thin ice in their model.
The was a large drop in MYI in 1996, but again my point isn’t one year fluctuations, but the long-term decadal trends.
walt
Walt,
My 5.5 (JAXA) forecast was made June 23, and I did not change it until mid-August.
My August forecast was 5.0 (JAXA) which was off by 2%. By contrast, the PIOMASS August forecast was 3.9, which was of by 20%.
The important thing is to get the guesses more accurate, hopefully Cryosat 2 will help with the initial conditions next year so we all have a better guess as Walt pointed out on WUWT.
Thanks for posting Walt, we all recognise you are putting your head above the parapet here. Can you elaborate further on how you can meld the new satellites data with your long running sequence from the old? Or will you not use it?
As you pointed out before, this seems a none trivial task.
Andy
Methinks that those who rely on trend lines to validate a position or an idea need take something else into consideration. If one has to keep adjusting the slope up or down because of new data the trend has probably changed. If one is used to using charting in the financial markets you don’t keep adjusting the trend line. You set it on whatever criteria that is used and if that line is penetrated and the data keeps trading above or below the line the trend has changed. Technically, I suppose you could keep adjusting your trend line but you would eliminate any opportunity to be on the right side of the market or climate temperatures for decades to millennia. Not sure that I would be willing to be that obstinate.