Update from John Cook :
Sorry it’s taken me so long to get to this discussion where earlier clarification would’ve been helpful.
Steve is correct that the caption of my Figure 1 is mislabelled – I should’ve said “NH land temperature”, not “NH temperature”. I’ve corrected the caption and indicated the update at the bottom of the blog post. Using instrumental land temperature is the appropriate metric as Moberg’s proxy is also a measure of NH land temperature. To use the full NH temperature would be comparing apples to oranges.
Steve is incorrect when he claims “he goes on and does climate sensitivity calculations based on bogus data from a cherry-picked hemisphere”. I don’t do any climate sensitivity calculations in this post. I’ve cited Hegerl 2000 which uses proxy data (not instrumental data) over the last 750 years to calculate a best guess climate sensitivity of around 3 degrees C. I’ve also compared this to the IPCC climate sensitivity range of 2°C to 4.5°C which is based on the full body of evidence (eg – proxy data over the last millennium, global instrumental data going back to 1850, global climate responses to volcanic eruptions, global satellite measurements of outgoing radiation, etc).
——————————————————————————————————
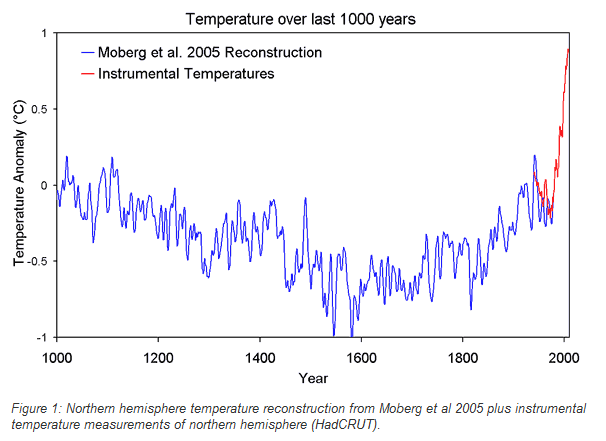
John Cook has taken the hockey stick to a new level of BS with the graph above. It shows northern hemisphere temperatures rising more than 1ºC since the mid-1970s, supposedly based on HadCrut.
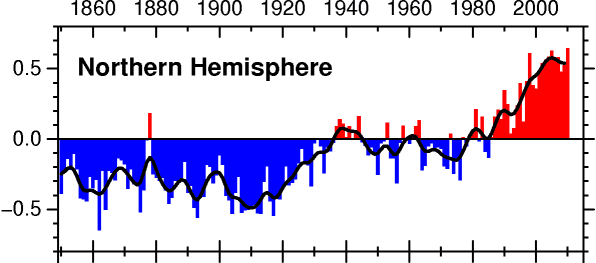
The actual HadCrut northern hemisphere graph shows a much smaller rise of about 0.7ºC since the mid-1970s, and little warming over the last decade.
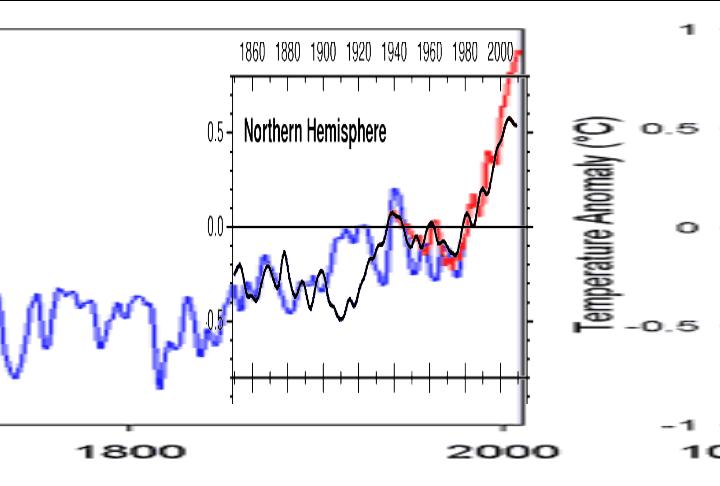
Superimposed on top of eachother at the same scale, you can see just how whacked Cook’s graph is.
Then he goes on and does climate sensitivity calculations based on bogus data from a cherry-picked hemisphere.
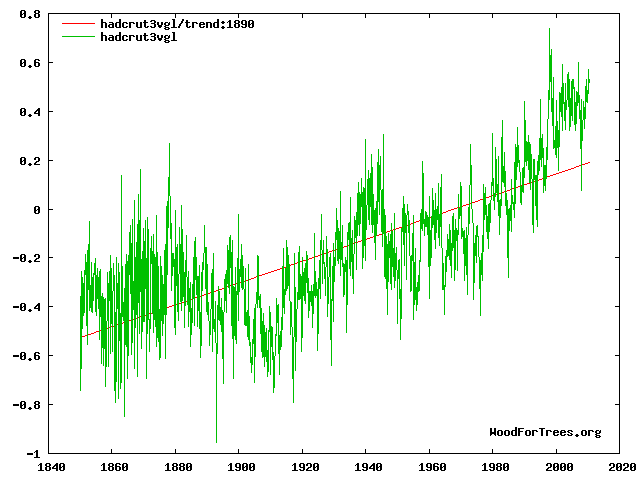
The global HadCrut graph shows a steady trend of about 0.6ºC /century. The period from 1910-1940 had a similar temperature rise to the period of 1970-2000, even though CO2 was much lower and increasing much more slowly than the later period.
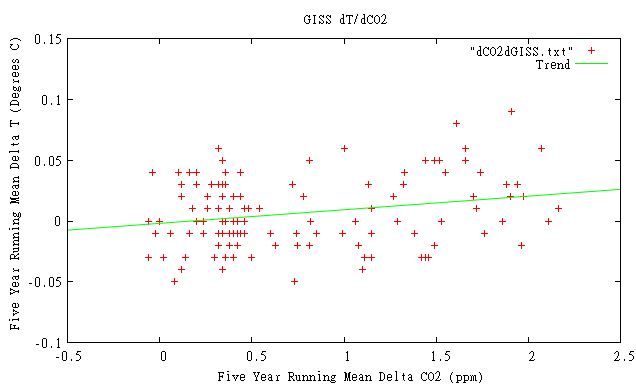
Even GISS shows no meaningful correlation between the annual rate of change of CO2 and the annual rate of change of temperature.
Yes John, your “science” makes me skeptical.
———————————————
Update : Reader “robert” tells me that Cook is using land-only northern hemisphere data in his “northern hemisphere” graph. In other words, more than half of the northern hemisphere is excluded from his northern hemisphere data.


CO2 light absorption band is saturated, don’t these idiots give up???????????
I have a graph before they deleted the volcano eruptions over the past 30 years,ill send if you like?
Yes John, your “science” makes me skeptical.
Nice.
A different angle at the Hockey Stick, one that includes long term perspective:
http://www.youtube.com/watch?v=9-B77WMFpxk
I’m suspicious. His graph looks like it’s been tricked out.
If it gets any worse we will all start to spontaneousley combust I hope the MSM are aware.
If it gets *much* worse the effect will start to affect previous years causing a global-warming-time-travel-feedback-loop, and consequent immediate planetary destruction.
New warmista hit show:
“Pimp my graph”
Goddard,
before you start ripping into every graph put forth, you should actually try exhausting your options before making any sort of insinuations of fraudulent behavior. Find the data (national paleoclimate archive) and plot it with the instrumental (crutemp (NH-Land)) and then see how it compares. Use 5-year averages. Man you guys just preach to the choir and don’t even wanna do the work. Either re-do your analysis, take down the post or there will be a response that 100% shows how fraudulent an analysis you have done here.
His graph is wrong. Is that an insinuation?
Spare the dramatics.
Actually John’s graph is right. You’re the one who’s wrong.
Somebody who writes a climate blog should surely know that most past temperature reconstructions are NH and land-only, because that’s what we have proxy data for. John is comparing apples-to-apples. If Moberg (or any other reconstruction) used global and/or land+ocean data, then that would be the appropriate instrumental data to use.
Someone who uses a graph that isn’t HadCRUT shouldn’t label it as HadCrut. Take it up with him.
Do you think it is reasonable to calculate climate sensitivity based on 20% of the Earth?
Crutemp NH V3 is here:
http://www.cru.uea.ac.uk/cru/data/temperature/crutem3vnh.txt
Moburg et al. 2005 is here:
ftp://ftp.ncdc.noaa.gov/pub/data/paleo/contributions_by_author/moberg2005/nhtemp-moberg2005.txt
Make 5-year averages then eat your words. You’re so wrong its not even funny.
If he is using land only NH temperatures (<25% of the planet) to calculate global temperature sensitivity, he should say that is what he is doing.
HadCrut shows fairly steady 0.6C/century rise since the start of their record. Do you think that is fraud?
Goddard,
I’m not here to argue about John’s point. You made an accusation that the graph was fraudulent. You are completely and utterly proven wrong. You put together a bad way of trying to prove the graph was wrong and you have been easily disproven. Admit that your accusation has been falsified. Its simple. you can try to squirm away and change the subject but you lost.
I said that his graph of HadCrut NH temperatures does not match HadCrut NH temperatures. The rest is all in your mind.
His graph is of crutemp V3 and you are comparing it to hadcrut
And without even exploring other options you insinuate mishandling of data. Could it be you just used to wrong index? What? Goddard of all people doing that? Shocking!
There’s a reason that even watts has to cut you off sometime over at WUWT. You’re unwilling to admit being in error even when you are.
I see. It is my responsibility to make sure him he labels his (HadCRUT) graph properly and to make sure that he doesn’t calculate global sensitivity off the wrong data set.
If Cook is only using crutemp V3 data to measure climate sensitivity then he needs to consider renaming his blog to Septical Science.
John Cook didn’t use moberg’s data to calculate climate sensitivity. The value he provides is the standard in the scientific literature.
Robert is once again correct. There are no climate sensitivity calculations in the blog post, so I have no idea where Goddard gets the notion to the contrary. All John Cook does is cite the standard range of 2 to 4.5°C for 2xCO2 with a most likely value of 3°C.
Usually when somebody is calculating something, there are, you know, actual calculations. Formulas and numbers and stuff like that.
Its not your responsibility to make sure he labels his graph right, but it is your responsibility to ensure that you have exhausted all other avenues before you make allegations of fraudulent behavior. You didn’t even both to plot the actual data (if you can’t afford excel you can use openoffice.org) or to even search for other possibilities (that he used the land index instead of land/ocean as would be EXPECTED if you were comparing land proxies to something).
Essentially all you did was saw something you didn’t agree with, and took it and ran with it. You didn’t demonstrate any objective behavior. You let your pre-conceived ideas dominate your views on the subject. No it cannot be true, they must have mishandled the data!!!!
Epic fail
The graph says HadCRUT, it isn’t HadCRUT. I called him on it.
The only person making any ridiculous allegations is you.
Usually when “calling” someone on something, you don’t immediately assume their actions are “BS” and “whacked”. What most people would do is probably try to figure out the reason for the discrepancy rather than immediately insulting the other person.
Like personally, I would have thought to myself “you know, seeing as how Moberg’s reconstruction used proxy data for land temperatures, I bet John Cook is using land-only instrumental data.” Or, if I wasn’t informed enough to know anything about temperature reconstructions (despite being the author of a climate blog), maybe I would write a blog post about it without using statements like “BS” and “whacked” to describe a discrepancy that I couldn’t immediately explain.
But maybe I’m just not good enough at manufacturing controversy. Maybe that’s why I’m not a ‘skeptic’.
“Figure 1: Northern hemisphere temperature reconstruction from Moberg et al 2005 plus instrumental temperature measurements of northern hemisphere (HadCRUT). ”
“Figure 3: Climate sensitivity from palaeoreconstructions going back 750 years, combined with climate sensitivity calculated from instrumental records. The horizontal bars represent the 5 to 95% range, indicating a climate sensitivity range of 1.5C to 6.2C (Hegerl et al 2000). ”
“When you combine the temperature record over the past millennium with climate forcings, you get a climate sensitivity around 3°C.”
So are you telling me that the paleoclimate sensitivity calculations have been made on the basis of NH land temperatures only?
That sounds like a good topic for an article.
No, I’m not saying that. That’s probably true for some climate sensitivity calculations, perhaps including the one referenced in John Cook’s article (which uses data going back 750 years). But I wouldn’t presume to make such a broad statement without first researching the subject.
It’s not Cooks graph. It clearly says it is from Moberg et al 2005 and is from the peer reviewed paper; Moberg, A, D.M. Sonechkin, K. Holmgren, N.M. Datsenko, and W. Karlén, “Highly variable Northern Hemisphere Temperatures Reconstructed from Low- and High-Resolution Proxy Data.” Nature, Vol. 433, No. 7026, pp. 613 – 617, 2005.
http://www.nature.com/nature/journal/v433/n7026/abs/nature03265.html
Sorry it’s taken me so long to get to this discussion where earlier clarification would’ve been helpful.
Steve is correct that the caption of my Figure 1 is mislabelled – I should’ve said “NH land temperature”, not “NH temperature”. I’ve corrected the caption and indicated the update at the bottom of the blog post. Using instrumental land temperature is the appropriate metric as Moberg’s proxy is also a measure of NH land temperature. To use the full NH temperature would be comparing apples to oranges.
Steve is incorrect when he claims “he goes on and does climate sensitivity calculations based on bogus data from a cherry-picked hemisphere”. I don’t do any climate sensitivity calculations in this post. I’ve cited Hegerl 2000 which uses proxy data (not instrumental data) over the last 750 years to calculate a best guess climate sensitivity of around 3 degrees C. I’ve also compared this to the IPCC climate sensitivity range of 2°C to 4.5°C which is based on the full body of evidence (eg – proxy data over the last millennium, global instrumental data going back to 1850, global climate responses to volcanic eruptions, global satellite measurements of outgoing radiation, etc).
Thanks John,
I put your comments on the top of the article.
Pingback: Skeptical Science : Climate Sensitivity – Negative | Real Science