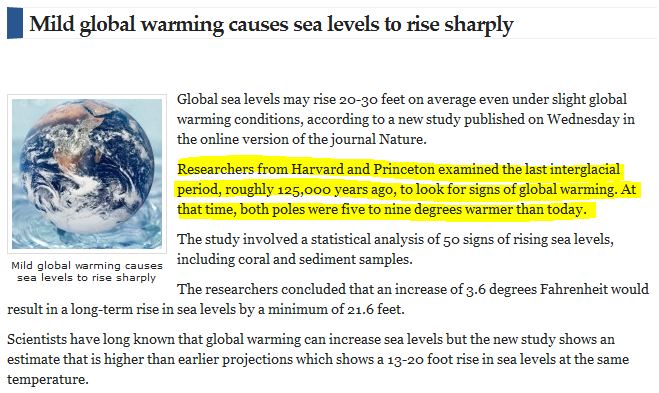
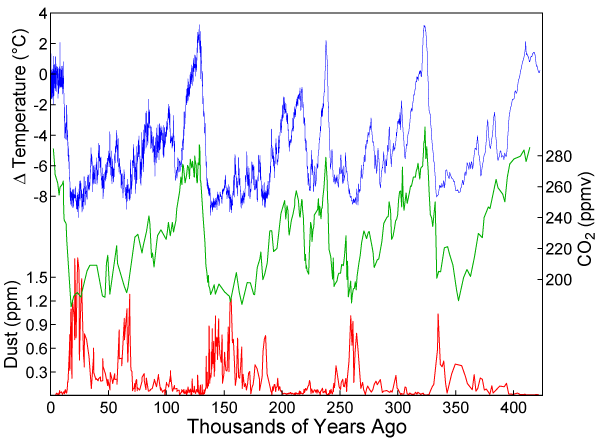
The authors say that temperatures at the poles were five to nine degrees higher 125,000 years ago. Yet CO2 levels were considerably lower – at 280 ppm.
http://www.globalwarmingart.com/wiki/File:Vostok_Plot_png
Whatever was driving the higher temperatures was not CO2. Co-author Michael Oppenheimer apparently failed to recognize the key logical finding of his study.
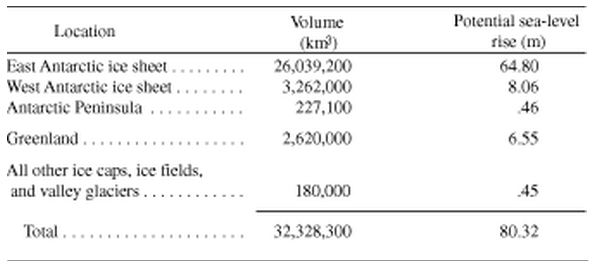
Besides that problem, another issue is that it would require many thousands of years to melt enough ice to raise sea levels that much. All of the ice in Greenland would have to melt. There are only a few weeks a year where melt is even remotely possible in the interior of the ice sheet. Last summer never got above freezing in Greenland’s interior.
http://pubs.usgs.gov/fs/fs2-00/
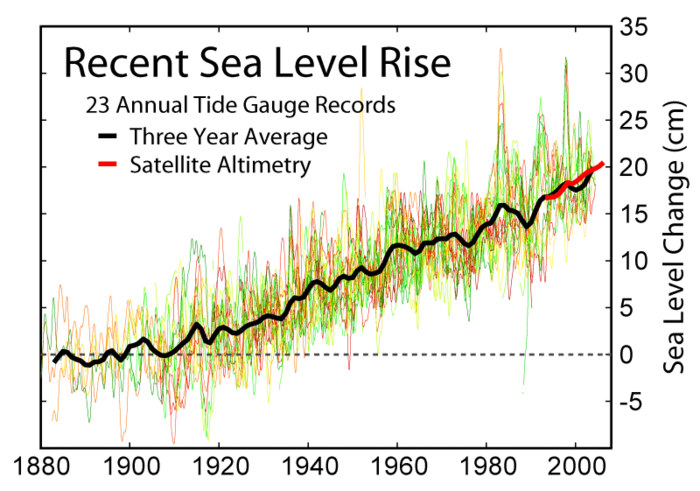
Sea level has been rising at a steady rate of six inches per century. It will require 4,000 years for sea level to rise 20 feet.
http://www.globalwarmingart.com/


Maybe they should have taken the hint displayed in the graph they provided.
3 of the last 4 interglacials were warmer than this one and the CO2 was lower. All 4 of the IGs shown were shorter than the current one unless the current one started to dissipate 5K years ago as it appears in the ice cores from Greenland and Antarctica.
Now of course those records show that we are currently experiencing natural climate variation that the globe has experienced since this global Ice Age started some 3.5 Million years ago.
I will add there is some debate as to the original start date of the current Ice Age as there is evidence that it may have started over 38 Million years ago or longer when a continental plate covered the South Pole. Freeze dried sea life has been found on Antarctica that was dated 38 million years before present.
The scary thing about the graph is the short time the interglacials last. The point being Ice ages are easier to start than to end.
Once the ice starts to move south across Canada it won’t stop.
This the real danger. Future generations might even consider adding extra greenhouse gases to the atmosphere to prevent this. Perflourinated compounds would probably be most effective. Unfortunantely CO2 is a weak greenhouse gas, so adding more CO2 isn’t much use.
An interesting aspect of the Temperature and CO2 graphs is that once again temperature increases occur before CO2 increases; not CO2 increases followed by a temperature increase.
If there are to be fears (or a search for solution) I would say preparing or preventing another ice age should be high on the list as well as preventing a earth /comet/asteroid collision.
The probability of a future ice age is probably 100% and more importantly the probability of a world stunting cooling period in the next 4000 years is probably higher than a 20-30 foot sea level rise.
If we could only have a forward looking time machine to see our true potential problems, the rear looking time machine some how is dulled.
“Besides that problem, another issue is that it would require many thousands of years to melt enough ice to raise sea levels that much. All of the ice in Greenland would have to melt. There are only a few weeks a year where melt is even remotely possible in the interior of the ice sheet. Last summer never got above freezing in Greenland’s interior.”
First it does not take “thousands of years” to lose enough ice to raise sea levels that much. Why don’t you take a look at sea level changes over the last 20,000 years and then revise that statement. Its idiotic. Look at the massive meltwater pulses that raised sea levels very quickly in short periods.
Secondly, All of Greenland would not have to melt, you could lose some of Greenland and some of West Antartica
Thirdly, you insinuate that ice losses can only occur where melt occurs. I’ve already shown you in the past that dynamical ice processes and ice velocities DOMINATE the ice loss signals in Ice Sheets and explain their contributions to Sea Level Rise
http://www.skepticalscience.com/Part-One-Why-do-glaciers-lose-ice.html
Finally, Greenland’s interior is not where most ice losses occur, why don’t you look at the coastal regions in greenland where according to the arctic report card, greenland had the largest melt season on record and the warmest year on record. Ice losses were also 25% to 40% greater than in an average year.
Please stop the disinformation. It is very clear glaciology isn’t a subject you are willing to grasp. If you do grasp it then it means that you are willfully neglecting facts and hiding from your readers. Why don’t you just stop commenting on these sorts of things until you do a little research and learn how ice sheets lose ice….
When there was massive amounts of ice at low latitudes and low elevations, it was easy to raise sea level. The ice is now located at high latitudes and at high elevations. Obviously it is much more difficult to melt the ice now.
Sea level is rising at 6 inches per century. You should think some of these issues through before you post.
Sea level rise is around 3mm/year currently.
http://www.worldclimatereport.com/index.php/2009/07/22/sea-level-rise-an-update-shows-a-slowdown/
Greenland Ice loss is accelerating.
http://news.bbc.co.uk/1/hi/8357537.stm
At this rate (273 thousand million tonnes of ice/year) it is possible to calculate the amount of time for the whole ice sheet to melt.
Total Ice sheet volume = 2620000 km3
Yearly ice loss = 273 km3
2,620,000 km3/273km3 = 9,500 years
http://ecocentric.blogs.time.com/2010/09/09/climate-change-a-slowdown-on-polar-melt/
A joint team of American and Dutch scientists took another look at the GRACE data and found that Greenland and West Antarctica may be melting just half as fast the earlier studies estimated. As researcher Bert Vermeersen, a professor at Delft University of Technology in the Netherlands, told the AFP, the earlier estimates failed to account for glacial isostatic adjustment—the rebounding of the Earth’s crust after the end of the last Ice Age:
Do you think that pointing to Wu et al. 2010 is going to make me fret or something? Since Wu et al’s estimate of 107 GT/yr for Greenland came out there has been two other papers which disagree with those conclusions. Bamber et al. 2010 and Sorensen et al. 2010. Bamber et al. 2010 even responded in the commentary on why they chose not to use Wu et al. 2010 estimate as its own and concluded that it was not the best estimate because it uses only 3 GPS stations and none within central Greenland or inner antarctica.
Bamber et al. 2010
166 Gt/yr
Sorensen et al. 2010
237 Gt/yr
Grace has the greatest uncertainty amongst the instruments. The least uncertainty comes from laser altimetry like Sorensen et al. 2010. This is elevation differencing. They just measure the heights across the ice sheet and compare it year to year. Finally, since when did losses of over 100 Gt/yr become something skeptics like you would champion? I only hope you give Sorensen et al. 2010 and Bamber et al. 2010 the same airtime you give Wu et al. 2010
They don’t fit your preconceived conclusions though right?
Furthermore, even the Wu paper doesn’t affect the rate at which Greenland ice loss is acelerating. Your calculation assumes that the loss rate remains constant. This is clearly not the case. It is accelerating.
> At this rate (273 thousand million tonnes of ice/year) …
> Yearly ice loss = 273 km3
Uh, you changed the unit from tonnes to cubic kilometers, so you divided volume by weight to get your 9,500 year estimate. And you didn’t take the accelerating rate of loss into account, either.
Wow! Robert:
You came here with “Scepticalscience as a reference site????? Then you claim someone else is disseminating false information.
Have you studied Vulcanology lately to see the primary cause of ice loss on both Greenland and Antarctica? If not for the Gakkel Ridge and a strong Gulf Stream we would be able to walk from Europe to Greenland just like they could during the LIA.
Glaciers always lose ice and always gain ice depending on “Climate / weather conditions. The trick is to observe mass balance over long periods of time, as in thousands of years, not a brief slice of time such as 30 or even 60 years.
I might add that the ice mass balance has been recorded in geologic records and shows a natural variation that we are currently well within the bounds of both extend variations and speed of change. By geologic standards the mass balance is not even changing, or not enough to be statistically significant.
Mike Davis,
I study glaciology and have extensively studied remote sensing of ice sheets/mountain glaciers. Your little digressions about volcanism aren’t at all explaining the mass changes at the 3 ice sheets and are not supported by the scientific literature in glaciology. Get a clue. And also, skepticalscience is a fine website and you’re talking to the author of that article. If you wanna debate who has more experience in glaciology out of me and you then go right ahead?
Goddard,
Do you think that pointing to Wu et al. 2010 is going to make me fret or something? Since Wu et al’s estimate of 107 GT/yr for Greenland came out there has been two other papers which disagree with those conclusions. Bamber et al. 2010 and Sorensen et al. 2010. Bamber et al. 2010 even responded in the commentary on why they chose not to use Wu et al. 2010 estimate as its own and concluded that it was not the best estimate because it uses only 3 GPS stations and none within central Greenland or inner antarctica.
Bamber et al. 2010
166 Gt/yr
Sorensen et al. 2010
237 Gt/yr
Grace has the greatest uncertainty amongst the instruments. The least uncertainty comes from laser altimetry like Sorensen et al. 2010. This is elevation differencing. They just measure the heights across the ice sheet and compare it year to year. Finally, since when did losses of over 100 Gt/yr become something skeptics like you would champion? I only hope you give Sorensen et al. 2010 and Bamber et al. 2010 the same airtime you give Wu et al. 2010
They don’t fit your preconceived conclusions though right?
Sea level rise has slowed over the last five years.
What’s your point? Cazenave et al. 2009 concluded that the sea level rise we observe is now being contributed more and more by ice sheets whereas the thermal expansion has reduced its impact on SLR.
Stop changing the subject. It’s like every time you get flagged for not knowing a thing about glaciology you try to squirm away by changing the subject or making unsubstantiated claims.
http://stevengoddard.wordpress.com/2010/10/25/sea-level-data-shatters-the-hype/
“Sea level is rising at 6 inches per century. You should think some of these issues through before you post.”
How do you substantiate this claim?
3.1 mm/year = 1 Inch every 8 years
= 12.5 inches in 100 years
= Goddard Can’t do math
= Goddard misrepresented by 50%
=Robert isn’t surprised Goddard would fudge the data and hope people wouldn’t notice
http://www.epa.gov/climatechange/science/recentslc.html
Says the average is 6 inches. That from the mighty EPA.
Says the average is 6 inches. That from the mighty EPA
Good God. Can you read? That was the 20th century average from tide gauges. It is not the current rate as measured by satellite:
Robert:
I bow to your fantasies. You sound like Wabbit and the other deluded contributors at the alarmist sites. You probably also believe that modeling is experimenting.
Cherry pick your so called facts but please try to sound a bit more plausible if you want to be believed.
When it comes to glaciers, what happened 800 years ago set in motion the events we are observing today.
Glaciers gain and lose. It is all a part of the natural variations they go through.
Of course you should also be familiar with the issue that the results of using a SWAG to base your modeling on can only result in a SWAG. GIGO!
robert always show up with this stuff…ice calving from advancing glaciers is caused by global warming…and the loss of resistance from said ice at the front of the glacier somehow makes it speed up…never mind that the glacier blasts through miles and miles and tons and tons of rock on it’s way to the ocean. i sit on my porch now looking at a 3,000 foot wall…carved by a glacier!! and i drive over a sizable moraine every time i leave or return to town….suppose that giant pile of rock might have more resistance that floating ice?
and sure glaciers have been receding…and advancing….and receding.
or am still buried under several hundred ft of ice right now??
here is a discussion of the last interglacial:
http://wattsupwiththat.com/2010/09/10/study-arctic-was-5c-warmer-during-the-lig-last-interglaciation-than-at-present/
for your edification, the source paper
http://chubasco.fis.ucm.es/%7Emontoya/cape_lig_qsr_06.pdf
same conclusion…nothing to do with CO2
There is some evidence that the globe currently has more H2O in the frozen state than was locked up during 3 of the last 5 Glacial maximums.
Over the last 8 thousand years there have been at least 8 periods with less ice than we currently have and some locations currently under ice had been ice free long enough for forests to establish 1K further north of higher in elevation than forests exist today.
Evidence of CHIA does not impress me much!
There is some evidence that the globe currently has more H2O in the frozen state than was locked up during 3 of the last 5 Glacial maximums.
Source this, please?
CO2 is good.
I say put another log on the fire.
More CO2 = More food.
ChrisD:
I am not an Encyclopedia on this stuff but I have read a bit about geology and and historic climate changes.
If the Antarctic Ice Sheet is Millions of years old and ice that was deposited there more than 800 thousand years ago is still there and did not melt during past interglacials when it was warmer than today. The globe has been cooling for “Millions” of years and during each transition into glacial maximum the more water is locked up in ice than before.
Even during our current “Global warming period” the ice mass on the major ice sheets is growing as is evident at locations like Vostok and GRIP locations where habitations have to be jacked up to keep from being buried.