Anthony and I have noticed lots of comedy going on with the GISS Godthab graph. Here is another dose of GISS humour.
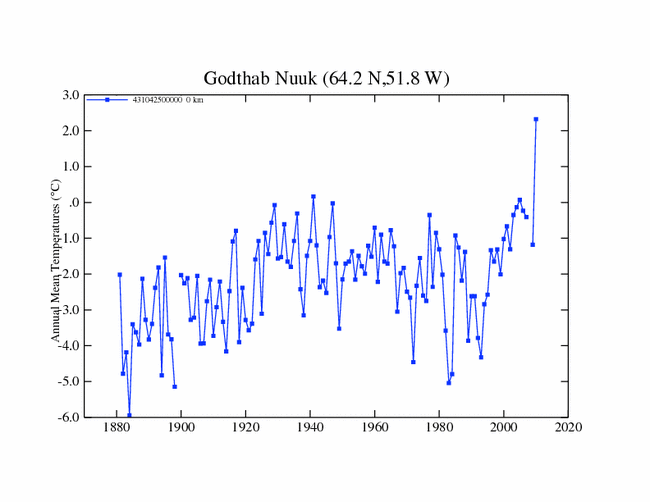
The graph below shows temperatures before homogenization, including the bogus 2010 data.
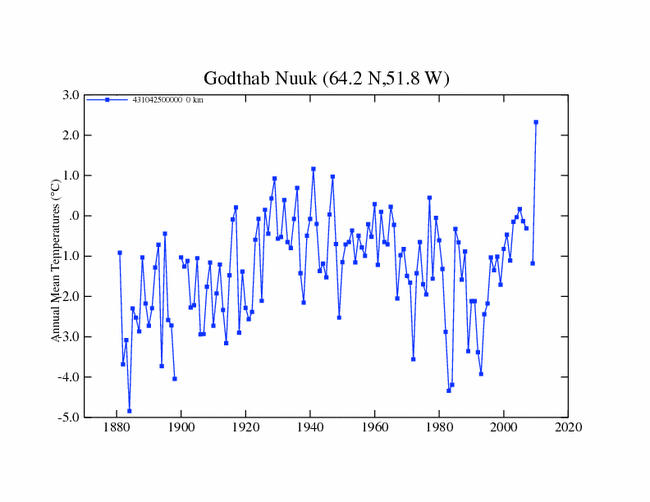
The next graph shows how they made the past cooler through the magic of homogenization. The 1940s retroactively dropped a full degree!
A computer program which automatically rewrites history. How cool is that?

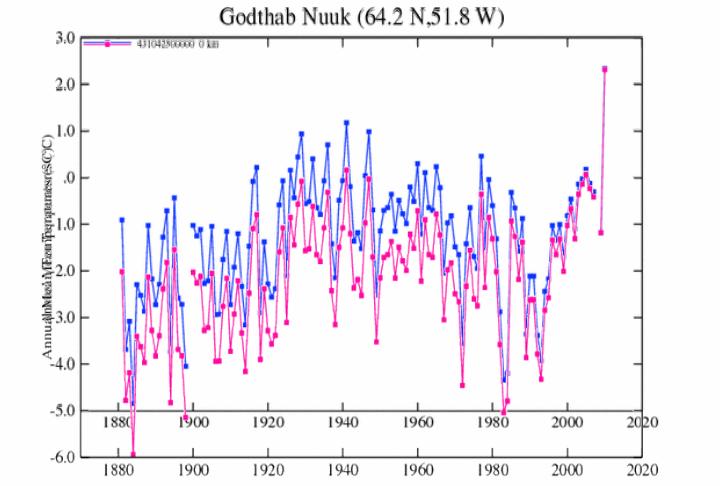
The graph below shows the two superimposed at the same scale. Homogenized in pink.
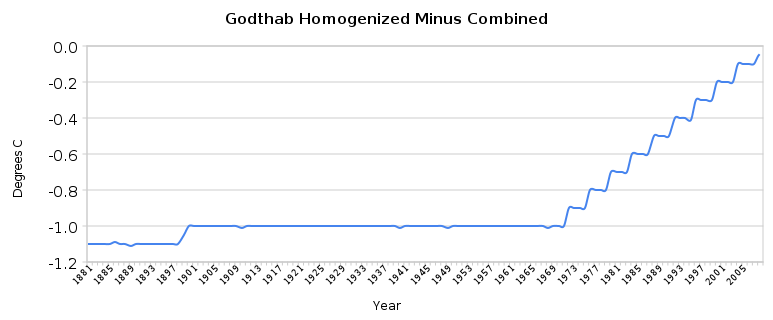
But here is the fun part. The graph below shows the annual homogenization adjustments.
WTF? Maybe the thermometer is located on a glacier sliding into the sea.


Graphs are same size, different scale making visual comparison almost impossible. Can you superimpose them please or let me know where the original values are? -thanks
Good idea. I added that.
The future is certain only the past is unpredictable!
Ahh, the invocation of the Al Gore rhythm produces a stairway to climate utopia!
frankly, i have no faith in any graph any gov’t agency produces. show me the raw data graph, and then they can graph their adjustments, then let them try and explain why they continue to adjust the current temps upwards and the past down.
Now what sort of scientific reasoning do you suppose would be claimed as the reason for that adjustment sequence? Can’t think of one? Me either.
It’s actually worse than we thought :
The population of Godthab has risen from 2,383 in 1951 to over 15,000 today.
Common sense surely dictates that if you homogenize the data by adjusting for UHIE (which given the high energy required to heat buildings in cold climates like Godthab ought to be considerable), then you would expect past temperatures to be adjusted UPWARDS in relation to today.
Listen guy’s it’s ok to tell lies, the future of human kind is at stake.
Every scientist should decide for himself how far he is willing to go to help push our doctrine.
We protect you and and we will organize a white wash when you get caught.
We are the Government, we have the money and we control what’s published in the press and the white wash reports.
You have nothing to worry about.
MUST READ President Vaclav Klaus
http://thegwpf.org/news/1726-president-vaclav-klaus-inaugural-annual-gwpf-lecture.html
lol, well, that killed about an 1/2 hour of work I was suppose to be doing!
And this is surprising because … ?
Start with all the raw data. Do a backcast model run, starting with current temps and see what temps should have been in the past. Since everyone just knows that models are pure and pristine representations of reality, it follows that any raw data points that diverge from the models must be flawed and must be adjusted to correct flaws and bring old data in line with models.
By the time we get to 2100, the many adjusted temperature records will prove conclusively that half the NH land masses were well glaciated in 1900. That’s where that iceberg came that sank the Titanic.
Climate scientists. They make politicians look like paragons of ethical righteousness.
Pingback: AGW’s Logical Impossibility: The ‘Argument Ad Providentiam’ « The Unbearable Nakedness of CLIMATE CHANGE
It’s the stairway to hell.