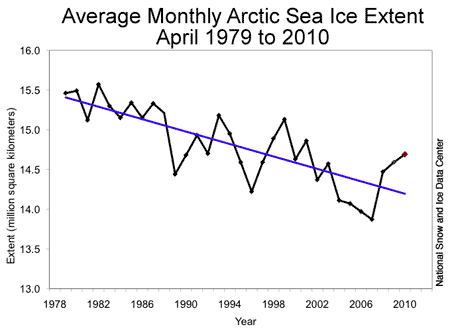
When their web site is working, NSIDC has a graph showing the decline of Arctic ice from the start of the satellite record in 1978 through 2007.
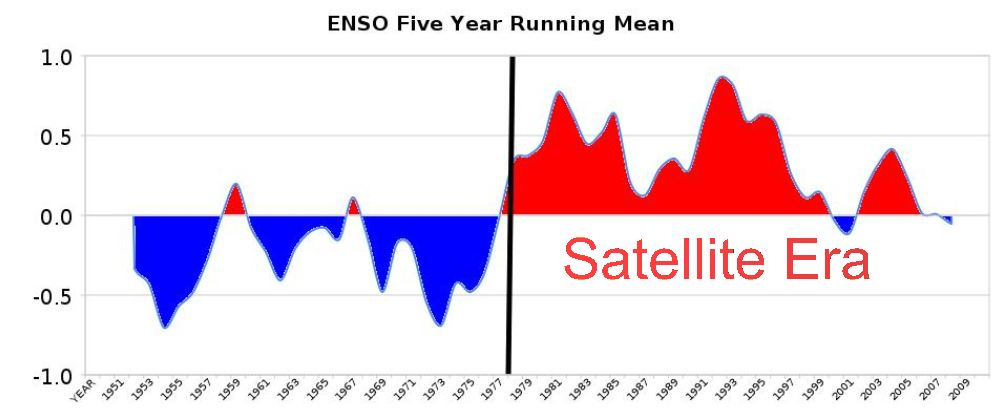
But something else happened in 1978. Something very important for understanding the climate.
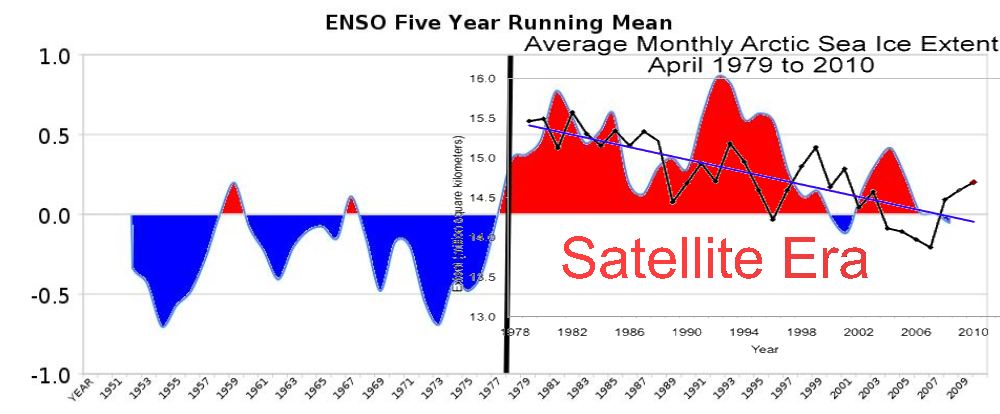
ENSO switched from strongly negative to strongly positive. Since the satellites went up, the planet has been dominated by warm El Niño weather.
Not surprisingly, the ice has declined. Most of the old ice disappeared between 1988 and 1996. Again, not a surprise. That was the peak ENSO period.
ENSO is currently the lowest since 1975. If it stays low, we should continue to see recovery – which appears to have started after the winter of 2007-2008.
http://www.esrl.noaa.gov/psd/people/klaus.wolter/MEI/
The timing of the satellite launches in 1978 was bad luck. It has caused a lot of confusion both about temperature trends and ice conditions.


Can anybody say, “confirmation bias”?
Now all that’s left to do is to see how the next couple of decades play out. Frankly, I’d have more confidence in the pronouncements of scientists if there was no consensus and they were in constant disagreement. Otherwise, it sounds less like science and more like religious dogma or political wheeling and dealing.
There was a time when, in the face of disagreement, scientists would talk and think in terms of “resolution”, not “consensus”. There has been quite a change in mindset in recent years, in some quarters at least.
Before satellites nobody knew about it. I guess in the last 100 years no piece of ice the size of Manhattan ever broke off Greenland, the ice just stood still?
The Titanic found one.
True, see nobody knew about that one and see what happens. Now we know about them and we still try to destroy ourselves 😛
The thing is though, we can see everything now, and we think that we effect it.
http://rps3.com/Files/AGW/EngrCritique.AGW-Science.v4.pdf
Check out Burt Rutan’s part where he shows how small an area all the human’s on earth actually occupy if we squash everyone together and we think we control the weather?
O.K., so say there is a relationship between ENSO and sea ice extent, the strongest El-nino on record happened in 1998, a period when sea ice extent was increasing, which seems to contradict ENSO being responsible for the long term decrease (as I said I would be happy if ENSO were responsible for the long term decrease).
Also is there any reason for choosing to look only at the sea ice extent for April? It wouldn’t be the month that shows the greatest recovery in 2010 would it? Sadly the NSIDC website seems to be down at the moment, so I can’t check.
It’s the same for the Ozone hole, what’s there to prove that it wasn’t there already. Tell me in the 1859 Solar event the hole was not bigger? Solar flares control the size of the ozone hole and secondary volcanic gases, not spray cans.
The strongest El Nino was in 1983.
http://www.esrl.noaa.gov/psd/people/klaus.wolter/MEI/
The NSIDC web site is down, so I can’t get any other graphs.
It depends which index you look at,
http://www.cpc.noaa.gov/products/analysis_monitoring/ensostuff/ensoyears.shtml
But for the sake of argument, I’ll agree to look at MEI instead. If you look at the sea ice extent following 1983, it is basically flat until 1987, so if there is a link between ENSO and sea ice extent, it is surprising that there wasn’t a conspicuous decrease in sea ice extent following the largest El-Nino (according to MEI) and an increase in sea ice extent following the sceond largest in 1998.
Again a regression might be used to estimate an upper limit on the strength of the relationship between ENSO and sea ice extent, but given the lack of response to the very strong 1983 and 1998 El-nino events, it seems probably that any link is rather weak.
La Nina looking strong 😛
http://wattsupwiththat.com/2010/10/14/the-la-nina-has-strengthened/
Shouldn’t CO2 suppress La Nina, I mean all that water warming the poles should hit the tropics, but instead the tropics are cooling.
Why should warm water from the poles “hit” the tropics? I think you will find the transfer of heat is in the other direction. Steves suggestion that ENSO has an effect on the sea ice extent is reasonable, the idea that polar ocean temperatures control Pacific surface temperatures is less so. Generally warm surface waters are transported north from the tropics to the Arctic, where it cools, becomes more dense and returns to the tropics in the deep ocean, not the surface (e.g. the thermohaline circulation).
LOL. Take you first graph
http://woodfortrees.org/plot/hadcrut3vgl/from:1950/to:2011/plot/hadcrut3vgl/from:1950/to:2011/trend
Then compare it to the temps.
http://stevengoddard.files.wordpress.com/2010/10/images-41.jpg
Good going Steve!
You should probably state your point more clearly because I can’t see guess what it is from those graphs.
These guys like saying LOL a lot.
Look a couple of posts further down ;o)
LOL
You are seeing what you want to see Dikran
If Enso is the cause of the melting ice, then how come it bears no similarity to the surface temps for the same period?
http://woodfortrees.org/plot/hadcrut3vgl/from:1951/plot/hadcrut3vgl/from:1951/trend
LOL
Look at the full data set.
http://www.woodfortrees.org/plot/hadcrut3vgl/plot/hadcrut3vgl/trend
I posted the same range as you did for ENSO.
Look at the full data set
Agha
There is a relation. Temperature went up, ice went down. That’s easy to see.
The more these guys talk the more you can see they either don’t understand, or they only want to believe co2 controls climate and no graph or explanation will do anything for them.
Agha
Are you meaning the ENSO graph showing the red El Nino activity doesn’t match what the temperature graph looks like?
The point is there was El Nino dominance. You can see that by the amount of red. The El Nino dominance makes temps go up. You may have been looking for a linear rise in El Nino that would correspond to the linear rise in temps.
If your house is cold and you adjust the furnace to a certain temperature the house will eventually reach that temperature. As the house was reaching the temperature of the thermostat the level of heat in the furnace didn’t rise. It stayed the same. The house eventually got to where the level of heat produced from the furnace was at. The linear trend of heat in the house was up. The linear trend of heat in the furnace was flat. The relation was that the furnace was producing heat and the temp in the house was rising.
You shouldn’t look for a linear trend relation between El Nino activity and temperature of the earth. It’s more so El Nino activity was dominant so earth’s mean temps went up.
If you’re looking for a similarity in trend you can look at solar activity and temperatures. There is a better relation there.
Correlation is not causation. The radiative forcing from GHG has also been increasing and a correllation can’t tell you which explanation is best. So if your argument is based only on a correllation, it isn’t as good as one that fits the data just as well and has a specified physical mechansim that is well understood (according to Roy Spencer).
“It has been calculated theoretically that, if there are no other changes in the climate system, a doubling of the atmospheric CO2 concentration would cause less than 1 deg C of surface warming (about 1 deg. F). This is NOT a controversial statement…it is well understood by climate scientists. (As of 2008, we were about 40% to 45% of the way toward a doubling of atmospheric CO2.)”
http://www.drroyspencer.com/global-warming-101/
The direct effect (without feedback) is indeed fairly weak, but as Dr Spencer says, that CO2 is a greenhouse gas, and its direct effect is not contraversial. Both sides of the argument agree on that.
How could a Pacific Ocean full of unusually warm water cause the temperature to warm up? Pure coincidence no doubt.
I can pull out some statistics to show that warm water isn’t really warm.
blah blah blah blah ……
Oh well, attempts at rational discussion have ended early on this thread then. I didn’t say that ENSO has no effect on arctic temperatures, just that a correllation doesn’t tell you how much of an effect it has, and that as the physics shows GHG increases will have an effect (uncontraversial according to Dr Spencer), we can’t decide just by looking at graphs how much is CO2 and how much is ENSO.
For that you need proper analsys.
Dikran Marsupial
Hi clone.
You write as if you did not read or understand the article.
Dikran Marsupial says:
October 14, 2010 at 11:56 am
Correlation is not causation.
Is the correlation between co2 and temperature causation?
There is asserted to be a causal relationship, but it isn’t based solely on a correllation, there is quite a lot of physics been done to understand why there is a correlation between GHG and temperature, which is why as Dr SPencer says, the basic effect is uncontraversial.
I’ve noticed that global warming believers can always find rationale for co2 but never for anything else.
Dikran Marsupial says:
October 14, 2010 at 12:06 pm
Oh well, attempts at rational discussion have ended early on this thread then.
You mean your attempts to make people think like you have ended early.
Dikran Marsupial says:
October 14, 2010 at 11:56 am
“It has been calculated theoretically that, if there are no other changes in the climate system, a doubling of the atmospheric CO2 concentration would cause less than 1 deg C of surface warming (about 1 deg. F). This is NOT a controversial statement…it is well understood by climate scientists.
Can I have a link to this.
Dikran,
“It has been calculated theoretically that, if there are no other changes in the climate system, a doubling of the atmospheric CO2 concentration would cause less than 1 deg C of surface warming
You are saying this is what Roy Spencer said?
It is a direct quote from his web page, I gave the link when I first used it earlier in the thread:
http://www.drroyspencer.com/global-warming-101/
You did take it out of its context. Not surprising you did. If you had read one sentence more you would have seen this:
“BUT…everything this else in the climate system probably WON’T stay the same!”
You left out Roy Spencer’s work on negative feedback which is one of the things not incorporated into these co2 calculations.
This 2 part video series points out where you have taken what he said out of context:
http://www.youtube.com/watch?v=xos49g1sdzo
Part 2
http://www.youtube.com/watch?v=LpFk0zTW-ik
Agha
you can see a relation here between ENSO and your graph:
http://stevengoddard.files.wordpress.com/2010/10/ts1.gif?w=640&h=199
and
http://img96.imageshack.us/img96/6455/trend.png
Yeah, what’s causing the longer term increase in temp?
huh?
What time frame? You didn’t specify anything here.
The long term increase in temp and shown in your data.
http://img96.imageshack.us/img96/6455/trend.png
And before you claim ENSO, take a look at the even longer term that covers the negative ENSO period.
http://woodfortrees.org/plot/hadcrut3vgl/from:1900/to:2011/plot/hadcrut3vgl/from:1900/to:2011/trend
You guys are just clutching at straws for any parts of the graph that might align.
Also what caused the sea ice recovery in 1989 and 1996 when ENSo was still very strong. Not much correlation going on there.
must have been co2 Brendon. Is that what you wanted to hear?
The ENSO region is located about 6,000 miles away from the Arctic. Do you expect to see a very tight coupling?
They must, or they wouldn’t talk like this. But they also have no problem believing co2 controls climate even though there still is no data showing it does. Double standards I guess.
Some sort of coupling would be good.
Also the sea ice estimates prior to 1979 when ENSO was negative don’t help your cause.
What are you talking about?
ENSO was negative and sea ice was high.
Have a read at this.
http://wattsupwiththat.com/2010/10/13/scafetta-on-60-year-climate-oscillations/
Or you could read about it here : ;^)
http://stevengoddard.wordpress.com/2010/09/20/what-really-drives-the-climate/
Better yet, read both places ;^)
http://www.scribd.com/doc/34962513/Elsasser1942
Dikran Marsupial says:
October 14, 2010 at 12:17 pm
Please go the above link and read Dr. Elsasser’s paper on Radiative Heat Transfer in the Atmosphere.
Note comment on page 23 about CO2.
Can you give a reference to the paper so I can look it up propely (the link doesn’t work for me).
Pingback: Is Climatology A Thing Of The Past? « The Unbearable Nakedness of CLIMATE CHANGE