Disrupting the Borg is expensive and time consuming!
Google Search
-
Recent Posts
- “Why Do You Resist?”
- Climate Attribution Model
- Fact Checking NASA
- Fact Checking Grok
- Fact Checking The New York Times
- New Visitech Features
- Ice-Free Arctic By 2014
- Debt-Free US Treasury Forecast
- Analyzing Big City Crime (Part 2)
- Analyzing Big City Crime
- UK Migration Caused By Global Warming
- Climate Attribution In Greece
- “Brown: ’50 days to save world'”
- The Catastrophic Influence of Bovine Methane Emissions on Extraterrestrial Climate Patterns
- Posting On X
- Seventeen Years Of Fun
- The Importance Of Good Tools
- Temperature Shifts At Blue Hill, MA
- CO2²
- Time Of Observation Bias
- Climate Scamming For Profit
- Climate Scamming For Profit
- Back To The Future
- “records going back to 1961”
- Analyzing Rainfall At Asheville
Recent Comments
- Bob G on Climate Attribution Model
- Bob G on Climate Attribution Model
- Bob G on Fact Checking NASA
- arn on Climate Attribution Model
- Bob G on Climate Attribution Model
- Bob G on Climate Attribution Model
- Bob G on “Why Do You Resist?”
- Gerald Machnee on Fact Checking The New York Times
- Gerald Machnee on Climate Attribution Model
- Gerald Machnee on “Why Do You Resist?”
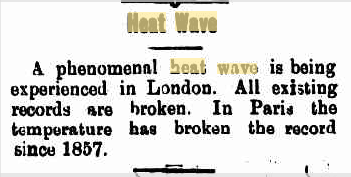
1921 : Record Heat In London And Paris
This entry was posted in Uncategorized. Bookmark the permalink.


2011 record heat in NY and Newark
NY 104° high for that date
Newark 108° new record temperature
Truly amazing . We would only expect 10,950 daily record highs per year in a database with 3,000 stations and a 100 year record.
3,000 / 100 * 365 = 10,950
Steve,
So let’s see that would be 121,545 record highs since 1900.
you are going to have to post A LOT more than you are currently doing to show all the record highs before CO2 started causing record highs!
In the first year, every temperature is a record high. In the second year, half of the temperatures are record highs.
(3000 * 365) + (1500 * 365) + (1000 * 365) + …. + ( 3000 / N * 365 )
where N is the number of years since the start of the database.
Since you and the Ill winded one are pretty much the same.
http://www.youtube.com/watch?v=PMuWyDU3NNg&NR=1
Steve,
so that means that there should be WAY more record highs in the thirties than in the 2000. You still have your work cut out for you!
Of course there would be. In 1895, all temperatures were records
New recored highs in cities and surrounding areas are to be expected as heat islands expand. Anyone who does not understand this does not understand climate.